
Integrating quantitative and qualitative results means putting your statistical findings and your interview or observation findings side by side, reading them together, and drawing one conclusion that both strands support. The integration is fit-for-purpose: each method stays in its own tradition during analysis, then they meet at the point where they address the same research question.
Most mixed methods projects lose marks at exactly this point. One researcher on a Reddit thread in r/QualitativeResearch described coding interviews in NVivo, running the survey in SPSS, then assembling everything by hand in PowerPoint over roughly two full days — and redoing all of it whenever one dataset changed. That is the workflow this guide replaces.
Below is a five-step process, a worked joint display, and sentence templates for the section where you actually defend your conclusions.
Table of Contents
- 1What You Need Before You Combine Anything
- 2How to Integrate Quantitative and Qualitative Results: Step-by-Step
- 3Step 1: Define the Relationship Between the Datasets
- 4Step 2: Create a Clear Integration Plan
- 5Step 3: Compare Quantitative and Qualitative Findings
- 6Step 4: Explain the Integrated Meaning
- 7Step 5: Write the Results and Discussion Together
- 8Common Mistakes in Mixed Methods Integration
- 9Frequently Asked Questions
- 10Can you combine qualitative and quantitative research?
- 11What is it called when you use both qualitative and quantitative approaches?
- 12What are 5 examples of qualitative and quantitative data?
- 13How do I gather quantitative and qualitative data?
- 14Do I need a joint display in a mixed methods study?
- 15What do I do when the qualitative and quantitative results disagree?
- 16Conclusion
What You Need Before You Combine Anything
Integration fails when you start with two finished datasets and look for a connection afterwards. You need four things in place first.
- A design statement. One sentence naming your design — convergent parallel, explanatory sequential, exploratory sequential or embedded — and which strand carries the weight.
- Finished analysis from both strands. Statistical outputs with test statistics, effect sizes and confidence intervals, plus a finished codebook and theme list with illustrative quotes attached.
- A shared construct. The concept both strands measure, in its own words on each side. If the survey asked about “perceived usefulness” and interviews asked about “was it worth the hassle”, you need to argue they are the same construct before you merge them.
- Case identifiers. Participant or case IDs that let you move between the two datasets. Without overlap, your connection has to be conceptual rather than case-level, and you must say so explicitly.
Budget time too. Manual assembly of a joint display takes days, not hours, and it doubles if either dataset gets revised after you start writing.
How to Integrate Quantitative and Qualitative Results: Step-by-Step
Step 1: Define the Relationship Between the Datasets
Write down whether your design is convergent, sequential or embedded, and what that means for the order of your work.
In a convergent parallel design, both strands are collected and analysed in the same phase, then compared. In an explanatory sequential design (QUAN then qual), statistics run first and interviews explain the numbers. In an exploratory sequential design (QUAL then quan), themes generate the survey instrument or hypotheses. In an embedded design, one strand sits inside the other and answers a question the primary strand cannot.
Be honest about what you are doing. Merging methods means forcing both datasets into one method, usually by coding interviews as counts. Integration means each method answers its own question and the answers get combined into a single inference. Committees notice the difference, and reviewers penalise it.
Step 2: Create a Clear Integration Plan
Decide the connection before you write anything, then document it. There are four reliable ways to connect two datasets.
- Shared construct. Both strands address the same concept. Most common, and the easiest to defend.
- Shared cases. The same participants appear in both datasets, so you can compare patterns within individuals.
- Shared research question. Both strands answer one question from different angles — the “how” and the “why” of one question.
- Sequential building. One strand’s output becomes the other’s input: an open-ended survey response set becomes the interview schedule, or interview themes become the scale items.
Write a short integration plan: which connection type you are using, at what stage the strands meet, and what a successful integration would look like. Three sentences is enough. It also becomes a paragraph you can adapt for your proposal or committee submission.
Step 3: Compare Quantitative and Qualitative Findings

Build a joint display — also called an integration matrix — and read it across the rows. Each row is one connection: a qualitative theme beside the quantitative result that speaks to it, with an illustrative quote and your inference.
| Qualitative theme | Illustrative quote | Quantitative result | Relation | Meta-inference |
|---|---|---|---|---|
| Tool anxiety in first use | “I had someone sit with me for the first hour.” | Completion rate 41% for first-time users vs 78% for trained users, p < .01 | Corroboration | Low first-run completion is a support problem, not a motivation problem. |
| Time cost dominates | “The report takes me all of Monday.” | Median weekly time spent 3.5 hours; no significant correlation with satisfaction | Expansion | Time cost is widely felt but is not the driver of satisfaction. |
| Trust from manager support | “My manager actually reads what I send.” | Satisfaction 4.6 vs 2.9 across low vs high support, d = 1.4 | Corroboration | Managerial support is the strongest single predictor in this sample. |
| Feature depth rarely used | “There are tabs I have never opened.” | Advanced features used by 12% of respondents | Silence | Perceived value is low where actual use is low; no conflict to resolve. |
Classify every row before you interpret anything. Fetters, Curry and Creswell’s categories are the useful ones: agreement, expansion (one strand elaborates the other), dissonance (they point different ways), and silence (one strand has nothing on the topic). The table above shows three of the four; dissonance gets its own treatment in Step 4.
Build the display as a living file rather than a slide. Researchers on methods forums report that the manual version breaks the moment a supervisor asks for a re-run of one model.
Step 4: Explain the Integrated Meaning
Now write the meta-inference — the conclusion that only exists because both strands ran. This is the payoff of integration, and it is where most write-ups stop early.
Start with the number, then the explanation. A strong meta-inference uses the qualitative strand to answer why the statistical pattern exists, what conditions it, or whose experience it does not capture. A correlation you can interpret beats a correlation you can only report.
Handle dissonance without panic. When the two strands disagree, three explanations are usually available: the constructs are not actually the same, the two datasets sample different populations or time periods, or one strand missed something the other caught. Test each against your data. A dissertation researcher on a ResearchGate thread raised the related worry — using qualitative data to “validate” quantitative results — and the standard answer is that validation is not integration, because it makes one method a servant of the other.
Then state your weighting. If you weight one strand more heavily, say why: sample size, design priority, saturation of the themes, or the strength of the effect. Unreasoned weighting is a common viva question.
Step 5: Write the Results and Discussion Together
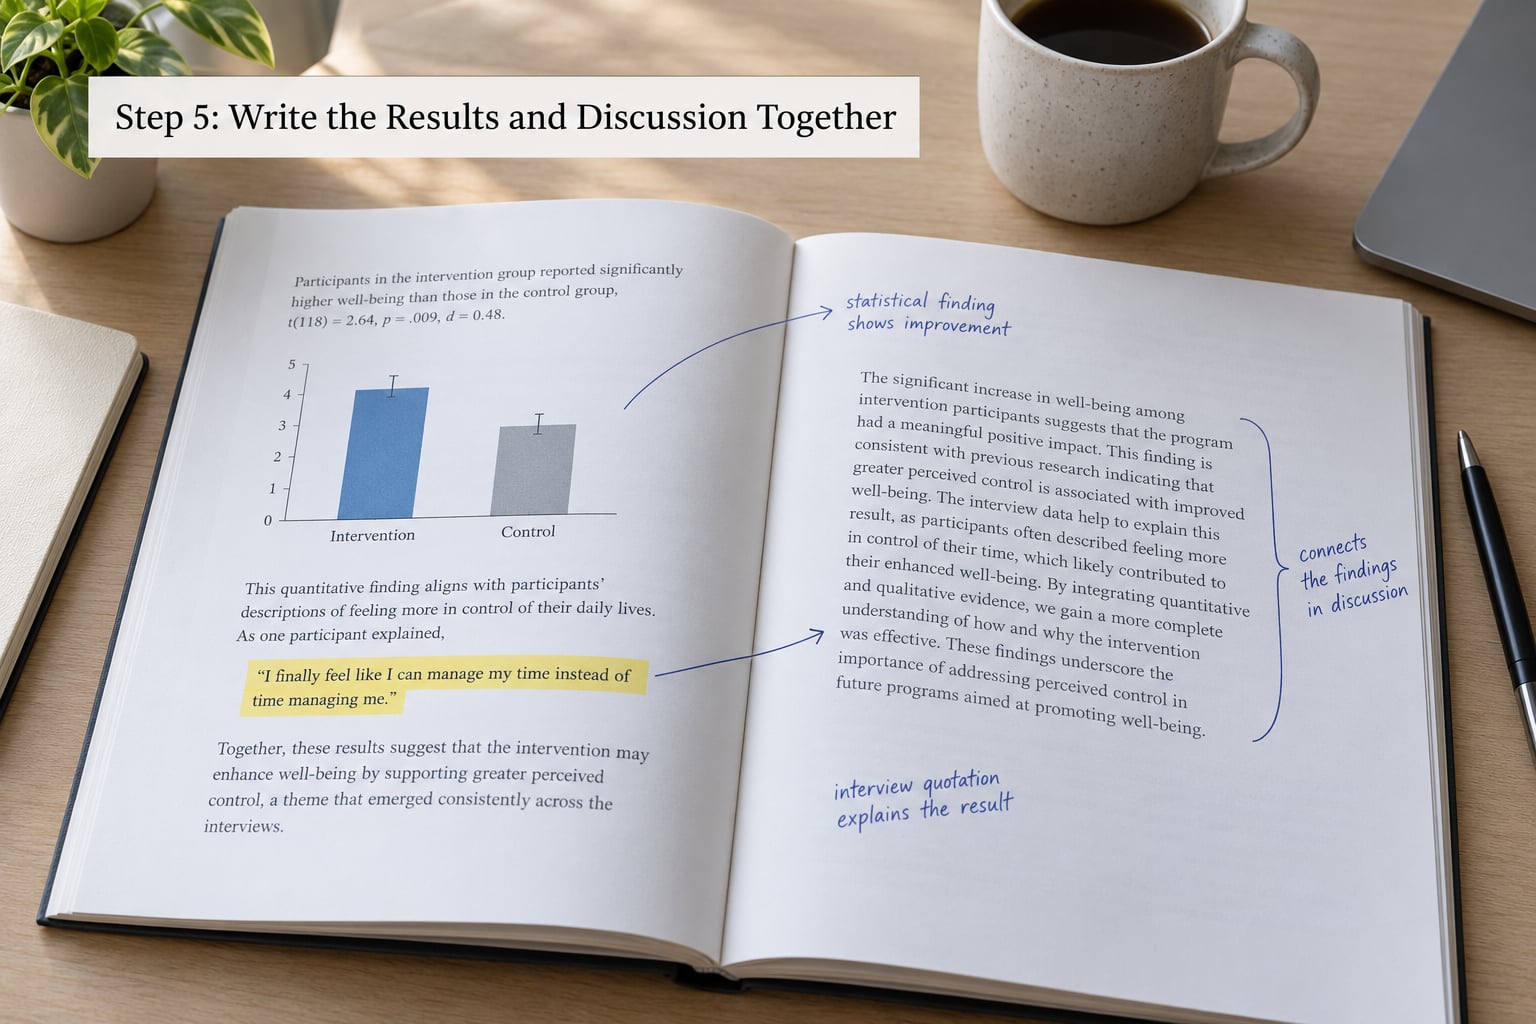
Write one paragraph per integration point, in a fixed four-sentence order. Report the statistical finding, give the qualitative evidence, interpret the connection, then close with the inference.
Template: The quantitative result showing X was corroborated by the qualitative finding that Y. Participant 14 described the same pattern: “…”. Taken together, the integrated evidence supports the meta-inference that Z.
Useful variants for the harder rows:
- The theme of Y adds explanatory depth to the finding of Z by revealing the mechanism behind it.
- Although the two strands diverged on A, both were consistent in indicating that B.
- The qualitative strand qualifies the quantitative result by showing that it holds for one group but not another.
Report your design, your rationale for integration and your limitations in a form your committee recognises. GRAMMS (Good Reporting of a Mixed Methods Study) is the reporting checklist O’Cathain and colleagues developed for exactly this, and it maps cleanly onto the five sections above.
Common Mistakes in Mixed Methods Integration
Overclaiming from a single quote. One vivid quotation illustrates a theme; it does not establish one. Fix: report how many participants in the theme, then use the quote as illustration.
Reporting results and interpretation in the same breath. Mixing them makes it impossible to see what your data showed versus what you concluded. Fix: keep descriptive statistics free of explanation, then interpret in the next paragraph.
Forcing agreement. If the tables only ever show agreement, reviewers assume you left dissonance out. Fix: report dissonant rows as findings in their own right and explain them.
Context-free quotes. Dropping a quote into a results table without the question it answers, the participant’s context, or the theme it illustrates. Fix: attach the source question and theme name to every quote.
Two strands, two chapters, no link. The most common and most damaging problem. Fix: if you cannot write a meta-inference, the design is not integrated yet — return to Step 2 and add a shared construct.
Ignoring disconfirming evidence. Only the rows that fit your argument make it into the table. Fix: keep a full row list first, then select, and note why rows were excluded.
A static joint display. Assembling it in PowerPoint means redoing it after every revision. Fix: build it in a document or spreadsheet linked to your analysis output, or use a platform with a live integration matrix.
Frequently Asked Questions
Can you combine qualitative and quantitative research?
Yes. Combining both is what a mixed methods study does, and it works best when each method answers its own question and the answers are then combined into one conclusion. Treat it as fit-for-purpose integration rather than merging methods into a single technique. The connection usually runs through a shared construct, shared participants, or a shared research question.
What is it called when you use both qualitative and quantitative approaches?
It is called mixed methods research, and the specific arrangement is its mixed methods design: convergent parallel, explanatory sequential, exploratory sequential, or embedded. The term for combining the two sets of findings is integration, and the document used to show it is a joint display or integration matrix. The combined conclusion is called a meta-inference.
What are 5 examples of qualitative and quantitative data?
Quantitative examples: satisfaction scores on a 1 to 5 scale, response time in seconds, monthly churn as a percentage, number of support tickets per week, and a chi-square test result. Qualitative examples: verbatim interview transcripts, observation field notes, open-ended survey responses, diary entries, and focus group transcripts. The first are counts and measurements, the second are words and descriptions.
How do I gather quantitative and qualitative data?
Quantitatively, use surveys with closed and scaled items, experiments, system logs, or existing administrative records, and record the scale and reliability for each measure. Qualitatively, use semi-structured interviews, focus groups, observation, or open-ended survey items, and write field notes as you go. Build the integration in early: overlapping participants, matched sampling frames, and shared constructs make Step 2 far easier.
Do I need a joint display in a mixed methods study?
Most committees expect one, and it is the clearest way to show a reviewer that integration actually happened. A joint display is a table where each row pairs a qualitative theme with the quantitative result it speaks to, an illustrative quote, the relation between them, and your inference. A one-page display with six to ten solid rows beats twenty pages of parallel reporting.
What do I do when the qualitative and quantitative results disagree?
Treat the disagreement as a finding. First check whether the two strands truly measured the same construct and whether the datasets cover the same people and time period. If either is weak, say so. If both hold, offer the explanation the data support, such as an unmeasured moderator. Keep the dissonant row in your joint display rather than dropping it.
Conclusion
Start by putting your two research questions side by side and naming the connection between them in one sentence. If you cannot name it, that is the real problem, and no amount of writing fixes it.
From there the work is mechanical: build a joint display with a row per connection, classify each row as agreement, expansion, dissonance or silence, and write one meta-inference per row. That is how to integrate quantitative and qualitative results into a single argument — the number, the evidence, the connection, the inference — rather than two separate chapters that happen to share a bibliography.