
Data analysis, surveys, research methods
Statistics help that reads like a procedure, not a lecture
Practical, plain-language guides to running and reporting statistical, survey and spatial data analysis, written for the moment you are already mid-task.

Recently published
Latest guides
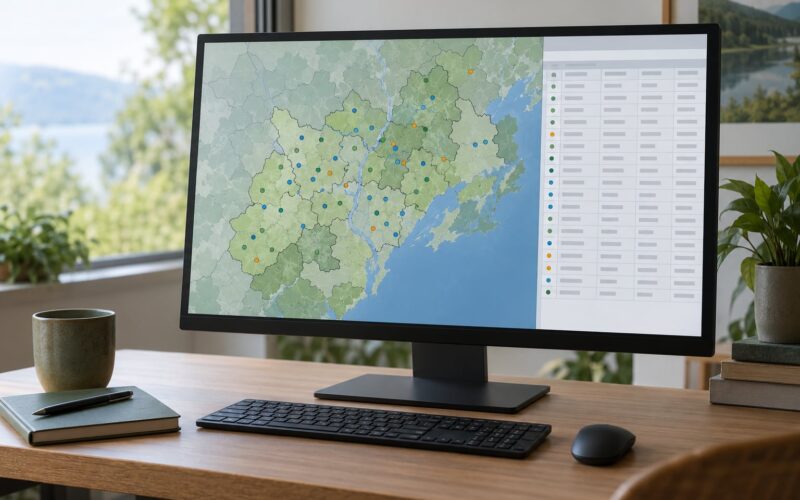
How to Do a Spatial Join in GIS: Easy Step-by-Step Guide (2026)
Learn how to do a spatial join in GIS by matching points, lines, or polygons to another layer, checking results, and fixing…

How to Make a Choropleth Map in QGIS: Easy Guide (October 2026)
Learn how to make a choropleth map in QGIS in : join data to polygons, choose a classification method, style colors and…

How to Share Data and Code with Your Thesis – Easy (2026)
How to share data and code with your thesis: check consent, organize and de-identify files, write a README, choose a repository and…

How to Back Up Research Data Safely: Simple 3-2-1 Guide 2026
Learn how to back up research data safely with the 3-2-1 rule, secure storage options, and restore drills. A practical backup checklist…

How to Narrow a Dissertation Topic: 7 Steps (2026)
Learn how to narrow a dissertation topic into a focused, manageable research problem in , with clear variables, feasible methods and a…

How to Read a Kaplan Meier Curve (2026)
Learn how to read a Kaplan Meier curve in : survival probability, the time axis, censoring marks, numbers at risk, median survival…
Asked mid-analysis
Questions this site answers
- —Which test actually fits my data?
- —What do I do when the assumptions fail?
- —How should I clean and code survey responses?
- —How do I write the results up so a reviewer accepts them?

About
What this site is for
Data Analysis Help is a working reference for the parts of research that stall: choosing a test, running it, and reporting what it means in clear language.
It is written for students, graduate researchers and early-career analysts who need a procedure they can follow while the work is still open in front of them.