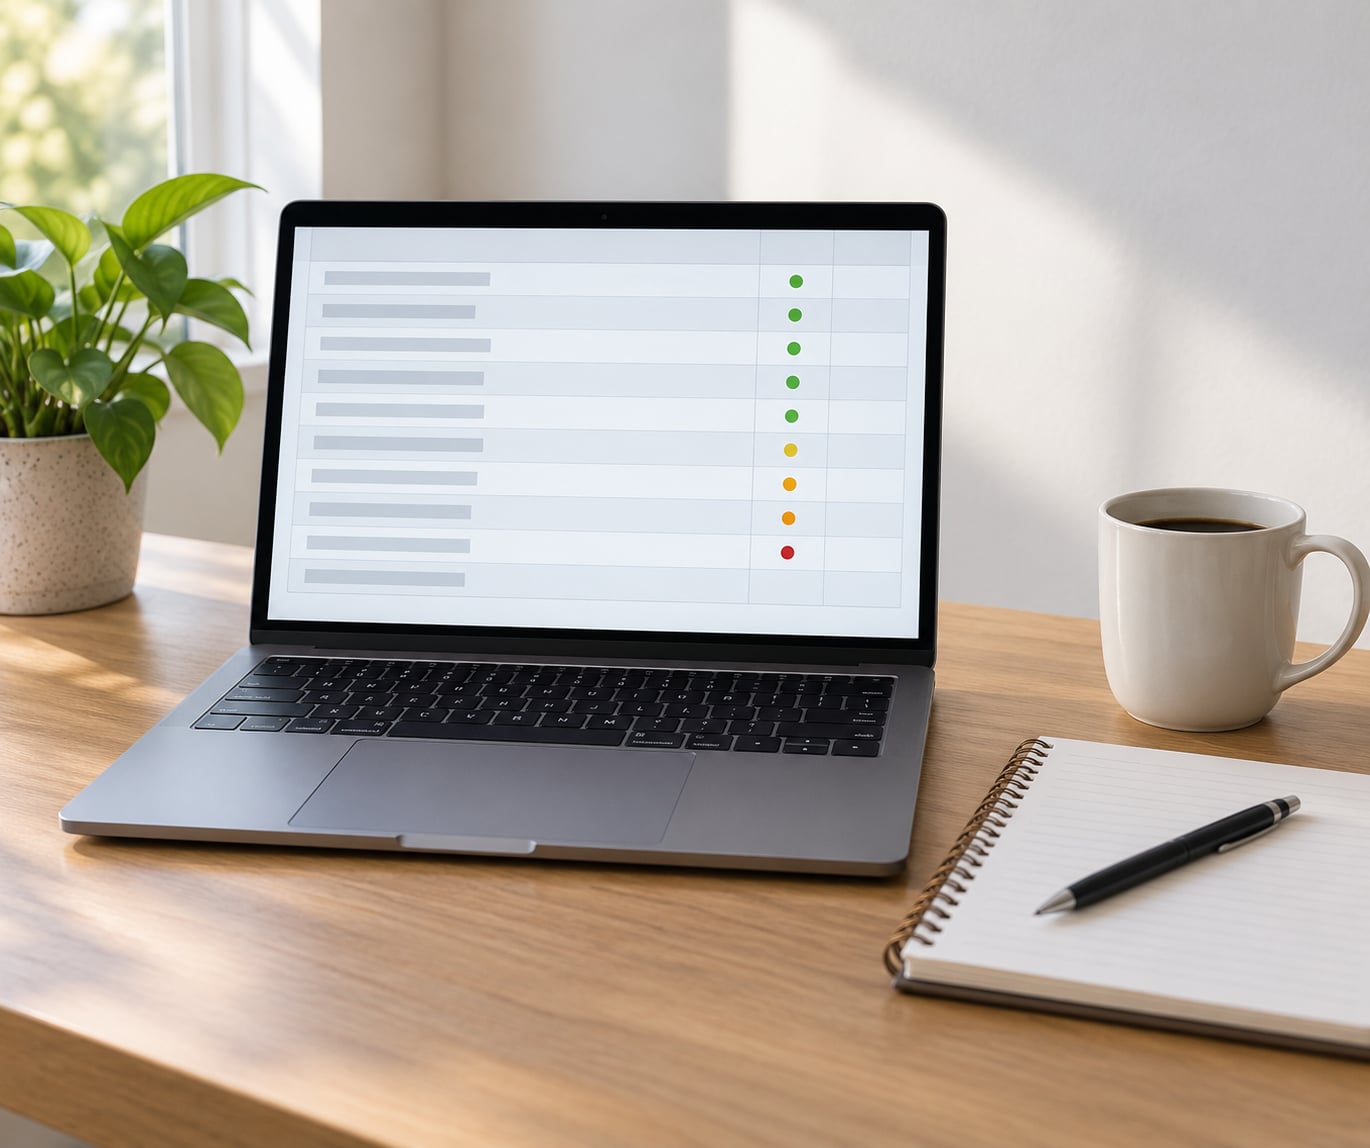
To run analysis on a subset of cases in SPSS, open Data > Select Cases, choose If condition is satisfied, and type a rule such as attended = 1. SPSS marks the included rows with a 1 in the status column and the excluded rows with a 0 and a diagonal slash, then every procedure you run uses only the included rows. It takes about two minutes once the rule is written down.
The catch is that the selection stays active after you close the dialog. Forget to clear it and your next analysis quietly reports the wrong sample, which is the single most common complaint in SPSS help forums. The steps below show the menu path, the syntax version, and how to check that the subset is what you actually asked for.
Table of Contents
- 1What You Need Before You Filter
- 2Step-by-Step: How to Run Analysis on a Subset of Cases in SPSS
- 3Step 1: Define the Rule and Back Up the Data File
- 4Step 2: Use Data > Select Cases for a One-Off Run
- 5Step 3: Use the Filter Button for Repeated Analyses
- 6Step 4: Use Split File to Compare Groups Automatically
- 7Step 5: Run the Procedure and Verify the Case Count
- 8Step 6: Run the Same Subset with Syntax
- 9Step 7: Remove the Selection and Restore All Cases
- 10Common Mistakes and How to Fix Them
- 11Frequently Asked Questions
- 12What is the difference between filtering and selecting cases in SPSS?
- 13Does filtering cases in SPSS delete those rows from the dataset?
- 14How do I select cases based on a text or string variable?
- 15Why does the number of cases in my SPSS output differ from the number of visible rows?
- 16Should I use Select Cases or Split File when comparing two groups?
- 17How do I include only complete cases without deleting missing-value records?
- 18Conclusion
What You Need Before You Filter
You need four things, and two of them take a minute to set up properly.
- A saved data file. Open the
.savfile in the Data Editor. Unsaved changes do not carry a reliable undo, so save first. - A written subset rule. Write the condition in plain language with the exact variable names and coded values, for example “attended the intervention (attended = 1) and scored 70 or more on the pretest (pretest >= 70)”.
- A backup copy. Use File > Save As to duplicate the file before you use Delete Unselected Cases, which cannot be undone.
- IBM SPSS Statistics desktop for Windows or macOS. Menu names have been stable across recent releases, but older versions and other statistical packages label these options differently.
Syntax is optional. It is worth learning once because the rule can be pasted into a later session instead of rebuilt, and because two menu methods (Filter and Split File) have no single click path.
Step-by-Step: How to Run Analysis on a Subset of Cases in SPSS
Step 1: Define the Rule and Back Up the Data File
Ambiguity in the selection rule is what causes bad subsets, so write it in the research conditions language first. If your variable attended is coded 1 for yes and 2 for no, your condition is attended = 1, not attended = 0. Check the codes in Variable View or the Values labels before you type anything.
Then make a copy of the file with File > Save As, and note the total number of cases in the status bar at the bottom of the Data Editor. You will compare that number with the final N later, and a mismatch tells you the rule caught something you did not expect.
Step 2: Use Data > Select Cases for a One-Off Run
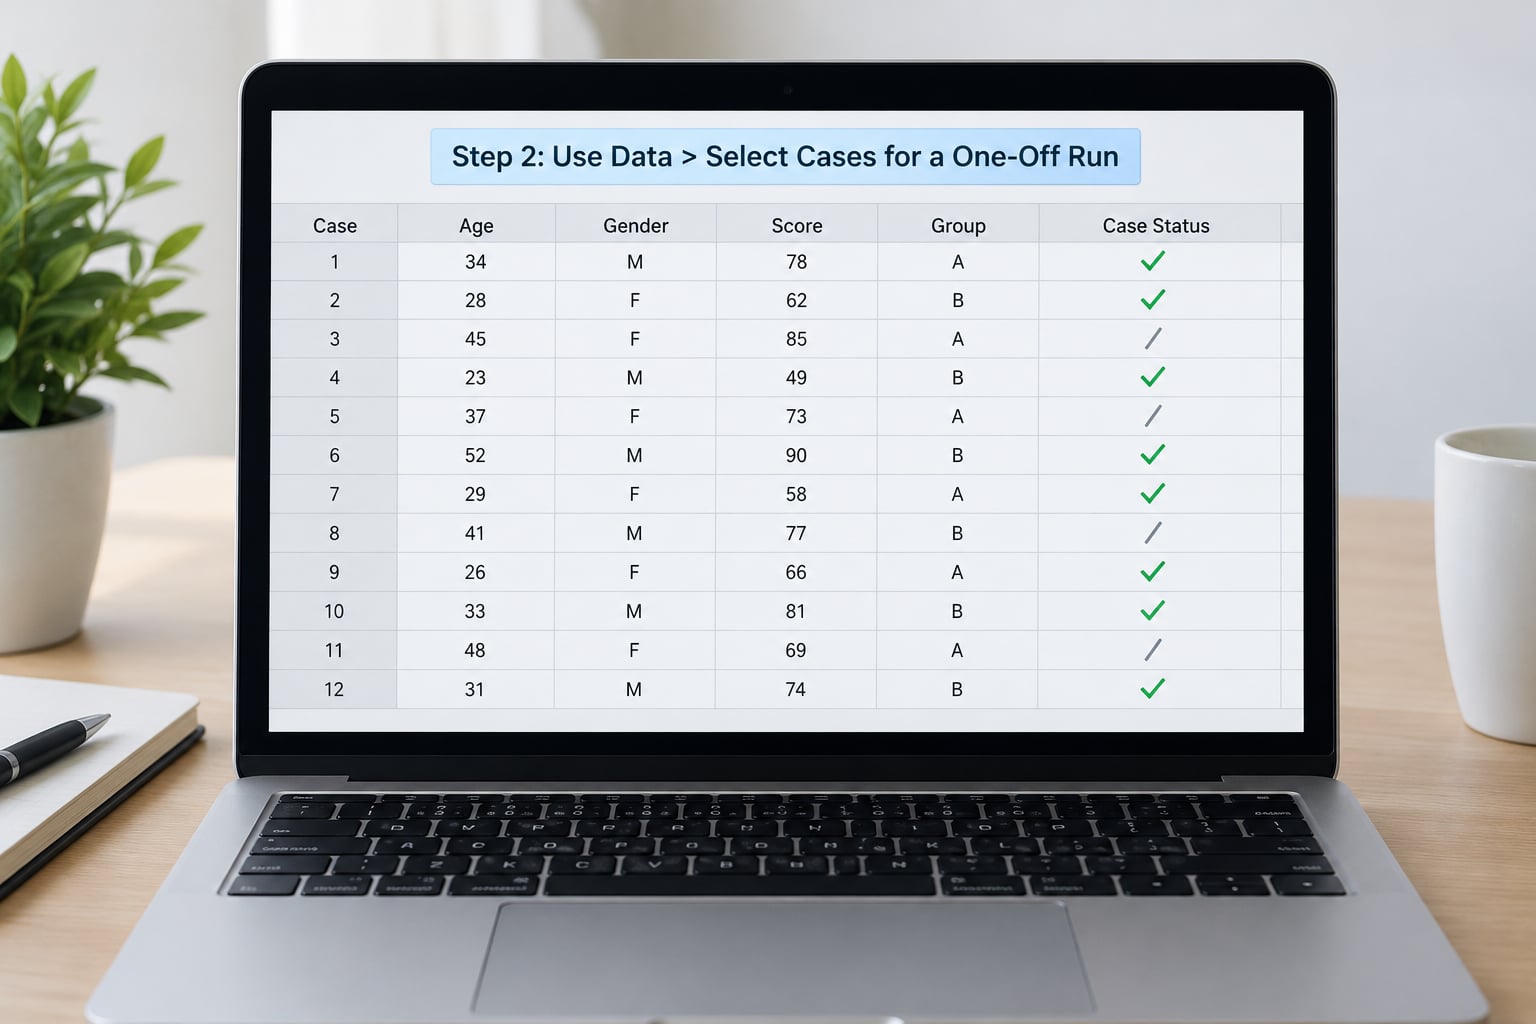
Select Cases is the right tool when you need one specific subgroup and then want everything back to normal.
- Go to Data > Select Cases.
- Under Select, click If condition is satisfied.
- Click the If… button to open the condition builder.
- Build the rule: click the variable in the left list, click the arrow to move it into the expression box, choose the operator, and enter the value. For the worked example, enter
attended = 1 AND pretest >= 70. - Click Continue, then OK.
- Switch to Data View and look at the status column. Selected rows show 1, unselected rows show 0 with a slash through the row number.
Three radio options appear on that first screen, and they behave very differently. Here is the decision in one place:
| Option | What happens to unselected rows | Can you undo it | Use it when |
|---|---|---|---|
| All cases | Nothing changes | Always | Clearing an active selection |
| If condition is satisfied (filter out unselected) | Rows stay in the file and are excluded from analyses and most charts | Yes, choose All cases | One-off subgroup work, and anything you may need to change later |
| If condition is satisfied (delete unselected) | Rows are removed from the dataset in memory and saved with it | No, except by closing the file without saving | Building a permanent sub-dataset, on a copy you no longer need |
| Based on case number or range | Rows outside the range are excluded or deleted by the same rule | Depends on filter or delete | Selecting a block of rows, such as a re-test wave |
Unchecking cases by hand is a fifth route to the same result: click a row number in Data View, untick the little box in the status column, and that row is deselected. It is useful for dropping two or three problem records and risky for anything larger, because you cannot tell later which rows you changed by hand.
Step 3: Use the Filter Button for Repeated Analyses
When you plan to run several procedures on the same subgroup, a Filter saves a click per procedure. A selection made with Select Cases is applied by the menu, but the Filter button toggles the selection on and off directly, and the selection survives between procedures without re-opening any dialog.
Open it with Data > Filter, untick All Cases, and enter the same expression you would use in the If dialog. A yellow bar labelled Filter: [expression] then appears above the output viewer, and it is a useful reminder that something is still restricted. Click the bar, or reopen Data > Filter and tick All Cases, to switch everything back on.
Filtered-out rows remain in the data editor and in the saved file. They are excluded from procedure output and from most charts, so a scatterplot or bar chart drawn after filtering shows only the selected cases, which is usually what you want and occasionally is not.
Step 4: Use Split File to Compare Groups Automatically
Split File does the opposite job. Instead of restricting the analysis to one group, it runs the same procedure once for every group and stacks the output. Open Data > Split File and choose Compare groups to get separate ANOVA or regression tables side by side, or Organize output by group to get one stacked table.
The important detail is what Compare groups does to the Data Editor: while the file is split, you cannot edit the data, and every subsequent procedure is run per group until you unsplit. That makes Split File a poor choice for a single subgroup analysis, and a good choice when you want gender, site, or treatment versus control compared in one pass. Put the file back together with Data > Split File > Organize all cases into one group.
Step 5: Run the Procedure and Verify the Case Count
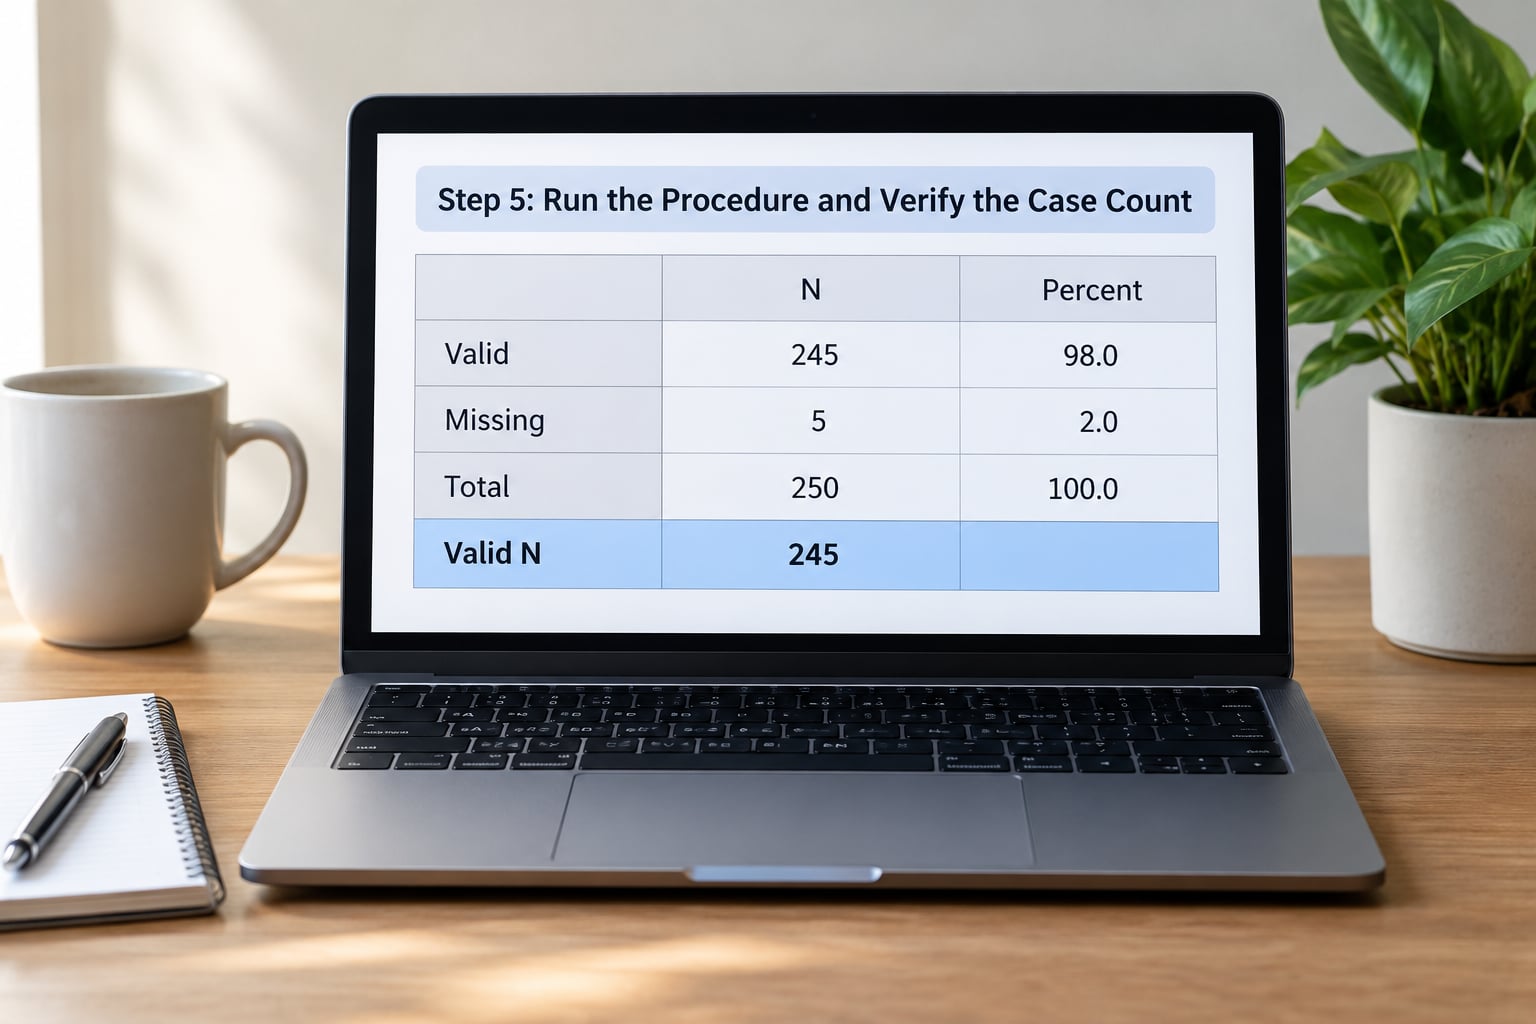
Run your procedure from the Analyze menu as usual, for example Analyze > Descriptive Statistics > Frequencies for counts, or the relevant procedure such as Compare Means or Regression. Nothing about the dialog changes because cases are selected.
Verify before you read anything else. In any Frequencies or Descriptives table, check the Valid N against the number of rows you expected, and check the exclusion count at the bottom of the table. If the Valid N is smaller than the visible row count, missing values on the analysed variable are the usual reason.
Two habits pay off here. First, look at the Notes section of the output, which records the number of cases in the file and the number used. Second, run Analyze > Descriptive Statistics > Frequencies on the selection variable itself, so you see a frequency table of who you kept before you analyse anything else.
One caution: if Data > Weight Cases is switched on for the whole file, descriptives and frequencies are calculated as weighted summaries and can look unfamiliar. Check that it says Do not weight cases unless your design genuinely needs it, and turn it off afterwards.
Step 6: Run the Same Subset with Syntax
Syntax is the reproducible version of the same operation, and it is the only clean way to run a one-off subset without leaving a filter behind. Open the syntax window with File > New > Syntax, paste the commands, and run them with Run > All.
TEMPORARY.
SELECT IF (attended = 1 AND pretest >= 70).
FREQUENCIES VARIABLES=posttest /STATISTICS=MEAN STDDEV MIN MAX.
TEMPORARY tells SPSS that everything until the next command is a scratch transformation: the cases are selected for that one procedure and then the dataset is back to normal. The SELECT IF line is the rule, written the same way as the GUI condition.
Without TEMPORARY, a bare SELECT IF permanently deletes the unselected cases from the dataset in memory, exactly like the Delete Unselected Cases option. The Filter command is the other syntax route:
FILTER OFF.
FILTER $ attendance = 1.
DESCRIPTIVES VARIABLES=posttest BY attended /STATISTICS=MEAN STDDEV.
FILTER OFF.
Where the GUI blocks string variables, syntax handles them too, and comparisons are case sensitive, so region = "North" will not match north. A useful trick for a long list of text values is (UPCASE(condition) = "NORTH"), or a numeric RECODE when the values get unwieldy.
Step 7: Remove the Selection and Restore All Cases
Clearing up takes three clicks and one check.
- Go to Data > Select Cases and choose All cases, then OK. This clears the filter variable and the slash marks.
- If you used a Filter, click the yellow filter bar above the output, or tick All Cases in Data > Filter.
- If you split the file, go to Data > Split File and choose Organize all cases into one group.
- Confirm the status bar at the bottom of the Data Editor shows the original case count and the status column is empty or all ticked.
If a row still shows a slash after step one, the file is split rather than filtered, so handle step three first. In syntax, the equivalent cleanup is a single FILTER OFF.
Common Mistakes and How to Fix Them
Treating a filter as a deletion. Filtered rows are still in the file, still saved, and come back with All cases. When in doubt, check the Data View status column rather than assuming.
Unchecking rows by accident. A stray click in the status column deselects a single case, and the N in your next table is off by one without any warning dialog. Press Ctrl+Z in the Data Editor, or re-run All cases and rebuild the condition.
Filters that seem to fail with several variables. This is the most reported problem on SPSS forums and it almost always comes down to three things: an operator that is not what you think (SPSS uses =, <>, <, >, <=, >=), codes that do not match your data, or an AND where an OR was needed. Test each variable on its own, confirm the N it returns, then add the second condition.
String values ignored. String variables do not appear in every list, and in the condition builder their values go in double quotation marks. If a value is missing from the value list, define it with Data > Define Value Sets or recode the variable to a number first.
Using Split File for a one-off subset. Split File runs the procedure for every group and locks editing until you unsplit. If you only want one group, Select Cases is the shorter path.
Weight Cases left switched on. Weighted descriptives change the N and the mean without any obvious notice. Set it back to Do not weight cases when you are done.
Leaving a condition active for the next analysis. The habit that protects you is to reset to All cases before closing the file, and to paste the condition into your syntax window so the next session is one paste rather than a rebuild.
Frequently Asked Questions
What is the difference between filtering and selecting cases in SPSS?
Filtering excludes unselected cases from procedures and charts while keeping every row in the file. Selecting cases, in the everyday sense, is the broader term that includes filtering, hand-unchecking individual rows in Data View, range selection, and deleting cases permanently. In practice people say filter when they mean the reversible Data u0026gt; Select Cases route with If condition is satisfied.
Does filtering cases in SPSS delete those rows from the dataset?
No. With the filter out unselected cases option, excluded rows stay in the data editor, stay in the saved file, and return in full when you choose All cases. Only the Delete Unselected Cases option removes them from the dataset in memory, and that change is written when you save. Work on a copy if you use it.
How do I select cases based on a text or string variable?
Type the value in double quotation marks, for example region = u0022Northu0022, and remember that string comparisons are case sensitive. If the value does not appear in the value list, add it with Data u0026gt; Define Value Sets, or recode the variable to a number first. In syntax you can also normalise case with UPCASE before comparing.
Why does the number of cases in my SPSS output differ from the number of visible rows?
The usual reason is missing data. A frequency table reports Valid N, which excludes cases with user-missing or system-missing values on the analysed variable, while the filter status column still shows those rows as selected. Check the exclusion count at the bottom of the Frequencies table, and the Notes section, to see exactly how many cases each procedure used.
Should I use Select Cases or Split File when comparing two groups?
Use Split File when you want one procedure run for every group at once, such as gender, site, or treatment versus control, and you want the tables stacked or compared. Use Select Cases when you want one specific subgroup analysed and the rest of the file left alone. Split File also blocks editing until you reorganise all cases into one group.
How do I include only complete cases without deleting missing-value records?
Filter on the variables that matter and add a missing-value test, for example SELECT IF (attended = 1 AND pretest u0026gt; 0), or use NOT MISSING(pretest) so system-missing rows are excluded from the condition rather than silently failing it. Wrap the rule in TEMPORARY so the dataset returns to normal straight after the procedure runs.
Conclusion
Use Select Cases for a controlled one-off subgroup, a Filter when you will run several procedures on the same cases, Split File when you want the program to compare all groups for you, and a TEMPORARY block in the syntax window when the work has to be repeatable. Whichever route you take, write the rule down first, work on a saved copy, and check the N in Frequencies before you quote a single number.