How to save and reuse SPSS output tables comes down to two files: the .spv that keeps every table live in the Output Viewer, and exported copies in Word, PDF, or Excel that you can drop straight into a report. Save the .spv first, then export the tables you actually need.
Most people lose time here because they treat every table as a one-off formatting job. A better approach is to set up the table style once, let SPSS apply it to new results, and keep the output file beside the syntax so the whole thing rebuilds itself next month.
The instructions below follow IBM SPSS Statistics desktop (recent releases, roughly v26 through v32) on Windows. Menu wording shifts a little between older and newer versions, so I note where a label differs. SPSS Statistics Subscription and the free SPSS Statistics Viewer can open .spv files, but only a full desktop licence runs new analyses.
Table of Contents
- 1What You Need
- 2How to Save and Reuse SPSS Output Tables Step by Step
- 3How to Save the Complete SPSS Output File
- 4How to Save and Reuse SPSS Output Tables Across Projects
- 5How to Export Tables to Word, Excel, or PDF
- 6How to Create a Reusable SPSS Table Template
- 7How to Automate Table Exports with SPSS Syntax
- 8How to Organize Saved Tables for Future Reports
- 9Common Mistakes
- 10Frequently Asked Questions
- 11Can I reopen SPSS output tables without rerunning the analysis?
- 12How do I edit a statistical value in a saved SPSS output table?
- 13Why does my copied SPSS table lose its formatting in Word?
- 14Can I copy an output table from one SPSS project to another?
- 15How can I automatically export several SPSS output tables?
- 16Conclusion
What You Need
You need four things, and only two of them are software.
- IBM SPSS Statistics desktop — any recent release. Older versions still support .spv export and OMS, but the export dialog layout differs.
- A saved data file (.sav) or an open syntax file (.sps) — output cannot be regenerated without one of the two. If you have neither, you can still export tables from an open .spv, but you cannot reproduce them.
- A writable project folder — somewhere you can store the .spv, exported tables, and syntax together rather than scattering them across Desktop and Downloads.
- Microsoft Word, Excel, or a PDF reader (optional) — only needed if you plan to check that an exported table stays readable and editable.
One clarification that confuses nearly everyone at the start: the SAVE command in SPSS saves data as a .sav file. It has nothing to do with output. Output is saved through the Output Viewer’s own File menu, and the command that writes output to disk in syntax is OMS.
How to Save and Reuse SPSS Output Tables Step by Step
Here is the full workflow, in the order I would run it: save the output file, export the individual tables, build a template for reuse, then automate the exports once the manual version works.
How to Save the Complete SPSS Output File
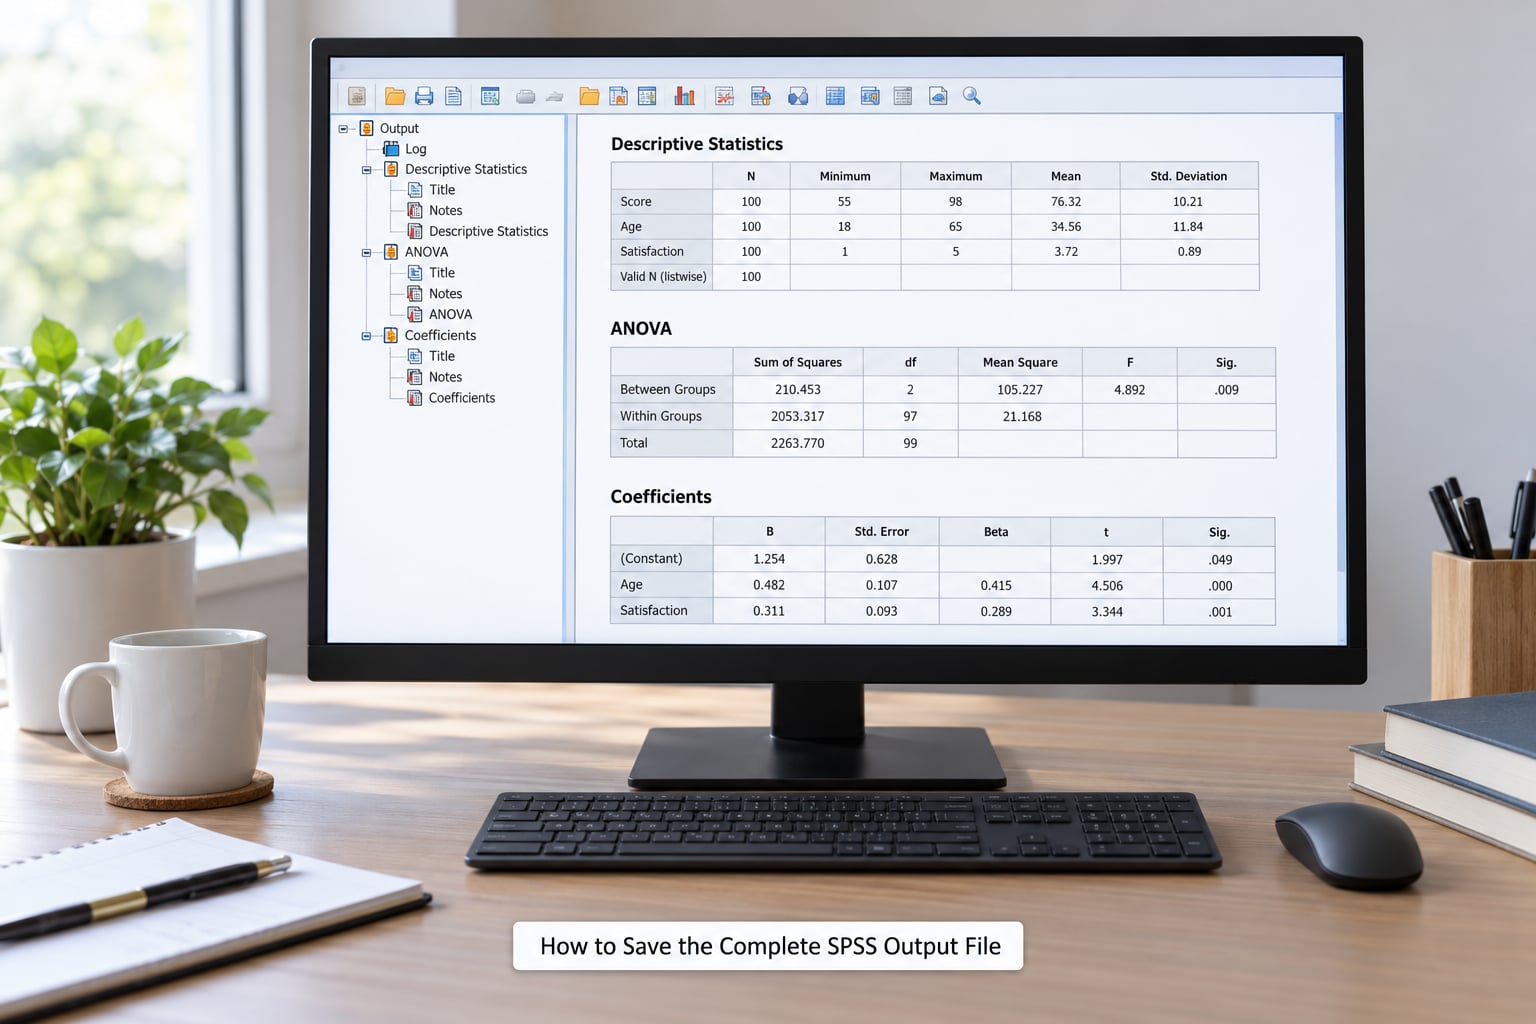
Run your analysis, click the Output Viewer window, then choose File and Save As. Give the file a name you will recognise in six months — something like survey_results_2026_10.spv — and confirm the format is .spv.
How to tell it worked: the title bar at the top of the Output Viewer shows the file name, and the .spv opens again later with every table intact. You do not need to rerun the analysis to see your results, which is the whole point of the format.
Save the .spv each time you add analyses rather than overwriting at the end. Use a dated suffix for milestone versions so a formatting mistake never costs you an afternoon.
How to Save and Reuse SPSS Output Tables Across Projects
Reuse happens at two levels: the whole output file, and the style behind the tables. A saved .spv gives you the first. For the second, you need a table style saved as a .stt file and loaded before you run the next batch.
Set the style up like this:
- Right-click a table in the Output Viewer and choose Table Properties, or open Format and Table Look.
- Adjust the appearance you want — font size, borders, decimal places, column suppression.
- Click Save in the Table Look dialog and give the style a name such as
thesis_bodytext. It saves as a .stt file. - Before the next analysis, open that same dialog, click Load, and pick the .stt file.
- Run the analysis. New tables pick up the style.
That last step is where most people get stuck. A style change applies to tables produced after the change. Tables already sitting in the Output Viewer keep their old look unless you rerun the procedure, which is the single most common question on the r/spss forum.
You can still edit an existing table by hand through Table Properties, but that edit lives only in that table. It does not update the .stt file and it does not travel to the next project.
One more reusability note: keep the .stt file in your project folder and track it in version control if you work with a co-author. Team members otherwise end up with three slightly different “thesis_bodytext” styles and mismatched tables in the same document.
How to Export Tables to Word, Excel, or PDF
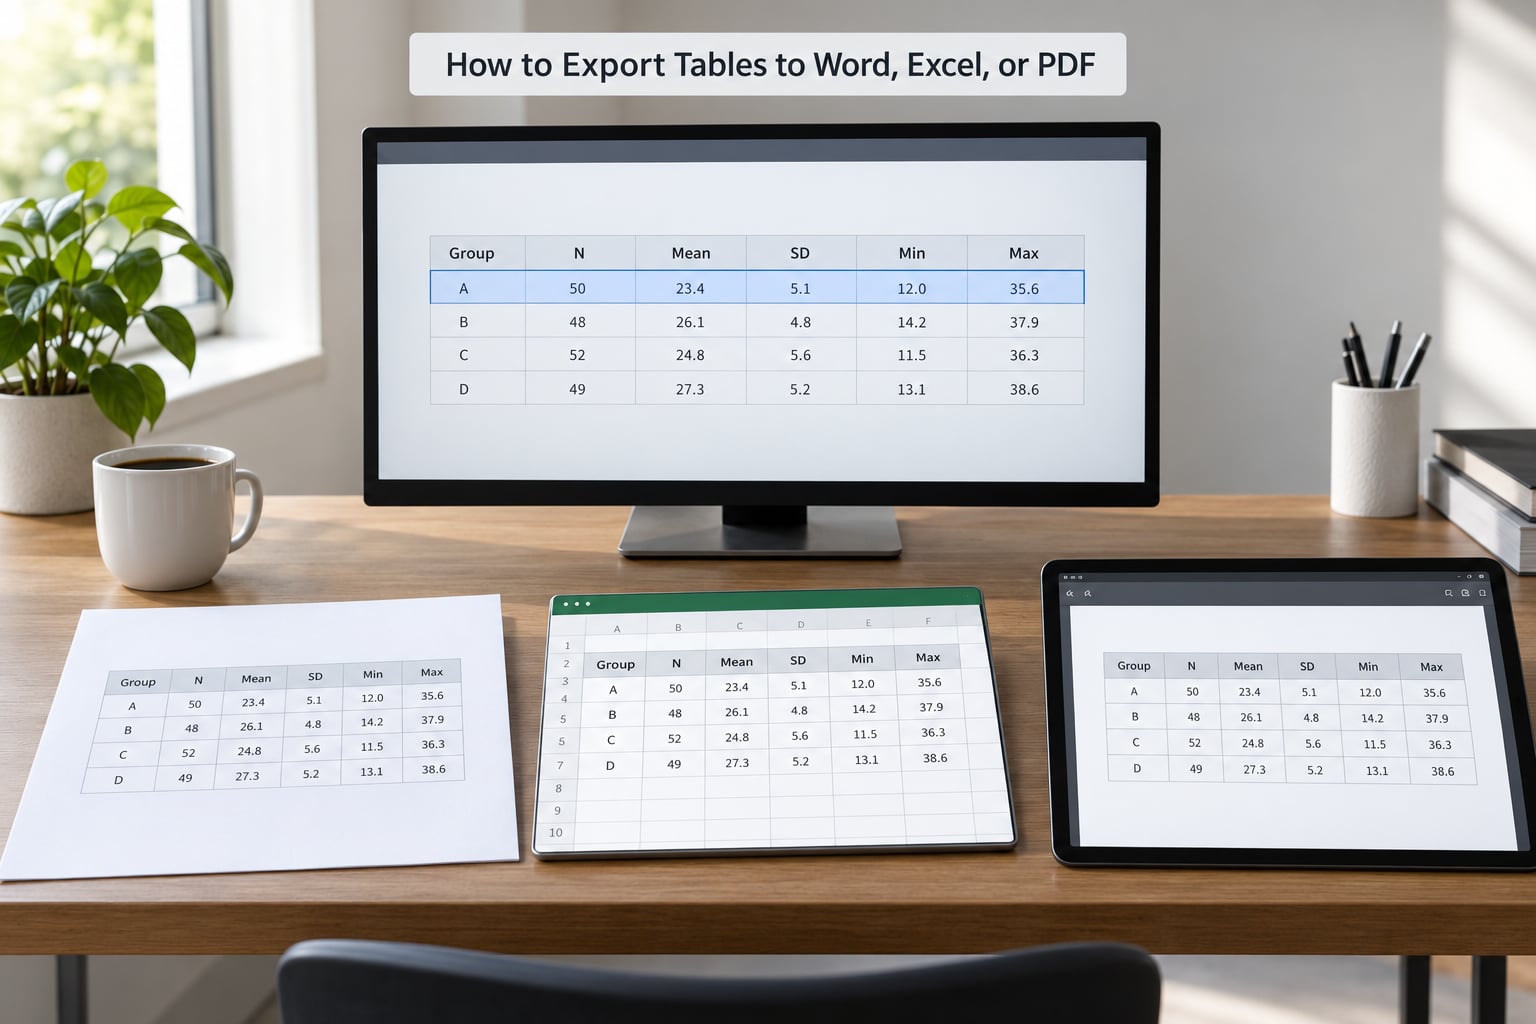
Click the table in the Output Viewer, then use File and Export. Choosing Export when nothing is selected sends the entire document out — a classic way to end up with a 60-page Word file when you wanted one table.
The format dropdown decides what you get, and the options are not interchangeable:
- Word (.docx) — best for thesis and report tables. It keeps most formatting and stays editable, though wide tables can overflow the page margins.
- Rich Text Format (.rtf) — the older, stubborn option. It survives pasting into Word more predictably than HTML when fonts get mangled.
- Excel (.xlsx) — best when the reader needs the numbers, not the styling. Cells land in a usable grid for pivoting.
- HTML — handy for web output or for pasting into a document that ignores RTF.
- PDF — the fixed-format choice for anything shared read-only, including journal submission.
Verify each export by opening it in the target program and checking three things: the column headings still line up, decimal places did not shift, and the numbers match the Viewer. Paste into Word and expect the table to land as an SPSS table object rather than plain text — right-click and choose Paste Special and Table if you want editable rows.
If Excel is missing from the format dropdown, you are probably on macOS. Several r/spss users hit exactly this; the workaround is to export to HTML and open that file in Excel, or to use the OMS syntax in the next section with an explicit XLSX format.
How to Create a Reusable SPSS Table Template
A template in SPSS means a saved table style, and it covers appearance only. If you also reuse the same block of syntax for a standard descriptive or regression table, keep that in a syntax file next to the .stt file.
The practical workflow for a repeatable report:
- Produce one table that looks exactly right, including decimal places and the columns you want shown.
- Save the appearance as a .stt file (Table Look, then Save).
- Copy the working syntax for that procedure into a library file, for example
crosstabs_standard.sps. - For the next project, load the style, paste the syntax, swap the data file path, and run.
Know when the template does not carry over. Column suppression, decimal formatting, and some pivot table settings are part of the procedure’s own subcommand options rather than the style, so keep those arguments in the syntax file too. Fonts and borders travel in the .stt; missing-value and significance-column settings usually do not.
If a journal demands a specific table format, build the table to their spec once, save the style, and reuse it. Doing it per paper is exactly the repetitive work this setup removes.
How to Automate Table Exports with SPSS Syntax
OMS — the Output Management System — routes output to a file in a format you name. Paste this tested pattern into a syntax window and adjust the paths:
OMS
  /SELECT ALL TABLES
  /DESTINATION FORMAT=XLSX OUTFILE='C:projectoutputall_tables.xlsx'.
OMS
  /SELECT TABLES TYPE='Frequencies'
  /DESTINATION FORMAT=DOC OUTFILE='C:projectoutputfreq_tables.doc'.
OMS
  /SELECT ALL TABLES
  /DESTINATION FORMAT=PDF OUTFILE='C:projectoutputfull_report.pdf'.
OMSEND.
Run your analysis commands between the OMS blocks, then close with OMSEND. Output collected while OMS is active goes to the files instead of only the Viewer.
Be careful with identifiers. /SELECT ALL TABLES captures every table, which on a long survey produces a spreadsheet nobody can navigate. /SELECT TABLES TYPE='...' narrows it to one procedure’s output, and pairing TYPE= with LABEL= or /EXCEPTIF gets you closer to a publication-ready file.
Two warnings from experience. File names written by OMS are not always obvious — check the destination folder after the run and confirm what actually landed there. And because the files are overwritten on every run, never point OMS at a folder holding the only copy of a report you still need.
Windows paths with single backslashes work, though doubling them is harmless. If your destination folder does not exist, the run fails with a syntax error rather than creating the directory.
How to Organize Saved Tables for Future Reports
A folder system takes five minutes and removes most of the searching later. Set up one folder per project with this structure:
- 01_data — the .sav file and any import logs.
- 02_syntax — .sps files, including your standard procedure templates.
- 03_output — the .spv files, with dated versions.
- 04_tables — exported Word, Excel, and PDF tables, plus any .stt style files.
- 05_report — the document you are writing.
Naming conventions matter more than folder depth. Put the project code first and the version last: pilot02_frequencies_v3.docx. Sorting by name then gives you a usable history without opening anything.
For the backup routine, copy the project folder to cloud storage or an external drive at the end of each working session, and keep a running text file of what changed. SPSS does not keep history for you, and a .spv overwritten with a partial run is gone.
Common Mistakes
Saving the wrong object. The SAVE command in syntax saves a .sav data file. Output gets saved from the Output Viewer’s File menu, or routed with OMS. If you see a .sav file after running a procedure, you saved data, not output.
Exporting the entire output by accident. With no table selected, File and Export writes the whole document. Click the specific table in the navigation pane first, then check the exported page count before you assume it worked.
Expecting a style change to update existing tables. This one comes up constantly on r/spss. Table Look and Table Properties apply to tables generated afterwards. Rerun the procedure, or edit each existing table by hand and accept that the change stays local.
Losing formatting on the way to Word. A pasted table sometimes arrives in a different font, with the borders gone, or as an embedded object that will not resize. Fix it at the source: export as .docx rather than pasting from the Viewer, and use Paste Special and Table when you must copy.
No Excel option in the export dialog on Mac. Known and reported on r/spss. Export to HTML and open it in Excel, or skip the dialog entirely with OMS and FORMAT=XLSX.
Filenames nobody can decode. output1.sps, table_final_FINAL2.docx. Name files by project, content, and version. It costs nothing now and saves a lot of guessing later.
Relying on manual copying across projects. Copy-and-paste works for a one-off, but the formatting and the numbers drift apart over time. A .stt style plus a syntax file reproduces the same table exactly, every run.
Never checking the values against the Viewer. Export bugs are rare but real. Before a table goes into a submitted report, compare one row against the Output Viewer. It takes ten seconds.
Forgetting the journal file. If you close SPSS without saving and want to recover what you ran, the journal file records your commands. Its location is under Edit, Options, Files, as r/spss users point out. It recovers syntax, not output.
Frequently Asked Questions
Can I reopen SPSS output tables without rerunning the analysis?
Yes. Saving the Output Viewer file as .spv keeps every table, chart, and note exactly as it appeared, and the file reopens without touching the data. This works on the desktop edition and on the free SPSS Statistics Viewer, so a colleague can read your results without a licence. You can only run new analyses with a full desktop licence, though.
How do I edit a statistical value in a saved SPSS output table?
You can edit the text of a title, note, or cell label by double-clicking it in the Output Viewer, but the underlying numbers are not editable. Any change to a statistic has to come from rerunning the procedure with different arguments or data. Treat exported tables as read-only for reporting purposes, and change the analysis rather than the output.
Why does my copied SPSS table lose its formatting in Word?
Copying straight from the Output Viewer pastes an embedded object that Word renders with its own rules, which is where the font and border problems come from. Export the table as .docx from File and Export instead, or use Paste Special and Table when copying. RTF is the more predictable option when fonts keep getting mangled between the two.
Can I copy an output table from one SPSS project to another?
You can, but the copied table carries its original formatting and does not pick up the new project’s style. For one table it is fine. For repeated work, save the appearance as a .stt Table Look file, load it in the new project before running, and keep the procedure’s syntax in a separate file. That reproduces the table exactly instead of approximating it.
How can I automatically export several SPSS output tables?
Use OMS. Wrap your analysis commands in OMS blocks that specify what to select and where to send it, for example /SELECT TABLES TYPE=’Frequencies’ with /DESTINATION FORMAT=DOC OUTFILE=’…’. Close with OMSEND. Run it once by hand and check the destination folder, because OMS overwrites files on every run and the generated names are not always obvious.
Conclusion
Start by saving the complete .spv file — that single step is what lets you reopen and reuse SPSS output tables without rerunning anything. From there, export the specific tables your report needs as .docx or PDF, save your table appearance as a .stt file so future tables match, and add OMS only once the manual workflow already works.