
How to choose the right statistical test for your research question is a matter of working backwards: name the comparison you want to make, check what your variables actually are, count your groups, work out whether the observations are paired, then test the assumptions. The test follows the question, never the other way round.
That is the whole idea. Most people get stuck because they start with a list of test names and try to match one to their topic. It goes much better when you start with the sentence you want to write in your methods chapter, because the sentence already tells you what kind of evidence you need.
Say your question is “does weekly supervised exercise reduce blood pressure readings in newly enrolled adults?” You already know three things without opening any textbook. There are two conditions. Each person is measured more than once, or at least before and after. The outcome is a number with units. Those three facts narrow the field to a very short list.
This guide walks through that narrowing process in order, then gives you a selection table, a parametric and nonparametric pairing, and the mistakes that most often send people to the wrong test.
Table of Contents
- 1How to Choose the Right Statistical Test for Your Research Question
- 2How to choose the right statistical test for your research question: a four-step filter
- 3What kind of question is your study trying to answer?
- 4What are the types of variables and groups in your data?
- 5Independent vs paired vs repeated measures: how to tell from your design
- 6Which statistical test should you use for common research designs?
- 7How do the assumptions affect your choice of test?
- 8How do you choose between parametric and nonparametric tests?
- 9How do you choose a test for surveys, experiments, and observational studies?
- 10How should you check and document your test choice?
- 11What mistakes cause people to choose the wrong statistical test?
- 12Frequently Asked Questions
- 13Should I use an ANOVA or a t-test?
- 14How do I know whether my data are paired or independent?
- 15What should I do if my data are not normally distributed?
- 16When do I use 0.05 instead of 0.01 as the significance level?
- 17What is the rule of 3 in statistics?
- 18Can I change my statistical test after seeing the data?
- 19Conclusion
How to Choose the Right Statistical Test for Your Research Question
The reliable method is a four-step filter applied in a fixed order. Fix the outcome variable, classify the predictors, count groups and their independence, then name the analysis goal. Most misclassification errors happen because people reverse the order and check normality before they know whether their data are paired.
How to choose the right statistical test for your research question: a four-step filter
Step 1 — Classify the outcome. Is it a measurement with units, a category, a rank, or a count? The label determines the family of tests available to you, and no amount of sample size or significance level changes that.
Step 2 — Classify the predictors. Each explanatory variable is either categorical with two or more levels, or numerical. A predictor with fifteen numeric values is not fifteen groups, which is a distinction beginners routinely miss.
Step 3 — Count the groups and decide whether they are independent. Two groups need different tests from four groups, and two independent groups need a different test again from the same two people measured twice.
Step 4 — Name the goal. Are you comparing, associating, predicting, or classifying? A difference question and an association question can use similar data and still need different tests.
Write those four answers on one line before you open any software. Forum users on AskStatistics and Cross Validated describe the same instinct: the test is a consequence of the hypothesis, not a place to start.
What kind of question is your study trying to answer?
Five question types cover most research, and each points to a different family of analysis. Sorting your question into one of them first saves hours of dithering later.
Descriptive. “What is the distribution of waiting times in this clinic?” Nothing needs testing. Report summaries, spread, and a plot, and be honest that no p-value belongs in the paper.
Comparison. “Do the mean satisfaction scores differ between the training and control group?” Two or more groups, one continuous or ordinal outcome, a difference is what you want to claim.
Relationship. “Is household income associated with academic performance?” Both variables are measured, and you want to know whether they move together rather than whether one group outscores another.
Prediction. “Can prior grades predict graduation within four years?” One outcome, several predictors, and the real deliverable is an equation that holds up on data it has not seen.
Classification. “Can we distinguish patients who will respond to treatment from those who will not?” The output is a predicted group, and the evaluation is about accuracy rather than a significance test.
Notice that comparison and relationship can look identical on a spreadsheet and still need different tools. A scatterplot of two variables invites correlation. Two coloured clusters of the same variable invite a group comparison.
What are the types of variables and groups in your data?
Measurement level is the first filter because it rules tests out immediately. A nominal variable has names only, like blood group or course department. An ordinal variable has a real order but uneven gaps, like a five-point satisfaction item. A continuous variable has equal intervals, and a ratio variable has a true zero as well.
In practice, interval and ratio variables are handled identically for inference, so most guides merge them into one continuous category. Ordinal is the awkward one: a five-point scale is not the same thing as five distinct numeric values, though treating it as continuous is a common and sometimes defensible shortcut.
Independent vs paired vs repeated measures: how to tell from your design
The pairing question is the single most frequent misclassification, so decide it from the design rather than from the shape of your data.
Independent samples mean the two groups contain different people. A randomised trial with one treatment arm and one control arm is independent. Two schools, each measured once, is independent.
Paired samples mean two values come from the same unit. Before and after weights on the same patient are paired. Pre-test and post-test scores in the same class are paired. The pairing does not have to be a time point; matched pairs by age or sex also count.
Repeated measures means the same units are observed more than twice, usually across several conditions or several time points. Three visits from the same forty participants is repeated measures, and a paired test cannot handle it.
The tell is a question you can ask about any row of the data: can I match this person’s value in column A to their value in column B? If yes, your samples are related and the independent-samples tests are wrong.
Group structure then finishes the picture. Two independent groups plus a continuous outcome gives you a t-test. Three or more independent groups plus the same outcome gives you an ANOVA. Two categorical variables give you a chi-square test of independence. One numerical predictor and one numerical outcome give you regression or correlation.
Which statistical test should you use for common research designs?
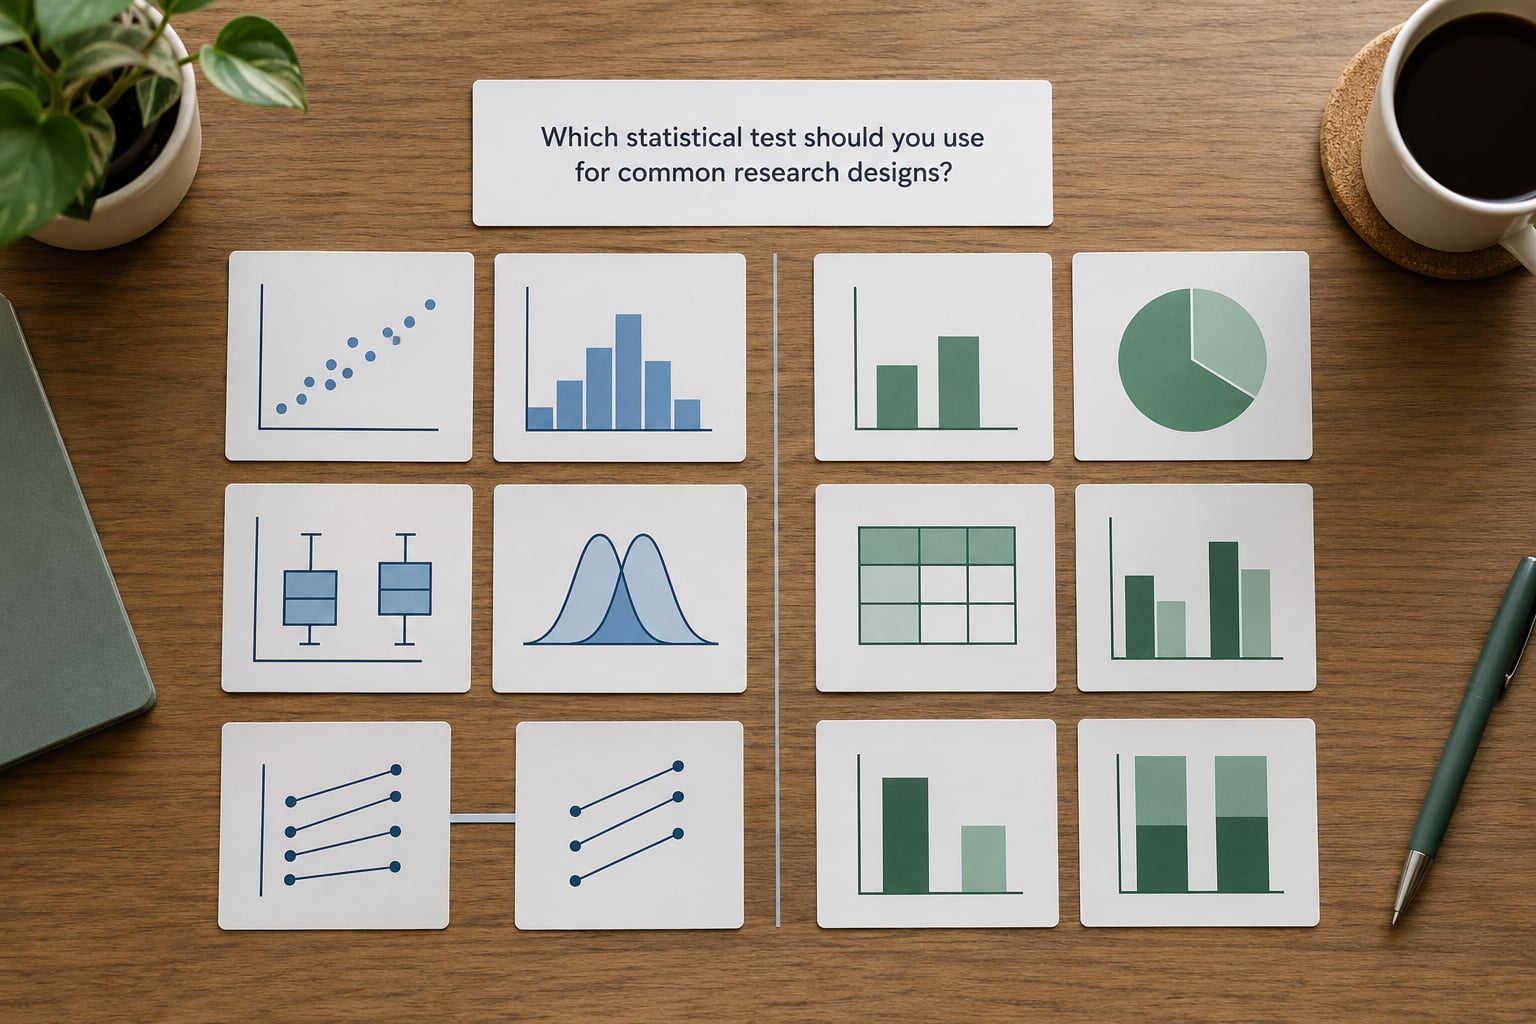
The table below is the shortcut version of the four-step filter. Find your row by outcome type and group structure, and read across to the design column that matches what you actually did.
| Outcome and structure | Two independent groups | Two paired measurements | Three or more groups | Key assumption to check |
|---|---|---|---|---|
| Continuous outcome | Independent-samples t-test | Paired-samples t-test | One-way ANOVA | Normality of residuals, equal variances |
| Continuous outcome, repeated measures | Not applicable | Paired t-test (two time points) | Repeated-measures ANOVA or mixed-effects model | Sphericity, normality of differences |
| Continuous outcome, assumptions doubtful | Mann-Whitney U | Wilcoxon signed-rank | Kruskal-Wallis; Friedman for repeated | Similar distribution shape |
| Ordinal or ranked outcome | Mann-Whitney U | Wilcoxon signed-rank | Kruskal-Wallis | Independent observations |
| Two categorical variables | Chi-square test of independence | McNemar’s test | Chi-square test of independence | Expected cell counts of 5 or more |
| One numerical, one categorical | Point-biserial or Spearman | Spearman if related | Correlation plus dummy-coded regression | Linearity or monotonicity |
| Two numerical variables | Pearson r | Spearman rho | Multiple regression | Linearity, no serious multicollinearity |
| Numerical outcome, categorical outcome prediction | Linear regression for a numeric outcome; logistic regression for a binary outcome; multinomial or ordinal logistic for more than two categories | Independent observations, adequate events per parameter | ||
| Agreement between two measurement methods | Bland-Altman plot and limits of agreement | Neither method assumed correct | ||
Read the last column before you commit. Each test carries one assumption that, if badly violated, produces a p-value you should not trust.
For software, the same family sits in predictable places. In SPSS, Compare Means holds the t-tests and one-way ANOVA, Nonparametric Tests holds Mann-Whitney, Wilcoxon, Kruskal-Wallis and Friedman, and Crosstabs holds chi-square and McNemar. In R, these live in t.test, aov, wilcox.test and kruskal.test, with chisq.test for the categorical cases. In Stata, tabstat and regress cover much of the same ground, with ranksum and kwallis for the nonparametric alternatives.
How do the assumptions affect your choice of test?
Assumptions are not a pass-or-fail gate. They are conditions under which the test’s p-value behaves as printed, and the remedy depends on how badly the condition is broken.
Normality. Parametric tests assume the outcome within each group is roughly normal, or that the sample is large enough for the sampling distribution of the mean to be. Check with a histogram plus a Q-Q plot, and use Shapiro-Wilk for a formal test on smaller samples. Watch skewness and kurtosis rather than the p-value alone.
Homogeneity of variance. Levene’s test, or its Brown-Forsythe variant that down-weights the most extreme deviations, checks whether group spreads are comparable. Failing it in a t-test points to Welch’s correction; failing it in ANOVA points to Welch’s one-way ANOVA, which is now the default recommendation in many journals.
Independence. Each observation should be one case and one case should not influence another. Clustered data, repeated visits and matched sampling all break this, and no assumption test detects it.
Linearity. Regression and Pearson correlation assume a straight-line relationship. A curved scatterplot calls for a transformation, a polynomial term, or Spearman’s rho if the pattern is monotonic but not linear.
Measurement level. Treating an ordinal item as continuous without justification is an assumption failure even when the normality plot looks fine.
Expected cell counts. Chi-square relies on expected counts of about five or more per cell. Smaller tables call for Fisher’s exact test, which is exact rather than approximate.
Severity decides the response. A mild normality wobble with a large sample is usually fine. Severe skew in a small sample is not, and the honest options are a nonparametric substitute, a distribution-free method such as a permutation test, or a transformation such as a log or square root.
How do you choose between parametric and nonparametric tests?
Parametric tests are not automatically the sophisticated choice, and nonparametric tests are not a patch that rescues any dataset. The real distinction is what each test assumes about the distribution, and what each one buys you in return.
Parametric tests model the distribution and estimate parameters such as means. They use the full precision of each observation, so they are usually more powerful when their assumptions hold, and they support a richer set of follow-up comparisons. Their weakness is that a violated assumption can distort the p-value in a direction you cannot see from the output.
Nonparametric tests work with ranks or category counts and assume less about shape. They are the right call for ordinal ratings, strongly skewed continuous data, or small samples where the normality check has little power to detect anything. They cost you something in precision, and some have no clean effect-size measure that matches the parametric equivalent.
A useful middle path: the permutation test. It resamples under the null hypothesis and needs almost no distributional assumptions while still producing a proper p-value for the difference you care about. If a reviewer objects to the normality of your data, a permutation or bootstrap version of your test is often the cleanest reply.
How do you choose a test for surveys, experiments, and observational studies?
The design, not the test, sets the limits of what you are allowed to claim. A well-chosen test on a flawed design still produces a number you cannot defend.
Survey comparisons. Categorical responses such as yes or no or a preference list go to chi-square or Fisher’s exact. Multi-item scales need a reliability check first, usually Cronbach’s alpha, before you treat them as one variable; an alpha below roughly 0.70 suggests the items are not measuring a single thing.
Experiments. Two arms with one outcome give you a t-test on the change, or an ANCOVA comparing post-test scores with the baseline as a covariate, which usually has more power. Three or more arms give one-way ANOVA followed by corrected post-hoc comparisons such as Tukey or Games-Howell.
Before-and-after without a control group. A paired test compares your participants to themselves, and it cannot separate the treatment from maturation, regression to the mean, or practice effects. Say so in the limitations.
Observational association. Cross-sectional data supports claims about association, never causation, no matter how large the correlation. If you want prediction rather than description, use regression with a clear statement of what is being predicted and what is held constant.
Clustered or nested data. Students sit inside classrooms, patients inside clinics, repeated visits inside people. Treating those rows as independent inflates the effective sample size and makes small p-values easy. A mixed-effects model or cluster-robust standard errors handles it, and no standard classroom decision tree will steer you there.
How should you check and document your test choice?
Before you report anything, run through this in order. It takes about ten minutes and it is the difference between a defensible methods section and a rejection comment from an examiner.
- Inspect the raw data for missing values, impossible entries and outliers, and decide how each will be handled before you run the test.
- Confirm how each variable is coded. Check that reference categories and dummy variables are what you think they are.
- Run the assumption checks that apply: Shapiro-Wilk or a Q-Q plot for normality, Levene’s or Brown-Forsythe for variances, VIF for multicollinearity, expected cell counts for chi-square.
- Report an effect size alongside the test. Cohen’s d for a t-test, eta-squared or partial eta-squared for ANOVA, Cramer’s V for chi-square, and a correlation coefficient for association. With small samples, prefer the confidence interval over the point estimate.
- Check whether a sensitivity analysis changes anything: a Welch’s or permutation version, a transformation, or a different outlier rule. If the conclusion flips, that is a finding you need to report.
- Write the justification in one sentence. Something like “an independent-samples t-test was selected because the outcome was continuous, there were two independent groups, and homogeneity of variance was not violated (Levene’s p = .62)” tells a reader everything.
What mistakes cause people to choose the wrong statistical test?
Choosing from the desired result. Running several tests and reporting the one that reaches significance is test shopping. It is the fastest route to a result a reviewer will reject. Decide the test first and report what it gives you, including the null.
Ignoring repeated observations. Measuring the same people twice and treating them as two groups is the most common structural error. It inflates your sample and destroys the pairing that carries most of the signal.
Treating ordinal ratings as continuous. A five-point satisfaction item has five ordered categories, not a continuous scale. Either justify the treatment, combine items into a score with demonstrated reliability, or use a rank-based test.
Running many tests without correction. Ten comparisons at a 0.05 threshold produce a false positive about 40% of the time. Fix the family of comparisons in advance and use a correction such as Bonferroni, Holm, or FDR.
Confusing significance with importance. With a large enough sample, a trivial difference becomes significant. Report the effect size and the confidence interval so readers can judge practical magnitude.
Switching tests after seeing the data. Changing from a t-test to Mann-Whitney once normality looks bad, without a stated reason, is a form of selective reporting. Collect the data first, fix the analysis, and if the assumptions fail then, report both the substitution and the reason for it.
Frequently Asked Questions
Should I use an ANOVA or a t-test?
Both test the same kind of thing, and the difference is the number of independent groups. With exactly two groups, a t-test is the correct and simpler choice, and an ANOVA on the same data returns the same result. Reach for ANOVA when you have three or more groups, when you have two or more predictors that cross, or when you need omnibus post-hoc comparisons. Report the test you actually ran rather than the one you were told to run.
How do I know whether my data are paired or independent?
Ask whether each value in one condition can be matched to a specific value in the other. Same people measured before and after, twins, matched pairs on age or sex: paired. Different people in each condition, a treatment and a control arm: independent. Same people measured across three or more time points is neither, it is repeated measures, and it needs a repeated-measures ANOVA or a mixed-effects model.
What should I do if my data are not normally distributed?
Look at the histogram and a Q-Q plot first, and judge how far the departure is. With a large sample, mild skew rarely matters. With a small sample and strong skew, use the rank-based counterpart such as Mann-Whitney or Wilcoxon, or run a permutation or bootstrap version of your test. Transforming the outcome with a log or square root is another option and keeps a parametric framework.
When do I use 0.05 instead of 0.01 as the significance level?
Use 0.05 as the conventional default unless you have a specific reason not to. Tighten it to 0.01 when many comparisons are being made, when the field demands it, or when you want strong protection against false positives in a confirmatory study. Loosening it increases the chance of a false positive. Whatever you pick, fix the threshold in your proposal and treat a change made after seeing the p-value as a reporting problem.
What is the rule of 3 in statistics?
When no events are observed in a sample of n, the upper 95% confidence bound for the event rate is roughly three divided by n. It is the shortcut behind the zero-failure rule of thumb for reliability work, where you can only say that a failure rate is below 3 out of n at 95% confidence. It also expresses how little a small sample can tell you: zero events out of ten is very weak evidence of a low rate.
Can I change my statistical test after seeing the data?
You can, but you have to be transparent and the reason must be about data structure rather than the size of the p-value. Discovering a genuine design problem after collection, such as missing baseline measures or confounded groups, usually means the planned analysis no longer answers the question and you should revise the study design, not patch the test. Document the change, the reason, and report the original plan alongside the substitution.
Conclusion
Write your research question as a precise sentence, then list the variables, their measurement levels, the number of groups, and whether the observations are paired. Those four lines identify the test before any software is involved.
Pick the simplest test that answers that sentence, check the assumptions it actually depends on, and report the effect size and confidence interval next to the p-value. If you are choosing a parametric or nonparametric route on a small or skewed dataset, or handling clustered observations, a methods consultant is worth a conversation before the analysis rather than after.