
To reshape data from wide to long format, you stack the measurement columns on top of each other so each observation gets its own row, move the old column names into a key column, and drop the scores into a single value column. What stays put are the identifier columns: participant ID, site, group, country. In R this is one call to pivot_longer(); in SPSS it is a single pass through the Restructure wizard. Both take under a minute once you know which columns are keys and which are values.
The confusion is rarely the command. It is deciding what to stack. Work through the sections below in order and the format question answers itself.
Table of Contents
- 1What You Need
- 2Step-by-Step: How to Reshape Data From Wide to Long Format
- 3How to Reshape Data From Wide to Long Format in R
- 4Reshaping Several Measurement Columns in R
- 5How to Reshape Data From Wide to Long Format in SPSS
- 6Handling Repeated Values, Labels, and Missing Scores
- 7Checking the Reshaped Data Before Analysis
- 8Common Mistakes
- 9Frequently Asked Questions
- 10How many rows should wide-to-long data have?
- 11Can I reshape several pretest and posttest variables together?
- 12Should participant IDs stay in their own column?
- 13What happens to value labels when data are reshaped?
- 14Should I reshape data in Excel, R, or SPSS?
- 15Conclusion
What You Need
A dataset is in wide format when every variable has its own column and one row describes one unit. A dataset is in long format when every observation occupies its own row, with one key column naming the variable and one value column holding the measurement. Long format is often called tidy data, and it is the shape most modern tools expect.
The same scores shown both ways look like this. Wide, three rows and three measurement columns:
| ID | pre_read | post_read | followup_read |
|---|---|---|---|
| 101 | 54 | 61 | 63 |
| 102 | 49 | 58 | 57 |
| 103 | 60 | 66 | 64 |
Stacked to long format, those three rows become nine, with one key column and one value column:
| ID | measure | score |
|---|---|---|
| 101 | pre_read | 54 |
| 101 | post_read | 61 |
| 101 | followup_read | 63 |
| 102 | pre_read | 49 |
| 102 | post_read | 58 |
| 102 | followup_read | 57 |
| 103 | pre_read | 60 |
| 103 | post_read | 66 |
| 103 | followup_read | 64 |
Three questions sort any table into keys and values before you touch a menu:
- What identifies one row right now? ID, site, group, wave, country. These stay as fixed columns.
- Which columns hold the measured numbers? Anything that varies within a row across time, occasion, instrument or item is a value to stack.
- Do the measurement columns share a naming pattern? A consistent prefix is what lets you select them by pattern instead of one by one.
For software, install the current R release with RStudio, plus tidyr (part of the tidyverse). pivot_longer() arrived in tidyr 1.0 and replaced the older gather(), so anything you find teaching gather() is out of date. Tidyverse packages move fast, so work from the current release in 2026 rather than from an old tutorial. For SPSS, IBM SPSS Statistics 28 or newer has the Restructure wizard under the Data menu; version 26 and earlier use a slightly different dialog sequence.
One more habit: keep the original wide file untouched. Reshaping back is usually possible, but not always in the order you want, and a copy costs nothing.
Step-by-Step: How to Reshape Data From Wide to Long Format
The workflow is the same in every tool. Decide the keys, decide the values, run the reshape, then check that nothing was lost. Below, the running example is the reading-score table above, and every step shows what the output should look like.
How to Reshape Data From Wide to Long Format in R
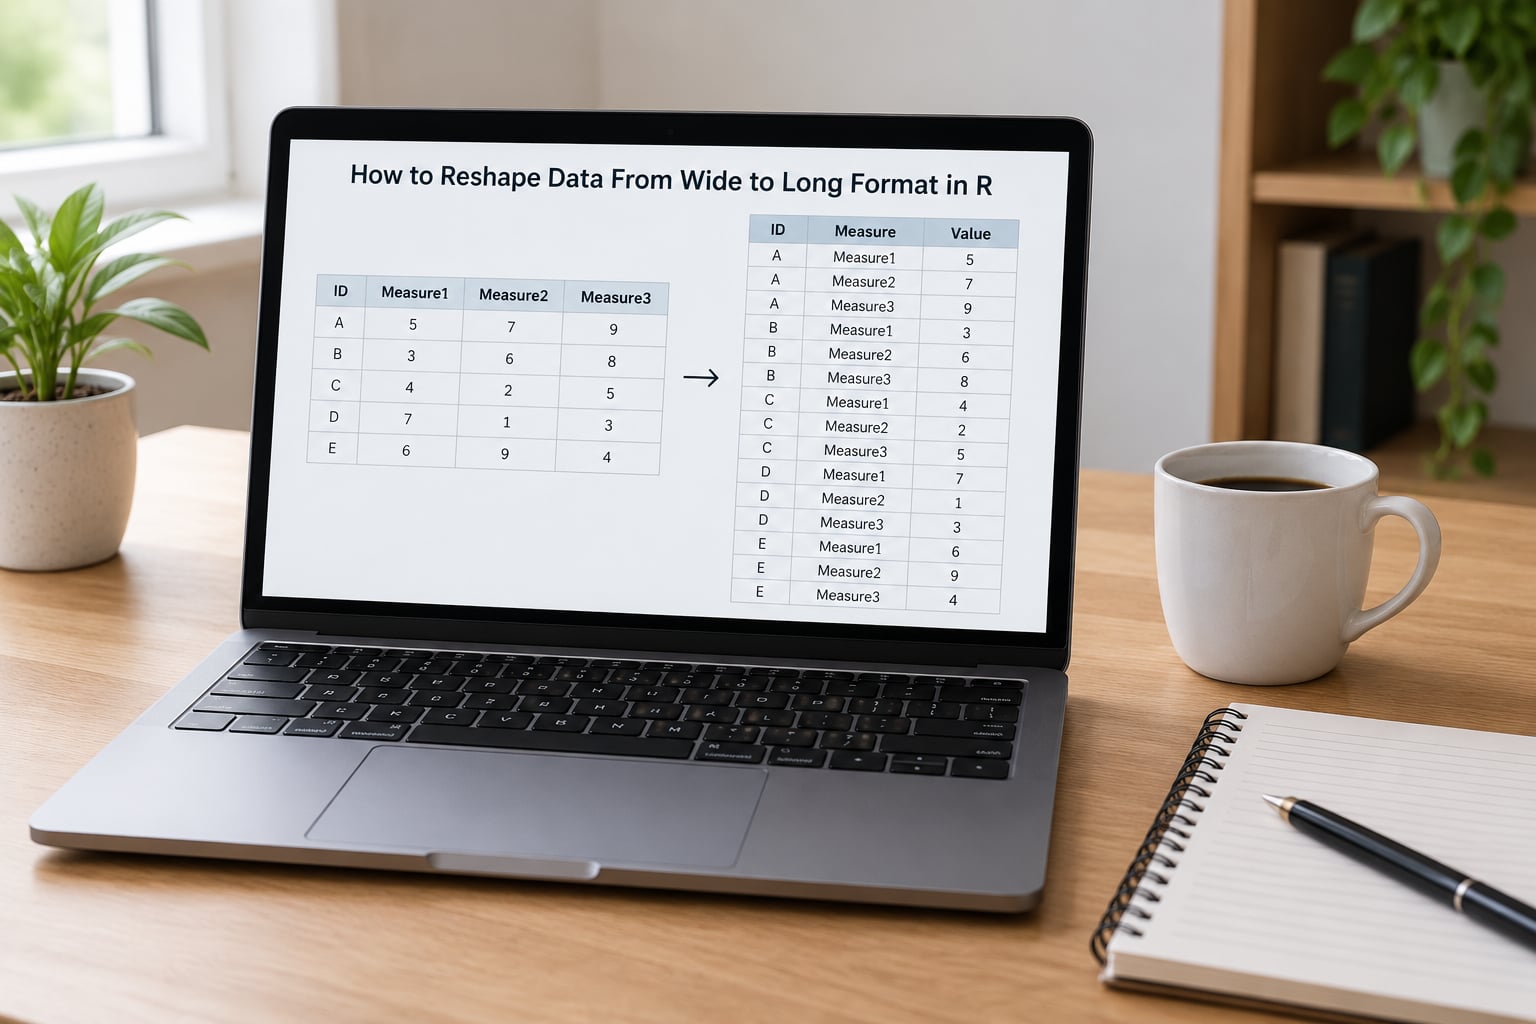
Start by writing the exact column names into the call. Explicit selection catches mistakes early, and it reads better six months from now than a clever regex.
library(tidyr)

long <- scores |>
  pivot_longer(
    cols      = c(pre_read, post_read, followup_read),
    names_to  = "measure",
    values_to = "score"
  )
names_to names the new key column, values_to names the new value column. Anything you did not list in cols is copied down to every new row, so ID repeats three times per participant.
Two checks, and only two:
nrow(scores)   # 3
ncol(scores)   # 4
nrow(long)     # 9
ncol(long)     # 3
distinct(long$ID) |> nrow()  # 3
Three wide rows times three stacked columns gives nine long rows. If you get 12, you stacked an identifier column by accident.
Going the other way takes one line:
back <- long |>
  pivot_wider(names_from = "measure", values_from = "score")
Base R has its own function if you do not want the tidyverse. It is older and the argument names trip people up, but it is still common in older scripts:
base_long <- reshape(scores, direction = "long",
                       varying = c("pre_read", "post_read", "followup_read"),
                       v.names = "score", idvar = "ID", timevar = "measure")
Reshaping Several Measurement Columns in R
Real datasets rarely have three tidy columns. They have blocks that follow a pattern, like four reading and four maths scores per pupil.
long <- scores |>
  pivot_longer(
    cols      = starts_with("read_"),
    names_to  = "measure",
    values_to = "score"
  )
starts_with() comes from dplyr, contains() and matches() come from tidyselect, and all of them can be combined with c(). To stack two blocks in one call, write cols = c(starts_with("read_"), starts_with("math_")). To stack everything that is not an identifier, use cols = -c(ID, group).
Now the interesting case: column names that carry two pieces of information, such as read_w1, read_w2, math_w1, math_w2. Stacking them with names_to = "measure" gives you keys like read_w1, which are hard to filter later. Split them into separate variables instead:
long <- scores |>
  pivot_longer(
    cols      = starts_with(c("read_", "math_")),
    names_to  = c("instrument", "wave"),
    names_sep = "_",
    values_to = "score"
  )
names_sep is a fixed separator. When the separator position moves between columns, use names_pattern with regular expressions, which also needs one capture group per new variable:
long <- scores |>
  pivot_longer(
    cols      = starts_with("score_"),
    names_to  = c("measure", "occasion"),
    names_pattern = "(.*)_([0-9]+)",
    values_to = "value"
  )
Then convert the index to a number if you need arithmetic on it: mutate(occasion = as.numeric(occasion)). This handles the messy headers people hit in the wild, like avgtemp.1994 or an irregular CC_7.
How to Reshape Data From Wide to Long Format in SPSS
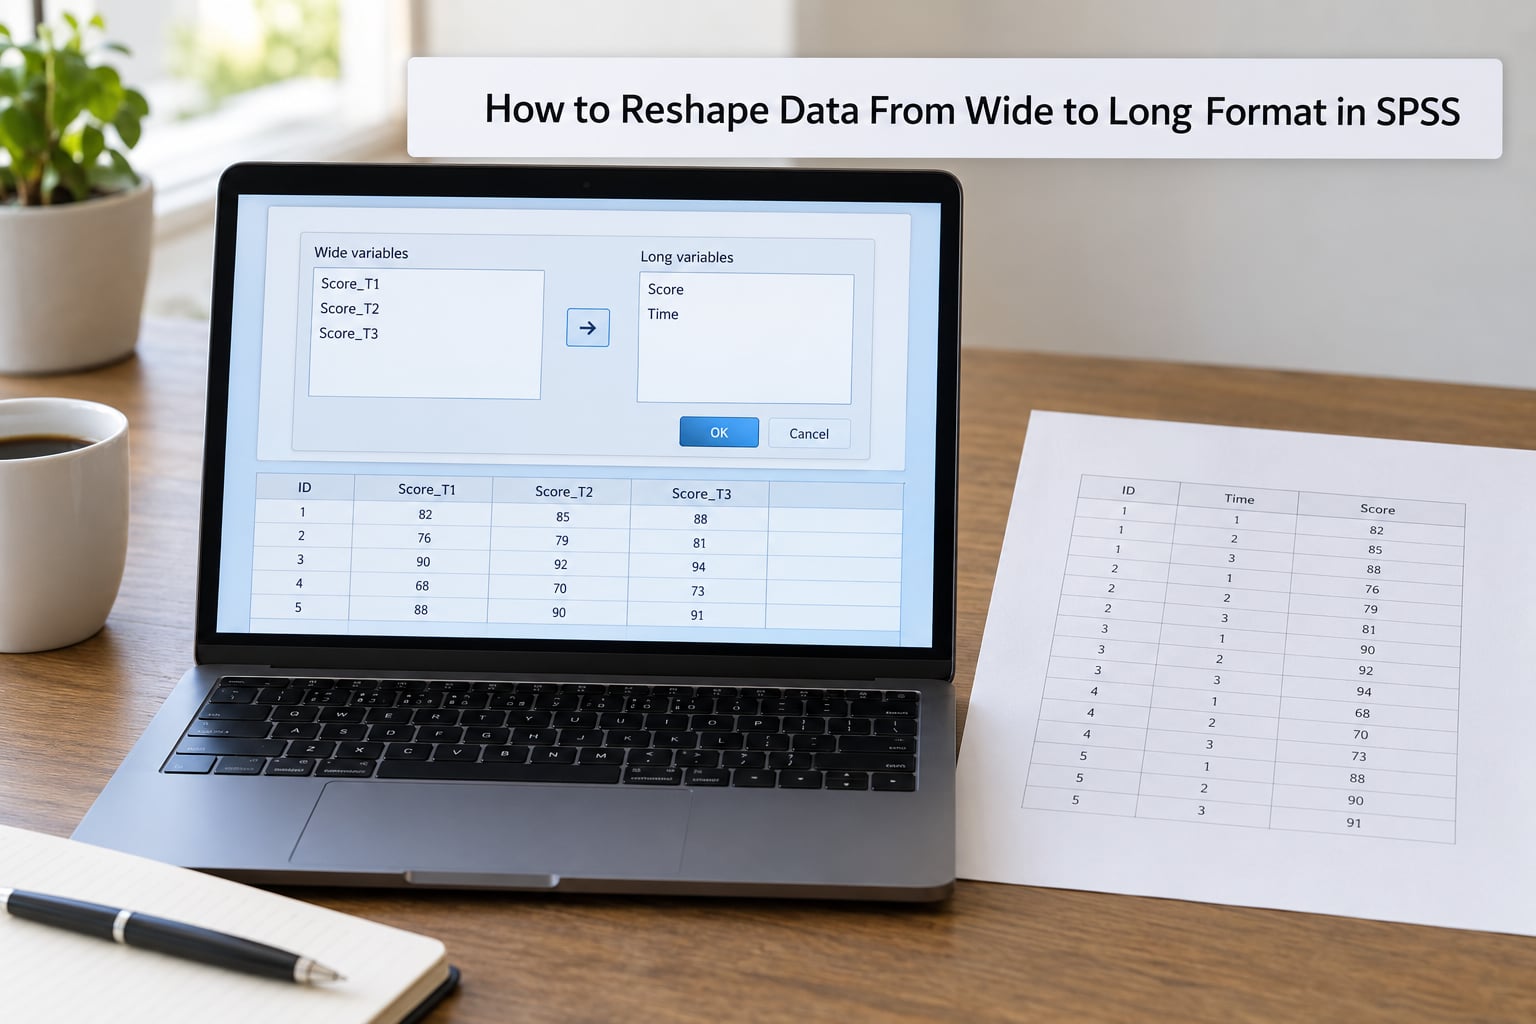
In IBM SPSS Statistics 28 or newer, the same conversion runs through Data > Restructure. Choose Restructure cases into different variables, which takes you to the wizard in four screens.
- Data Source. Confirm the file and variable count. SPSS reads this screen, not your intentions.
- Variable Grouping and Labels. Move
pre_read,post_readandfollowup_readfrom the unselected list into the Variable Grouping and Labels area. In SPSS these selected variables are the stubs, the columns you intend to stack. - Destination Variables. Give the new key column a name such as
measureand the new value column a name such asscore. Click Other to set the index value for the first column, usually 1, 2, 3. - Options. Choose how missing values are treated: discard rows where every score is missing, or keep the empty row. This is where students silently lose or invent cases, so set it deliberately.
Participants are handled through the Case Grouping Variable list in the same wizard. Each one becomes a row label repeated across their new rows.
The syntax version is worth keeping, because it repeats in journals and gives you the same result in one command:
RESTRUCTURE format=case groupby=ID
  /data=list pre_read post_read followup_read
  /variables=measure score
  /missings=discard.
Verify the result in the Data View grid: nine rows, three columns, ID intact, score numeric. Then check the column mode in Variable View, since a numeric column that SPSS imported as string will not analyse as a measurement.
Handling Repeated Values, Labels, and Missing Scores
A column of value labels such as 1 = male, 2 = female is not a measurement. Stack it and your value column turns into text, and every numeric summary downstream fails. Keep label columns as keys, or turn them into factors before reshaping.
Labels set on the measurement columns need reattaching after the reshape, since a new variable carries none of the old label sets. In SPSS that means Variable View > Labels > Value Labels for score; in R it means assigning levels to the measure key.
Decide explicitly what missing means. Dropping all-empty rows with values_drop_na = TRUE in R, or /missings=discard in SPSS, shrinks the dataset to the observed cases only. Keeping them preserves the design but leaves gaps the model has to handle. The failure mode to watch is a column that started numeric becoming character because a single cell held a dash or a blank.
Checking the Reshaped Data Before Analysis
Run this list every time. It takes a minute and catches silent corruption that no error message reports.
- Row count. Wide rows times number of stacked columns should equal long rows, minus any dropped all-missing rows.
- Identifier uniqueness. Each ID should appear exactly as many times as you stacked columns. Anything else means rows were duplicated or lost.
- Value count. Sum or
n()the score column before and after. The totals should match. - Variable type.
class(long$score)should be numeric or integer, not character. - Missing count. Know how many
NAvalues appeared so you can report it. - Sample size. Confirm the number of distinct IDs equals your intended sample. Extra cases here usually mean an identifier column got stacked by mistake.
For a durable record, save the row-count and value-count results to the output window before the analysis output starts scrolling past.
Common Mistakes
Stacking identifier columns. The most common error by some distance. Selecting every column includes ID, and the reshape inflates rows by the wrong factor. The sample-size check above catches it.
Wrong number of variable groups in SPSS. Two groups means Stata-style two-way reshaping, not what most people want. One group of stubs is the wide-to-long case; put all measurement columns in it.
Losing value labels. Expected, since new variables start blank. Reassign labels to the value variable after the reshape rather than expecting them to travel.
Duplicate rows. Usually caused by stacking two blocks and letting names_to collapse, so two different measurements look identical. Split names with names_sep or names_pattern to keep them distinct.
Treating measurement types as time points. When the wide columns are things like type and size rather than repeated occasions, the standard reshape produces the wrong shape. In Stata the fix is a second reshape with the string option; in R, stack then re-split the key column. People on StataList have reported this layout consuming hours before they spotted the mismatch.
Reshaping data that is already long. If there is one score column and a key column, stop. Running a reshape on long data duplicates records without any warning.
Ignoring source column order. In SPSS the Variable Grouping list sets the order of the new key values, and the wizard builds the output in that order. Check the wizard preview before moving on if occasion order matters.
Frequently Asked Questions
How many rows should wide-to-long data have?
Multiply the rows in your wide file by the number of measurement columns you stacked. Twenty participants with pretest, posttest and follow-up scores become 60 long rows. If your count does not match, you either stacked an identifier column or dropped columns from the selection. Recount before running any analysis.
Can I reshape several pretest and posttest variables together?
Yes, stack them in a single call as long as every measurement column has one value per participant. In R, select them with c(starts_with(“pre_”), starts_with(“post_”)). In SPSS, put all of them into one variable group so they form a single set of stubs. Trouble starts when instruments have different numbers of administrations.
Should participant IDs stay in their own column?
Yes. ID columns are keys, not values, and they are repeated on every long row for that participant. Leave them out of the value selection in R, out of the stacked variable group in SPSS, and out of the columns you unpivot in Excel. Stacking an ID column is the most frequent reshape error.
What happens to value labels when data are reshaped?
A new variable carries none of the old label sets, so labels must be reassigned afterwards. A column that holds labels rather than numbers should never be stacked with measurements, because the value column turns into text and numeric summaries fail. In SPSS set labels in Variable View, and in R assign levels to the key column.
Should I reshape data in Excel, R, or SPSS?
Use Excel Power Query when the reshape is a one-off cleanup step and no statistics follow. Use R when you will reshape again, need to split compound column names, or plan to work with ggplot2 and mixed models. Use SPSS when your course or lab requires it and the data already live in a .sav file.
Conclusion
Start by looking at your table and deciding what one row describes. That unit of analysis tells you which columns are keys and which are values, and the reshape itself becomes mechanical. Protect the identifier columns, stack only the measurement variables, name your key and value columns something readable, and keep the original wide file. Then verify: row count, identifier uniqueness, value totals, variable type. Ten minutes of checking there saves an afternoon of wondering why the mixed model refuses to run in 2026.