
Secondary analysis of public survey data means downloading a dataset that somebody else already collected, then cleaning, weighting and analysing it to answer your own research question without fielding a survey yourself. The workflow runs from defining a question the data can actually answer, through documentation checks and recoding, to declaring the survey design and citing the exact version you used.
Survey data is primary for the organisation that gathered it and secondary for everyone who touches it afterwards. That relational answer is the one to keep in your head, because it decides what you owe the original investigators: you did not collect the data, so you must not present yourself as though you did.
Public datasets give you something a student project never could: a probability sample of thousands of people, dozens of measured variables, and often twenty or more years of repeated waves, all free and all documented to some degree. The cost is that you did not design the questionnaire, you cannot ask a follow-up question, and you inherit measurement choices you would never have made.
Here is how to use public survey datasets for secondary analysis in ten steps, with the technical parts — weighting, documentation and citation — treated as first-class work rather than an afterthought.
Table of Contents
- 1What You Need
- 2How to Use Public Survey Datasets for Secondary Analysis: Step-by-Step
- 3Step 1: Define a question the dataset can answer
- 4Step 2: Find a suitable public survey dataset
- 5Step 3: Inspect documentation before downloading or analyzing
- 6Step 4: Import the data and preserve the original files
- 7Step 5: Select variables and create an analysis file
- 8Step 6: Clean and validate the data
- 9Step 7: Account for the survey design
- 10Step 8: Choose and run appropriate statistical analyses
- 11Step 9: Interpret, compare, and report the findings
- 12Step 10: Save reproducible outputs and document the analysis
- 13Common Mistakes
- 14Frequently Asked Questions
- 15Do I need IRB approval for secondary analysis of a public survey dataset?
- 16Is survey data primary or secondary data?
- 17Do I have to apply survey weights to get correct results?
- 18Where can I download free survey data for a thesis?
- 19How do I cite a dataset from ICPSR in APA format?
- 20How do I find the missing value codes in a public survey dataset?
- 21Conclusion
What You Need
Seven things, and the first one is the one most people skip.
- A precise research question. Write it as a population, an exposure or predictor, an outcome, and a comparison. If you cannot name all four, you are not ready to download anything.
- Dataset documentation. A user guide, technical report or sampling methodology note. If a study shipped data with no design notes, treat that as a warning sign.
- The codebook or questionnaire. The codebook tells you what each variable name means, what its value labels are and which codes mean missing. The questionnaire tells you what was actually asked, in what order, and what respondents could see.
- Data-use terms. Read the conditions of use before you accept them, not after you have run the models. Some archives require a signed agreement or restrict redistribution of derived data.
- Statistical software with survey support. SPSS Complex Samples, R with the survey and srvyr packages, or Stata with its svy commands all handle weights, strata and clusters properly.
- A reproducible project folder. Separate folders for original data, working data, syntax or scripts, and output. Never edit a file inside the original data folder.
- A running log. A text file where every exclusion, recode and analytic decision is written down as you make it. You will not remember them in March.
How to Use Public Survey Datasets for Secondary Analysis: Step-by-Step
Step 1: Define a question the dataset can answer

Turn your broad interest into a question four existing variables can answer. Write it as: among which population, is what associated with what outcome, compared to what, and in which survey years.
Secondary work needs a reason to exist that is separate from the original paper. Re-running someone else’s published result and writing it up as new research is not secondary analysis; replicating it deliberately, to see whether it holds, is. Keep your own question narrow enough that the available variables can actually address it.
Check feasibility early and honestly. Count the cases left after the population filter, then subtract an allowance for item nonresponse. If your planned subgroup comparison leaves you a few dozen observations, that is a descriptive paragraph, not a model.
Step 2: Find a suitable public survey dataset
Search archives first and the open web last. Start with the national statistical agency that covers your population, then the large general-purpose repositories: ICPSR for social and behavioural data, the Roper Center for public opinion, the UK Data Service for British data, and country archives such as the Australian Data Archive or the Canadian Longitudinal Study on Aging’s data arm.
For topic-specific work, look for the standing cross-national programmes — the International Social Survey Programme, the World Values Survey and European Values Study, the European Social Survey — and for longitudinal panels such as HILDA. Domain-specific sources exist too, from health and education agencies to the American Community Survey distributed through Data.gov.
Screen every candidate against the same checklist: what population, what field dates, what geography, what variables, what sampling design, what access conditions, what file format. A dataset that fails on variables or population is out no matter how famous it is.
Avoid anything scraped from social media or threaded forums and described as survey data. It has no sampling frame, so there is nothing to weight and no denominator to represent.
Step 3: Inspect documentation before downloading or analyzing
Read before you download, because documentation pages usually tell you whether the file is open access, restricted, or application-only. Look for the codebook, the questionnaire, the user guide, the weighting instructions, the sampling design description and the licence.
Three documentation questions decide whether a dataset is usable. Does the codebook document value labels and missing-value codes? Does the technical report describe stratification and clustering? Are the weight variables named and explained, and does it say which one is the analysis weight?
That third question matters more than beginners expect. Repositories commonly ship several weight variables at once — a base design weight, a nonresponse-adjusted weight, sometimes a set of replicate weights for variance estimation. Using the wrong one quietly biases your population estimates, and using no one at all makes your standard errors far too small.
Step 4: Import the data and preserve the original files
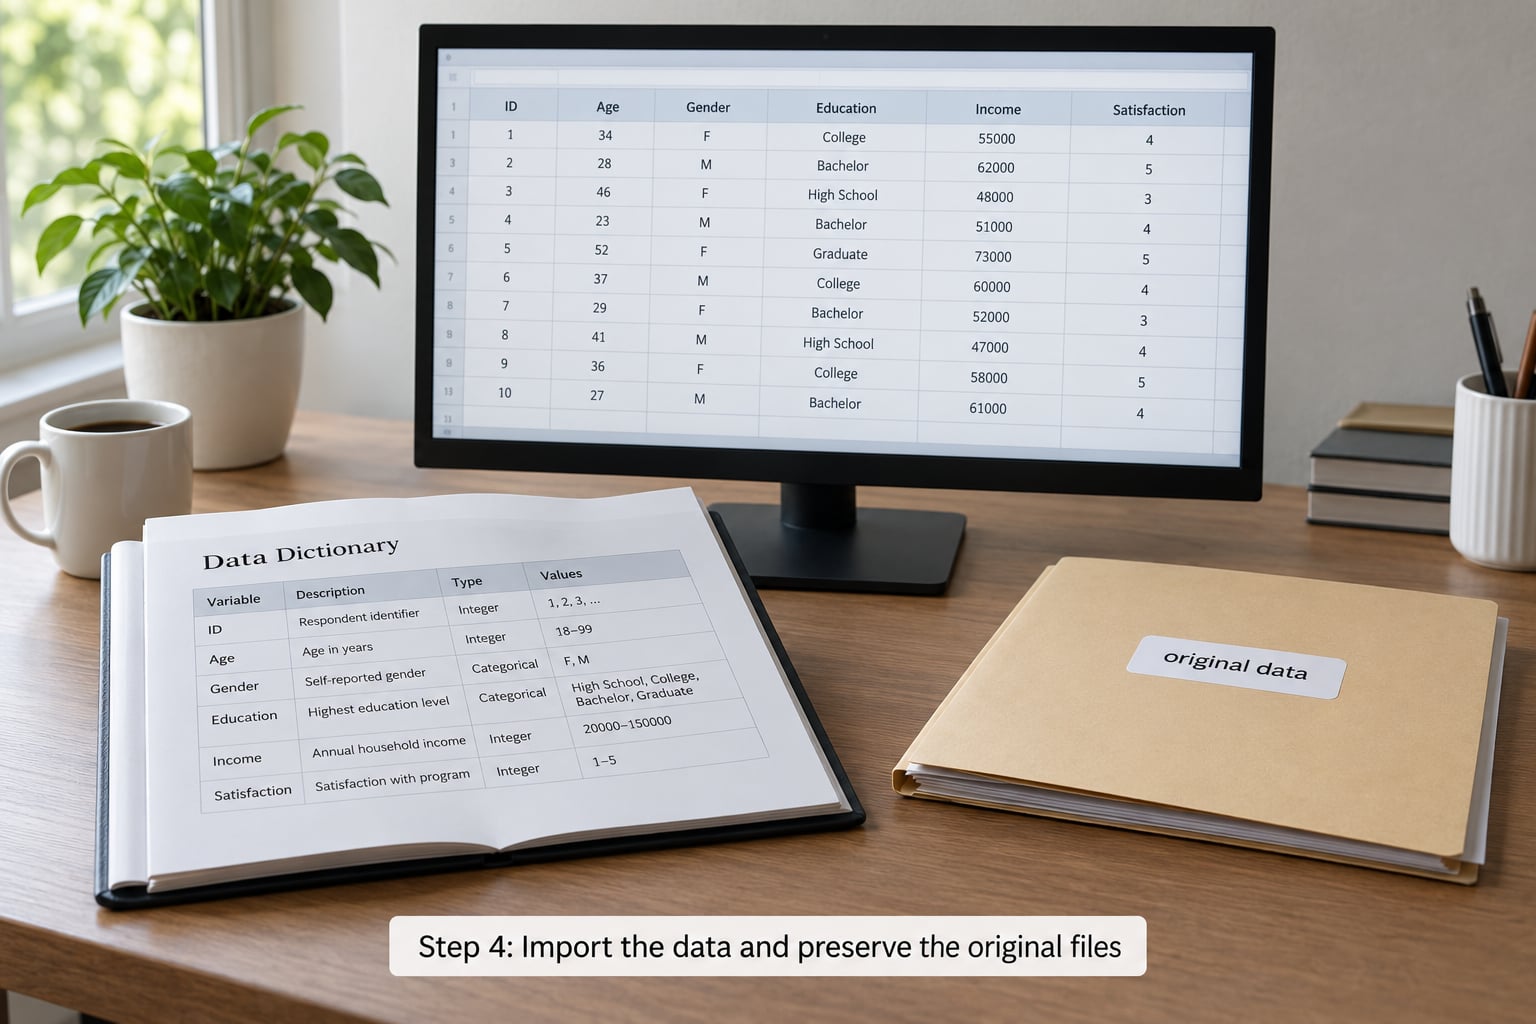
Download the file and copy it into the original data folder. Do not rename it, unzip it in place or open and save over it. That untouched copy is what lets you prove the analysis is reproducible.
Import a working copy into SPSS, R or Stata using the format the archive actually provides — usually a plain-text file with a structure definition, a Stata .dta, or an SPSS .sav. For delimited text, check the layout file first: it names the delimiter, the variable names row and the value label file.
Then verify the import rather than assume it. Confirm the row count and column count match what the archive documents. Look at the first few rows and confirm that numeric variables came in as numbers rather than text, that value labels attached to the right variables, and that missing codes landed as missing.
The most common import failure is categorical variables arriving as raw numbers with no labels, so you end up analysing a code like 4 without knowing it means “strongly agree”. Fix labels at import where you can, using the layout or codebook, rather than guessing from variable names later.
Step 5: Select variables and create an analysis file
Keep only what your question needs. A national survey file can hold several thousand variables, and dragging them all into your analysis is how projects acquire undocumented recodes nobody can explain later.
Match each retained variable to a specific role in your research question — population identifier, weight, stratum, cluster, predictor, outcome, control — and record that role in your variable list. This list becomes the backbone of your methods section.
Merge wave files only when the survey documents the variables as comparable across years, and check that the release notes say which waves share a numbering scheme. Then save the trimmed, labelled file under a new name as your analysis dataset. The original stays untouched in its own folder.
Step 6: Clean and validate the data
Work through a fixed checklist and write down every decision.
- Missing codes. Public files often use -99, -9, 999 or 997 as missing markers. If these stay as real numbers they distort every mean, and they can turn an ordinary outlier into your most extreme case. Recode them to system-missing using the codebook’s exact codes.
- Range checks. Flag impossible values — an age of 112, a top-coded income of zero, a scale item outside 1 to 5.
- Duplicates. Look for repeated case identifiers and, in panel designs, check for impossible sequences of interview dates.
- Category consistency. Confirm that mutually exclusive responses never co-occur, and that skip patterns produce missing rather than nonsense values.
- Straight-lining. On long batteries, count identical responses in a row and decide in advance whether to exclude.
Never delete a case silently. Record how many records each rule removed, and keep a saved list of excluded identifiers so a reviewer can reconstruct the sample.
Step 7: Account for the survey design
This is where most secondary analyses go wrong, and where ignoring the design produces confident, wrong results.
A complex probability sample usually stratifies the population and then samples within strata, often with several respondents per household cluster. The consequence is that observations are not independent: two people from the same cluster or stratum resemble each other more than two random people would. Standard errors computed as if they were independent come out far too small, so results that are not real look significant.
Declare the design before you estimate anything. In SPSS Complex Samples you set weight cases, then designate strata and primary sampling units under the design options. In R the survey package takes a design object built from weights, strata and cluster identifiers, and srvyr wraps it so you can run the familiar verbs on it. In Stata the svy prefix does the same work once you have set the strata, psu and weight variables.
Use a finite population correction only when the documentation specifies it. For subpopulation analysis, restrict within the design rather than pre-filtering the file, so that the variance estimation still respects the original strata and clusters.
Step 8: Choose and run appropriate statistical analyses
Start with weighted descriptives so you can see what you are working with before modelling. Report the weighted distribution of your outcome, the weighted proportion in each category of your predictor, and a design-based confidence interval alongside.
Then match the test to the measurement. Two groups on an interval outcome calls for a weighted independent-samples t-test, or its non-parametric equivalent when the distribution is badly skewed. Two categorical variables call for a weighted chi-square test of association. Three or more groups on a continuous outcome call for weighted ANOVA, with a non-parametric alternative when assumptions fail.
Once you need to adjust for several predictors at once, move to weighted regression — linear, logistic or ordinal depending on your outcome — and report the model output, not just a p-value. Give effect sizes and uncertainty in the text: a difference of 0.4 points on a five-point scale with a confidence interval from 0.1 to 0.7 tells a reader something a bare significance flag does not.
Run every estimate through design-aware commands. The unweighted version of the same model sitting beside it is a useful diagnostic: if the standard errors differ wildly, the design mattered, and you report the weighted one.
Step 9: Interpret, compare, and report the findings
State what your analysis can support. A cross-sectional survey of observational data shows association, not cause, and no amount of statistical control fully rescues that. Use “associated with” rather than “leads to”, and say plainly that the direction of causation cannot be established.
Set your results against the original survey’s stated purpose and population. If a finding diverges from a published result using the same data, look for a substantive explanation — different years, different subgroup, different weight variable, different missing-data handling — before treating the divergence as news.
Report the design honestly: which weight you used, which variables held the strata and clusters, whether you limited to a subpopulation, how many cases were excluded and why. Readers who reuse your work need exactly these details.
Step 10: Save reproducible outputs and document the analysis
A finished secondary analysis leaves seven artefacts behind. The preserved original files. The analysis dataset. The syntax or script that goes from original to results. The output files. A variable list showing each variable’s role. A transformation log recording every recode and exclusion. And a short methods record.
The methods record should carry the dataset name and study ID, the version or release number, the archive it came from, the DOI, the date you downloaded it, the sample you analysed, the weight and design variables, and the software and package versions you used.
Then cite it properly. A dataset citation in APA style names the primary investigators as authors, the year of data collection, the title, the archive and the DOI — not the archive as the author. Ask your department which style it requires and follow that, but check the archive’s own recommended citation, since it is built for exactly this case.
Common Mistakes
- Choosing the dataset before the question. You end up with fascinating variables that cannot address your actual problem. The fix is to write the question first and screen datasets against it.
- Ignoring the codebook. Missing codes survive as data, value labels go unassigned, and categories get reinterpreted wrongly. Read it before opening the data, not after something looks strange.
- Using the wrong weight or none. Several weight variables usually ship together, and picking the wrong one biases population estimates; skipping them shrinks standard errors and manufactures significance. Find the analysis weight in the technical documentation and state it in your methods.
- Deleting missing cases without investigating. Item nonresponse in public surveys is patterned, not random. Report how much data you lost per variable, and consider whether a complete-case analysis is defensible for your question.
- Analysing everything without a rationale. Thousands of variables with no stated role produce fishing. Keep only what your question needs and record why.
- Treating correlation as causation. Survey respondents self-reported, cross-sectionally, with confounders you may not have measured. Use associational language throughout.
- Conflating yourself with the original investigators. You did not collect this data. Present the original study’s purpose, cite it, and describe yourself as analysing it.
- Reporting results without documenting exclusions. A percentage with no sample size, no weight and no exclusion count cannot be checked by anyone. Keep the transformation log and use it.
- Merging incompatible surveys. Two datasets can share a variable name and nothing else — different universes, wording, scales and weight ranges. Verify comparability, or report them side by side rather than pooled.
- Losing the version. Archives revise files. Record the release and DOI you used so your analysis stays checkable after the next update.
Two habits cover most of the above. Re-run one published study using the same data before you trust your own setup — if your numbers do not land near the original, something in your weights, filters or recodes is wrong. And keep the analysis dataset with its weight and design variables intact, so the next person can rebuild your work without guessing.
Frequently Asked Questions
Do I need IRB approval for secondary analysis of a public survey dataset?
Usually not for open, de-identified public use files, because informed consent was already obtained when the data were originally collected and there is no interaction with human subjects through your work. Most institutions still require you to file for an exemption or a determination and keep the letter on file. Rules differ by country, institution and dataset, and restricted-access or identifiable files usually need full review. Check with your ethics board before you start, not after.
Is survey data primary or secondary data?
Both, depending on who is describing it. For the organisation that designed the questionnaire, fielded the interviews and holds the consent forms, it is primary data. For you, downloading an existing file and analysing it, it is secondary data. Say which relationship you are in whenever you describe your sources, because your methods section is judged against the original study’s documentation, not your own fieldwork.
Do I have to apply survey weights to get correct results?
For any estimate meant to describe a population, yes. Weights correct for unequal selection probabilities and nonresponse, so weighted results approximate the population and unweighted results describe only your respondents. You also need strata and cluster identifiers so standard errors are computed for the actual sampling design. Skipping the design understates standard errors, which makes ordinary findings look statistically significant. Cross-tabs of your own sample are the main exception.
Where can I download free survey data for a thesis?
Start with national statistical agencies, then general-purpose archives such as ICPSR, the Roper Center for public opinion research and the UK Data Service. Country archives, Dataverse instances and re3data.org help you locate a repository in a specific field. Topic programmes like the International Social Survey Programme or the World Values Survey suit cross-national work. Most require a free account and acceptance of conditions of use, and some files sit behind an application.
How do I cite a dataset from ICPSR in APA format?
List the investigators who collected the data as the authors, followed by the year the data were collected, the study title in italics, the archive or publisher, and the DOI. Do not cite ICPSR as the author of the data; it is the repository. Include the version or release number and the date you accessed the file when the archive asks for it. The archive’s recommended citation string is built for exactly this and is worth copying verbatim.
How do I find the missing value codes in a public survey dataset?
Open the codebook, not the data file. Look for the variable-level notes listing negative numbers and high codes reserved for missing, refused or not asked, and record them exactly. Then set them as user-missing rather than system-missing where you want them excluded, and apply the rule before any descriptive statistics. Ignore this and a code like 999 becomes a genuine data point that drags your averages and manufactures an extreme case.
Conclusion
Start with the question, not the dataset. Write the population, predictor, outcome and comparison you need, then look for a survey that measures all four and ships real documentation — a codebook with missing-value codes and a technical report that names the weights, strata and clusters.
Read the conditions of use and the sampling design before you download anything, preserve the original file untouched, and record every decision you make after that. If you do those three things, the rest of the workflow runs without surprises. Updated for 2026.