
To calculate Cronbach Alpha in SPSS, open Analyze > Scale > Reliability Analysis, move every item for a single construct into the Items box, tick Item, Scale and Scale if Item Deleted under Statistics, then click OK. The alpha value appears in the Reliability Statistics table in the Output Viewer. The whole run takes about two minutes once your items are coded properly.
This guide walks through that process from the Data Editor to the sentence you paste into your results chapter. It also covers the step most tutorials skip: reverse-coding negatively worded items, which is the single most common reason students get a low or even negative alpha.
The steps below match the current desktop releases of IBM SPSS Statistics, where the Reliability Analysis dialog has kept the same layout and labels for years. Every output table named here comes straight out of that dialog.
Table of Contents
- 1What You Need
- 2Step-by-Step: How to Calculate Cronbach Alpha in SPSS
- 31. Prepare the scale items in the Data Editor
- 42. Reverse-code negatively worded items when required
- 53. Open the Reliability Analysis dialog
- 64. Select Alpha and run the analysis
- 75. Interpret the SPSS output and check each item
- 86. Write the result in APA style
- 9Common Mistakes
- 10Frequently Asked Questions
- 11What Cronbach’s alpha value is considered acceptable?
- 12Does a high Cronbach’s alpha prove that a scale is valid?
- 13Can Cronbach’s alpha be calculated with only five survey items?
- 14Should reverse-coded items be included in the SPSS reliability analysis?
- 15Why is standardized item alpha different from Cronbach’s alpha?
- 16How should missing values be handled when calculating Cronbach’s alpha in SPSS?
- 17Conclusion
What You Need
You need IBM SPSS Statistics (any current desktop release) and a dataset in which each survey statement is already a separate numeric variable. Reliability Analysis is part of the base product. You do not need Amos or any other add-on module.
Four things about your data decide whether the result means anything:
- One row per respondent, one variable per item. SPSS builds the alpha from item columns, not from a single summed score column. If your file holds only total scores, you cannot run the analysis.
- One construct per run. Alpha is only meaningful when every item in the Items box is meant to measure the same thing. A 20-item questionnaire with four constructs needs four separate runs.
- Numeric response codes. Likert responses must be coded 1 to 5, not stored as text labels such as “Strongly agree”.
- Reverse-worded items already recoded. If any statement is worded negatively, fix its coding before you run the analysis, not after.
A worked example runs through this guide: a four-item questionnaire about satisfaction with a bank service, where Q1 to Q4 are statements rated on a five-point agreement scale from strongly disagree to strongly agree, with Q3 worded negatively.
Step-by-Step: How to Calculate Cronbach Alpha in SPSS
1. Prepare the scale items in the Data Editor
Open your file in the Data Editor and switch to Variable View. Check that every survey statement has its own variable with a short name (Q1, Q2, Q3, Q4) and a label carrying the full wording.
Then work through three things:
- Look at the coding for each variable. Values 1 through 5 should map consistently across all four items, so 5 always means strongly agree.
- Declare your missing codes. If respondents could skip a question, add 9 and 99 as user-missing values in the Missing column. Undeclared 99s get treated as real data and wreck the alpha.
- Set Measure to Scale for Likert items. Nominal and Ordinal settings change how some statistics are computed, so leave them for genuinely categorical variables.
Switch back to Data View and scroll across a few rows. Any cell containing a word instead of a number is a data-entry slip that will stop the procedure cold.
2. Reverse-code negatively worded items when required
Q3 in our example reads “The service was slow”, so agreeing with it means dissatisfaction. Left as is, it points the opposite way from Q1, Q2 and Q4, and alpha collapses.
Recode it with Transform > Recode into Different Variables. Enter Q3 into Input Variable and Output Variable, click Add, then click into Old and New Values. Map 1 to 5, 2 to 4, 3 to 3, 4 to 2 and 5 to 1, add each pair to the list, and click Continue.
Use Recode into Different Variables rather than Recode into Same Variables so the original response is preserved. If you overwrite your raw data and later need to re-check the wording, that column is gone.
Verify the recode before running anything: run Analyze > Descriptive Statistics > Frequencies on the new variable and check that its distribution mirrors the mirror image of the original, with no zeros or 99s in the output.
3. Open the Reliability Analysis dialog
Go to Analyze > Scale > Reliability Analysis. The dialog has a small source list on the left showing the variables in your file, an empty Items box on the right, and a Model drop-down.
Select Q1, Q2, Q3 (the recoded version) and Q4 in the source list and click the arrow button to move them into the Items box. The arrow moves one variable at a time, so select the group with Shift held down first.
Type a name for your scale into the small Scale label field near the bottom of the dialog. Something like SATISFACTION or JOBSTRESS shows up in the output instead of the generic Scale label, which matters when you are reporting several constructs in one paper.
4. Select Alpha and run the analysis
In the Model drop-down, leave Alpha selected. That is the tau-equivalent model and it is what you want for Likert items. Other options include Alpha with Kuder-Richardson 20 for binary items, Split-half, Guttman lambda and a rater agreement model.
Click Statistics and tick three boxes in the dialog that opens:
- Item adds the Item-Total Statistics table.
- Scale adds Scale Statistics, including the scale mean and standard deviation.
- Scale if Item Deleted adds the Cronbach’s Alpha if Item Deleted column.
Tick Inter-Item and select Correlations if you want the item correlation matrix, which is how you spot items that barely relate to each other. Click Continue, then OK. SPSS opens the Output Viewer and puts a Reliability Statistics table at the top of the results.
If you use the menus once, SPSS also writes the equivalent syntax into the procedure window behind the dialog, so you can save it as a template for the rest of your constructs.
5. Interpret the SPSS output and check each item
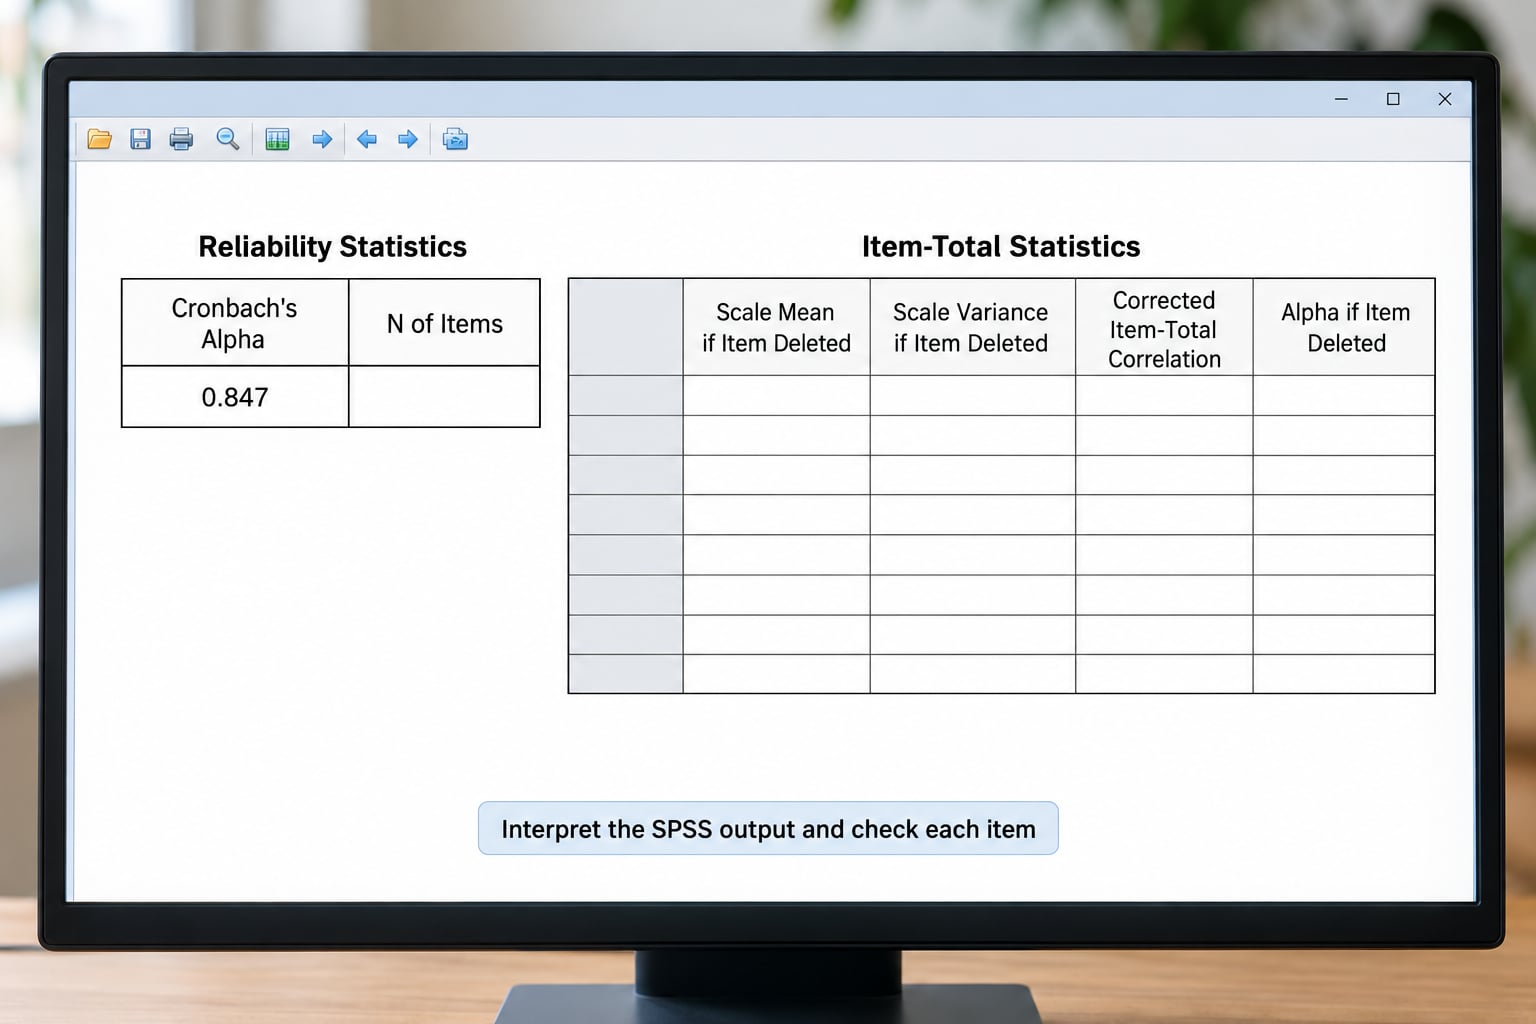
The Reliability Statistics table gives you two numbers that matter: Cronbach’s Alpha and N of Items. N of Items should match the number of variables you placed in the Items box. If it is lower, SPSS dropped a variable because of missing values.
The Item-Total Statistics table is where you actually earn your reliability claim. Each row is one item, and three columns deserve attention:
- Corrected Item-Total Correlation shows how strongly that item agrees with the rest of the scale. Many reviewers use 0.30 as a practical floor, with 0.40 and above being comfortable, though context matters.
- Cronbach’s Alpha if Item Deleted tells you what the overall alpha would become without that item. If it is clearly higher than your current value, the item is doing harm.
- Adjusted Total Mean and Adjusted Total Standard Deviation describe the summed scale score with that one item left out. They are not reliability numbers; ignore them unless you need to describe the score distribution.
An item with a negative corrected item-total correlation is pointing the wrong way and needs a coding fix first, a rethink second.
Low values are not automatically a problem, and high values are not automatically good. Alpha climbs as you add items, even bad ones, so a long scale can score well while measuring several different things. Values above roughly 0.95 often mean two items say the same thing. Judge the number against your field and your sample, not against a single universal cut-off.
If your alpha comes back negative, SPSS has usually told you why: the average covariance among items is negative, which means items are moving in opposite directions. That is a recoding error, a genuinely mixed-construct item list, or too few usable cases.
6. Write the result in APA style
Report the number of items, the alpha value and what it means for your sample. Nothing more is needed. A fill-in template:
The [construct name] scale ([n] items) showed [acceptable / questionable] internal consistency (Cronbach’s alpha = .[xxx]).
A filled-in example:
The bank service satisfaction scale (4 items) showed acceptable internal consistency (Cronbach’s alpha = .84), as did each of the three items included in the final analysis.
Report two decimals rather than three, since the value moves with any small data change. List per-item alphas in a table only when you have several subscales. Do not write that alpha proves the scale is valid or unidimensional; it does neither. If you need to make that argument, run a factor analysis alongside it.
Common Mistakes
Running one alpha over a whole questionnaire. Different constructs in one Items box guarantee a low number. Split your items into separate runs per construct and report each alpha.
Forgetting to reverse-code negatively worded items. This drags alpha down and can push it negative. Recode first, then re-run.
Treating Likert items as nominal. Leave Measure on Scale. Choosing Nominal or Ordinal changes how descriptive statistics are handled and can mislead you about item spread.
Leaving missing codes undeclared. A 9 used for “did not answer” becomes a real score. Set user-missing values in Variable View before you analyse.
Deleting items only to raise alpha. That is data dredging, and a reviewer who notices it will discount the whole scale. Check the corrected item-total correlation and the item wording first, then decide, then say in your write-up that you examined item statistics.
Using Alpha with binary items. If responses are yes or no, choose Alpha with Kuder-Richardson 20 in the Model box instead. For test items scored 0 to 10 rather than 1 to 5, alpha still runs, but check that all items share the same point range first.
A couple of habits save time: name every scale before you click OK, and save the syntax from the first run so the remaining constructs are copy, paste and rename.
Frequently Asked Questions
What Cronbach’s alpha value is considered acceptable?
There is no single magic cut-off, and alpha depends on how many items and how broad the construct is. Many researchers treat 0.70 as a floor for a new or exploratory scale, 0.80 to 0.90 as comfortable for established questionnaires, and anything above 0.95 as a sign of redundant items. Report your value with the number of items and a brief interpretation rather than a bare number.
Does a high Cronbach’s alpha prove that a scale is valid?
No. Alpha measures internal consistency only, meaning the items hang together. A scale can score 0.90 and still measure the wrong construct, or measure two constructs at once. Validity evidence comes from elsewhere: factor analysis, known-groups comparisons, criterion correlations and expert review. High alpha is a reasonable first requirement, never a sufficient one.
Can Cronbach’s alpha be calculated with only five survey items?
SPSS will calculate it, and the formula works down to two items, but short scales give unstable estimates that swing with a few responses. Three items is usually the practical minimum for a scale alpha. Report the item count next to the value every time, and treat a five-item alpha as provisional until it is confirmed on a second sample.
Should reverse-coded items be included in the SPSS reliability analysis?
They should, but only after recoding. Reverse-worded items are often the best items on a scale because they reduce acquiescence bias. Use Transform u0026gt; Recode into Different Variables to map 1 to 5, 2 to 4 and so on into a new variable, keep the original column, and include the recoded version in the Items box.
Why is standardized item alpha different from Cronbach’s alpha?
Standardized alpha weights each item by its standard deviation, which is what you get if you convert every item to a z-score first. The two values diverge when items have very different variances, such as one 5-point item sitting beside a 10-point item. SPSS does not produce standardized alpha from the Reliability Analysis dialog, so stick with plain alpha unless your items really do differ in spread.
How should missing values be handled when calculating Cronbach’s alpha in SPSS?
Declare them first. In Variable View, mark codes like 9 or 99 as user-missing so SPSS excludes them rather than treating them as scores. Reliability Analysis then works listwise, so N of Items in the Reliability Statistics table may drop below the number you placed in the Items box. If it drops a lot, your sample has too many skipped responses to support the analysis.
Conclusion
Start by checking your coding in the Data Editor, especially any reverse-worded items, and confirm Measure is set to Scale for Likert variables. Then run Analyze > Scale > Reliability Analysis, move the items for one construct into the Items box, choose Alpha and request Item, Scale and Scale if Item Deleted under Statistics.
Read the Reliability Statistics table, then work through the Item-Total Statistics table before you accept the number. Report the item count, the alpha value with two decimals and a short interpretation in your write-up. Nothing beyond that is required for a standard results section.