
A regression coefficient tells you how much the predicted outcome changes when one predictor rises by a single unit of its measurement scale, with the other predictors in the model held at the same values. Every number in the coefficients table answers one of three questions: which direction, how much, and how confident can I be. Once you can turn an estimate into a sentence a non-statistician understands, the output table stops being a wall of decimals.
One caveat before we start, because it belongs in your first paragraph and not buried in a footnote: regression describes association, not causation. A coefficient tells you that two things move together in your data. It does not tell you that moving one causes the other, and no amount of significance changes that.
The rest of this guide is the procedure I use when I sit down with an output table: read it in a fixed order, decide what each number is for, and write one defensible sentence per row. It works the same whether the table came out of SPSS, R, Stata, or the Excel Data Analysis tool, because the four packages are reporting the same quantities under different labels.
Table of Contents
- 1What Is a Regression Coefficient?
- 2The regression equation, decoded
- 3How to Interpret Regression Coefficients in Plain English
- 4The six-step method
- 5A template sentence you can reuse
- 6How to Read a Coefficient Table
- 7What Does a Positive or Negative Coefficient Mean?
- 8How to Know Whether a Coefficient Is Important
- 9Statistical significance
- 10Practical importance
- 11What Do the Units and Scale Mean?
- 12How Do Control Variables Change the Interpretation?
- 13Holding constant, in practice
- 14Simple and Multiple Regression Examples
- 15Example 1: simple regression, study hours and exam score
- 16Example 2: multiple regression, sleep and study hours with score
- 17Common Regression Coefficient Mistakes
- 18Frequently Asked Questions
- 19How do I know if a regression coefficient is statistically significant?
- 20How do I interpret regression coefficients when the outcome is binary?
- 21How do I interpret coefficients for categorical predictors?
- 22Should I report standardized or unstandardized coefficients?
- 23How do I write up regression results in plain English?
- 24Conclusion
What Is a Regression Coefficient?
A regression coefficient is the number that tells you how much the predicted outcome changes when one predictor increases by one unit, while the other predictors are held at the same values. The sign gives the direction of the association. The magnitude gives the size of the change in the outcome’s own measurement scale. That is the entire idea.
Two terms you need before anything else. The predictor (also called the independent variable) is the thing you think might explain something. The outcome (also called the dependent variable) is the thing being explained. Each predictor gets its own coefficient, and that coefficient is always tied to a specific unit of change in that predictor.
The regression equation, decoded
A fitted regression model is written as an equation with one term per predictor plus the error:
outcome = intercept + (coefficient × predictor) + … + error
Take a simple model predicting exam score from hours studied: score = 58.4 + (4.2 × study hours). The intercept of 58.4 is the predicted score for a student who studies zero hours. The coefficient of 4.2 is the change in predicted score for each additional hour studied.
The intercept is the term most readers get wrong twice: once about what it predicts, and once about whether it means anything at all. It predicts the outcome when every predictor sits at zero. If zero is not a meaningful value for one of your predictors, the intercept is arithmetic rather than substance, and you are free to center the variable or ignore the number.
| Part of the equation | Plain-English meaning | Report it in a paper? |
|---|---|---|
| Intercept | Predicted outcome when every predictor equals zero | Only when zero is a real, meaningful value |
| Coefficient (B or beta) | Change in predicted outcome per one-unit increase in that predictor, other predictors held constant | Always, with its standard error, test value, p-value, and confidence interval |
| Error | The gap between the predicted value and the observed value for each case | No, but check the residuals before trusting the fit |
You can identify a regression equation in any output by looking for the row labelled constant, intercept, or (Intercept), then following the rows beneath it. Each of those rows is one predictor’s coefficient, and the coefficients multiply their own variable only.
How to Interpret Regression Coefficients in Plain English
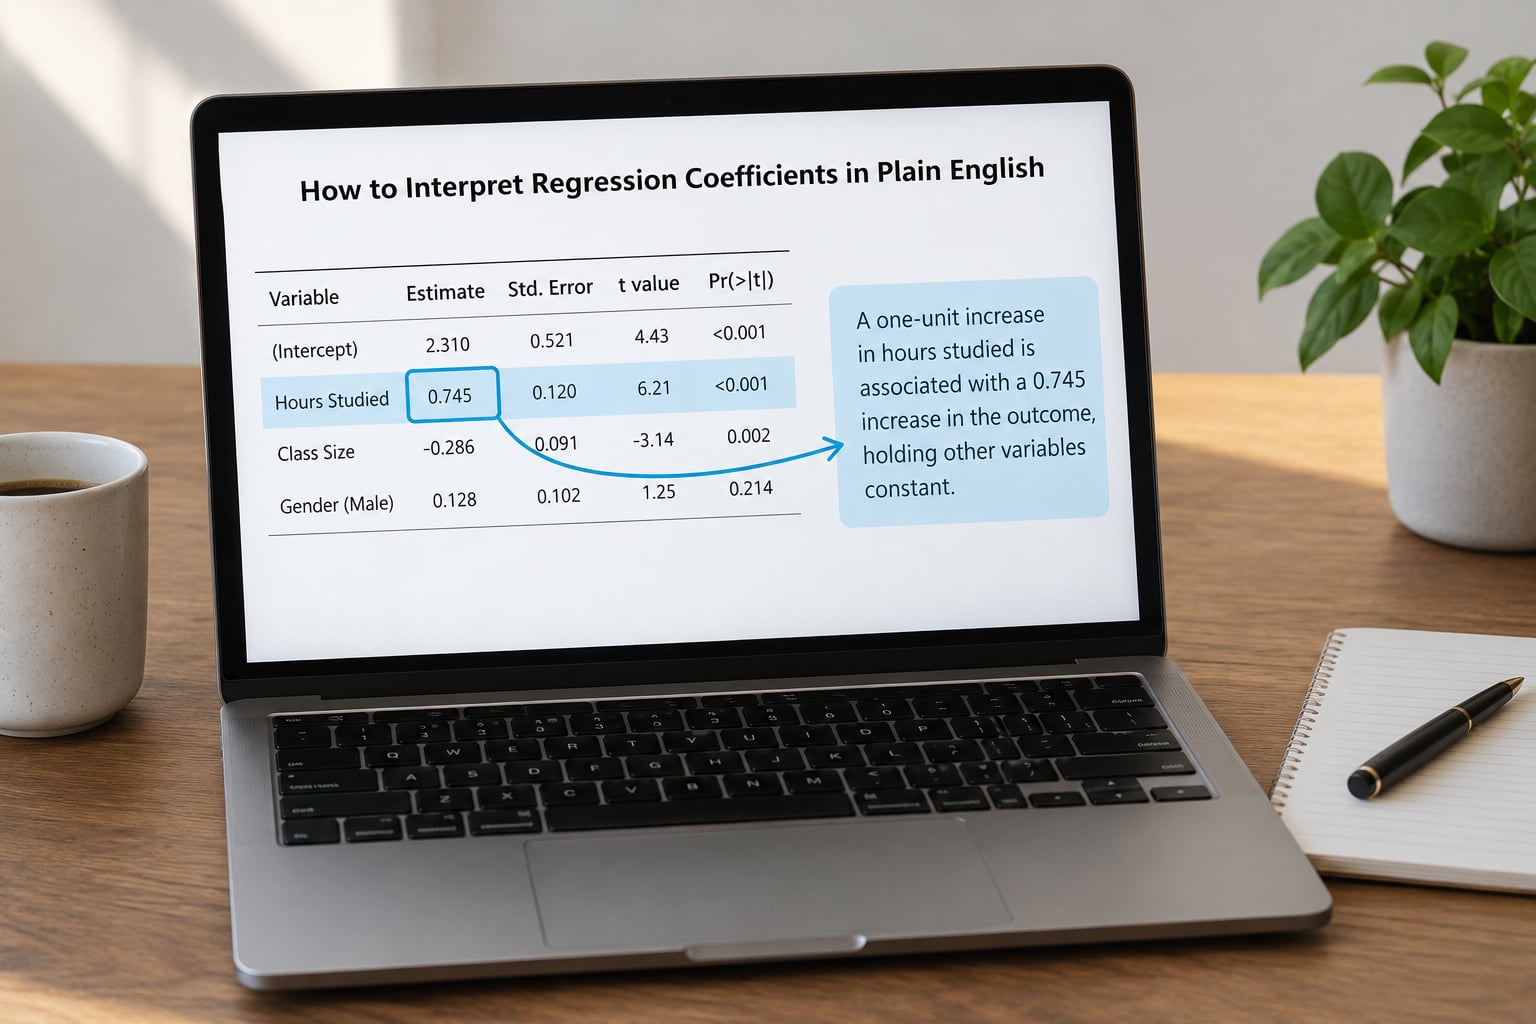
To interpret regression coefficients in plain English, fix the direction from the sign, take the magnitude in the outcome’s own scale, name the one-unit change that produced it, add the phrase about the other predictors staying put, and finish with the confidence interval and p-value so the reader knows how firm the finding is. That is a repeatable method rather than a party trick, and it takes about twenty seconds per row once you have it.
The six-step method
Step 1: Name the outcome and its measurement scale. Before reading any number, say what the outcome is measured in: exam points, kilograms, dollars of monthly income, whether the person bought the product. The scale is fixed by your data, so the interpretation must be expressed in that scale or it is not an interpretation.
Step 2: Name the predictor and its one-unit change. “One unit” means different things: one additional hour of study, one extra year of age, one extra thousand dollars of income, moving from one category to the next. If you cannot state what one unit is, you cannot interpret the coefficient.
Step 3: Take the direction from the sign. A positive coefficient means the outcome tends to rise as the predictor rises. A negative coefficient means the outcome tends to fall. A coefficient near zero means the predictor has little linear association with the outcome in this model.
Step 4: Take the size from the estimate. The number itself is the change in outcome units per one-unit change in the predictor. Multiply it out in real terms: a coefficient of 4.2 points per hour is a very large effect on an exam; the same 4.2 is trivial on a scale running into the thousands.
Step 5: Add the constant-others clause. Add that the association holds with the other included predictors kept at the same value. In a simple regression there are no other predictors, so skip it. In a multiple regression it is not optional, because that clause is the definition of the partial coefficient.
Step 6: Attach the uncertainty. Finish with the confidence interval and p-value, in that order. The interval tells you the range of plausible values; the p-value tells you how compatible the data are with an association of exactly zero. Reporting the estimate alone is the single most common reporting error I see.
A template sentence you can reuse
Fill in the blanks and you have a sentence that will survive a supervisor’s red pen:
“For each one-unit increase in [predictor], the predicted [outcome] increases/decreases by [B] [outcome scale], holding [other predictors] constant (B = [B], SE = [SE], 95% CI [[lower], [upper]], t = [t], p = [p]).”
Here it is filled in for study hours: “For each additional hour of weekly study, the predicted exam score increased by 4.2 points, and no other predictors were included in this model (B = 4.2, SE = 1.10, 95% CI [1.90, 6.50], t = 3.82, p = .001).” That is a full sentence a reader in a different discipline can follow without knowing what a standard error is.
How to Read a Coefficient Table
Read a coefficient table column by column in this fixed order: the estimate, the standard error, the confidence interval, the test value, and the p-value, then the model-level R-squared and F-test at the end. Reading it in a fixed order is what stops you from comparing two rows on the estimate alone.
| Column | What it answers | How to say it in plain words |
|---|---|---|
| Estimate (B, beta, or coefficient) | Direction and size | The change in predicted outcome per one-unit change in this predictor |
| Standard error (Std. Error, SE) | Precision | How much the estimate tends to move if you repeated the study with other samples |
| Test value (t or z) | Estimate against its own noise | The estimate divided by its standard error; around 2 or beyond is large |
| Significance (Sig. or p) | Compatibility with zero | The probability of seeing an association this strong if there were truly no association |
| 95% confidence interval | The plausible range | If the interval contains zero, the association is not distinguishable from no association |
| R-squared and adjusted R-squared | How much the model explains | The share of variation in the outcome accounted for by the predictors together |
| F-test (or model F) | Whether the model as a whole beats an empty model | A joint check that at least one predictor has a non-zero association |
Two habits matter more than memorising the columns. First, look at the interval rather than the p-value; an interval gives you the size and the precision in one place. Second, read the model-level numbers last, because R-squared describes the model and not any single row.
R-squared of 1 would mean the model reproduces every observed value exactly, with no residual left over. A value of 0.6 means the predictors together account for 60 percent of the observed variation in the outcome, which sounds substantial and often is in social science, but would be poor in a physical measurement where your theory predicts near-perfect fit.
What Does a Positive or Negative Coefficient Mean?
A positive coefficient means that as the predictor rises, the predicted outcome tends to rise with it. A negative coefficient means the outcome tends to fall as the predictor rises. Neither sign says anything about importance, goodness, or cause.
Consider study hours predicting exam score. A coefficient of 4.2 is positive, so more study goes with higher scores in this sample. Consider stress hours predicting sleep quality scored 1 to 10. A coefficient of -1.3 is negative, so more hours of stress go with lower reported sleep quality.
Negative coefficients are frequently reported as suspicious by people new to modelling, and then defended as meaningful once they understand suppression. In a simple regression a negative slope usually points the way a naive reader expects. In a multiple regression it can appear when two predictors are strongly related to each other: once one of them is in the model, the other appears to push the outcome the other way. That is a property of the model specification, not a finding about the world.
Three things a sign cannot tell you: whether the association is statistically distinguishable from zero, whether it is large enough to matter, and whether it holds outside your sample. All three come from other columns and from your judgement.
How to Know Whether a Coefficient Is Important
A coefficient matters in two different senses, and they come apart often enough to confuse people. Statistical significance asks whether the association is distinguishable from zero. Practical importance asks whether the size of the association matters for the decision in front of you.
Statistical significance
You have a statistically significant coefficient when its confidence interval excludes zero, or equivalently when its p-value falls below the threshold you set in advance. A p-value of 0.05 does not mean there is a 5 percent chance the association is fake. It means that, if there were truly no association in the population, data like yours would produce a coefficient this far from zero about 5 times in 100.
Significance is mostly a function of sample size. With 20,000 observations, a coefficient that nobody would act on becomes significant; with 23 observations, a substantively large coefficient can fail to reach .05. Treat the p-value as a statement about evidence strength, never as a verdict.
Practical importance
Judge the size in the outcome’s own scale and against a comparison you care about. An exam-score effect of 4.2 points on a 100-point scale is large. An income effect of 0.4 percent is usually not. Comparing the estimate against the range of the outcome gives a quick sense: divide the coefficient by the outcome’s standard deviation and you have a rough effect size in standard-deviation terms.
For standardized beta, that division has already been done for you. A beta of 0.35 means the predictor is associated with roughly a third of a standard deviation of the outcome, per standard deviation of the predictor.
Ask three questions before you call a coefficient important. Does the size matter in the units people care about? Is it stable enough to survive a different sample or a different model specification? And can you do anything with it? A precise, statistically strong estimate of something you cannot act on is still not an important finding.
What Do the Units and Scale Mean?
The same underlying association can produce wildly different coefficients depending only on how the variables were measured, which is why comparing two raw B values across predictors on different scales is invalid. A coefficient of 30 on income and a coefficient of 0.5 on age tell you nothing about which predictor matters more until you normalize them.
| Variable and its scale | What “one unit” means | How you would phrase the interpretation |
|---|---|---|
| Study hours, measured weekly | One extra hour per week | Each additional weekly study hour is associated with N more exam points |
| Age, measured in years | One year older | Each additional year of age is associated with N more (or fewer) units of the outcome |
| Income, measured in thousands | One thousand more per year | Each additional thousand of income is associated with N more units of the outcome |
| Test score, 0 to 100 | One point higher | Each additional point on the test is associated with N more units of the outcome |
| Any variable, standardized to z-scores | One standard deviation | Each one-standard-deviation increase is associated with N more standard deviations of the outcome |
Three adjustments change what you should say. Standardizing a variable rescales it to standard deviations, so the coefficient becomes a unitless standard-deviation change; that is what the software calls beta. Centering subtracts a mean, which leaves the slopes untouched but turns the intercept into the predicted outcome at an average rather than a zero value. Transforming a variable, for instance by taking its logarithm, changes the unit of change from a one-unit increase to a one-percent increase, and the interpretation has to follow.
A coefficient on its own is not a score you can rank. A value of 0.30 in dollars and a value of 0.30 in test points describe two completely different relationships, and size only becomes meaningful once you attach the two measurement scales to it.
How Do Control Variables Change the Interpretation?
In a multiple regression, each coefficient is the association between its own predictor and the outcome while the other included predictors are held at the same values. That clause is not a formality: it is the difference between an unadjusted and an adjusted estimate, and the two can be very different.
Take sleep hours and exam score in a sample of 90 students. Predicting score from sleep alone gives a coefficient of 2.0 points per hour, which reads as a strong positive association. Now add weekly study hours to the model, and the sleep coefficient drops to 1.1.
Nothing about sleep changed between the two runs. Students who sleep more also tend to study more, and the sleep coefficient in the second model is what remains after that shared movement is accounted for. The unadjusted 2.0 mixes two things: the association of sleep with score and the association of sleep with study hours. The adjusted 1.1 is the cleaner estimate of the sleep-score link.
Two cautions about this reading. Controlling for a variable is only sensible when it makes substantive sense as something you would want to adjust for; controlling for a mediator that sits between your predictor and your outcome gives you a different question than the one you probably meant to ask. And with many controls on a modest sample, coefficients get unstable, which is the multicollinearity problem described in the mistakes section at the end.
Holding constant, in practice
Some methodologists argue that “holding other variables constant” describes a procedure rather than a real-world comparison, since the other variables are rarely actually fixed when a predictor changes. They prefer wording that describes the model as adjusting for simultaneous linear change in the other predictors. For a practitioner, both point at the same number: it is the part of the association that survives after the model’s other terms are accounted for.
Write it that way and you will not be challenged. Say “each additional hour of study is associated with 3.6 more exam points, after accounting for the number of hours slept” and the sentence is defensible in either framing.
Simple and Multiple Regression Examples
Example 1: simple regression, study hours and exam score
Suppose 90 students report weekly study hours and take a 100-point exam. A simple linear regression gives the coefficients table below.
| Term | B | Std. error | t | p | 95% CI | Standardized beta |
|---|---|---|---|---|---|---|
| (Constant) | 58.40 | 2.10 | 27.81 | <.001 | [54.11, 62.69] | — |
| Study hours | 4.20 | 1.10 | 3.82 | .001 | [1.90, 6.50] | .56 |
Model fit: R-squared = .31, adjusted R-squared = .30, F(1, 88) = 14.59, p < .001.
The intercept says a student studying zero hours is predicted to score 58.4 points, which is a real statement here because zero hours is possible. The coefficient says each additional weekly hour of study is associated with 4.2 more exam points, and the interval runs from 1.9 to 6.5, so the plausible size of that association is somewhere between under two points and six and a half.
The standardized beta of .56 says the same association in standard-deviation language: a one-standard-deviation increase in study hours goes with about half a standard deviation more score. Because there is only one predictor here, beta tells you nothing extra; it becomes informative in the next example.
R-squared of .31 means study hours alone account for 31 percent of the variation in exam scores. Study is not the only thing going on, and the model should not be used to predict an individual student’s exact score.
Example 2: multiple regression, sleep and study hours with score
Now predict exam score from both sleep hours per night and weekly study hours.
| Term | B | Std. error | t | p | 95% CI | Standardized beta |
|---|---|---|---|---|---|---|
| (Constant) | 62.00 | 4.90 | 12.65 | <.001 | [52.05, 71.95] | — |
| Study hours | 3.60 | 1.00 | 3.60 | <.001 | [1.53, 5.67] | .48 |
| Sleep hours | 1.10 | 0.50 | 2.20 | .031 | [0.09, 2.11] | .15 |
Model fit: R-squared = .42, adjusted R-squared = .40, F(2, 87) = 31.48, p < .001.
Three sentences come out of this table. Each additional hour of weekly study is associated with 3.6 more exam points after accounting for hours of sleep, and that estimate is precise enough that its interval sits well clear of zero. Each additional hour of sleep per night is associated with 1.1 more exam points after accounting for study hours, with an interval that only just excludes zero, so treat the size as imprecise.
The standardized betas settle the comparison the raw B values cannot. Study hours at .48 are associated with nearly half a standard deviation of score per standard deviation, sleep hours at .15 with about a sixth. Both predictors have moved, so the model is capturing shared variation better, and R-squared has risen from .31 to .42.
The intercept of 62.0 predicts a score for a student with zero study hours and zero sleep, which is nobody. That is a perfectly normal intercept with no useful interpretation, and you report it in the table without commenting on it, or you center both variables so it becomes a meaningful average-case prediction.
Common Regression Coefficient Mistakes
Most misreadings of regression output come from one of six habits, and each has a straightforward correction.
1. Using causal language. “Increasing sleep by one hour raises scores by 1.1 points” asserts cause. Write “is associated with” or “is linked to” instead. If you need a causal claim, you need a design that supports it, not a different verb choice.
2. Comparing raw B values across predictors on different scales. The B of 4.2 points per hour and a B of 0.5 dollars per year are not comparable, because the underlying measurements differ. Use standardized betas, or compare each coefficient to the outcome’s own standard deviation.
3. Treating p < .05 as importance. A tiny p-value can sit on top of an effect far too small to matter, especially in a large sample. Report the interval and the size in real units alongside it.
4. Reading a negative coefficient as a bad finding. The sign reports direction only. A negative coefficient for a cost, an error rate, or a symptom score can be exactly what you hoped to see.
5. Forgetting which group a dummy variable compares against. With categorical predictors, each coefficient is a difference from a reference group, and packages pick that group differently. Check the reference level before writing anything.
6. Interpreting an intercept that corresponds to an impossible case. Zero study hours with zero sleep predicts a real person who does not exist. Center the variables or state plainly that the intercept is not substantively meaningful.
Two further cautions that do not fit the list format. With strongly correlated predictors, coefficients become unstable: drop one predictor and the others can shift noticeably even though the model fits about the same, so avoid reading one coefficient in isolation when variance inflation factors are high. And when the outcome is binary, or the counts are small, ordinary least squares is the wrong tool: use logistic regression and read the exponentiated coefficient as a multiplier of odds rather than a change in outcome units.
Frequently Asked Questions
How do I know if a regression coefficient is statistically significant?
A coefficient is statistically significant when its confidence interval excludes zero, which is the same condition as its p-value falling below your threshold set before analysis. In the output table, check that the lower and upper bounds of the 95 percent interval are both positive or both negative. Note that significance reflects sample size as much as effect size, so report the estimate and interval in real units alongside it.
How do I interpret regression coefficients when the outcome is binary?
When the outcome is binary, such as bought or did not buy, you use logistic regression and the raw coefficient is on the log-odds scale, which is rarely worth reporting directly. Exponentiate it instead: an odds ratio of 2.0 means the odds of the outcome are doubled per one-unit increase in the predictor, holding the other predictors constant. Doubling is not the same as a doubling of probability, because the baseline probability matters.
How do I interpret coefficients for categorical predictors?
A categorical predictor with three levels produces two dummy coefficients, one for each non-reference level. Each one is read as the difference in predicted outcome between that level and the reference level, holding other predictors constant. You have to look up which level the software treated as the reference, because packages often default to the first level alphabetically, and check the coding you specified if you set it yourself.
Should I report standardized or unstandardized coefficients?
Report the unstandardized B when you want the effect in real units, for example exam points per additional study hour, which is what a practitioner can act on. Report the standardized beta when you want to compare predictors measured on different scales, because it expresses the association in standard deviations for both sides. Many papers show both columns, and there is nothing wrong with that.
How do I write up regression results in plain English?
Use one sentence per coefficient: name the predictor and its one-unit change, give the direction, the estimate in the outcome’s own units, the constant-others clause when the model has other predictors, then the standard error, confidence interval, test value, and p-value in parentheses. Report R-squared and the model F once after the coefficient sentences, not attached to each row, and describe direction as association rather than cause.
Conclusion
Start with your output table and do four things: identify the outcome’s measurement scale and the predictor’s one-unit change, read the estimate for direction and size, check whether the confidence interval excludes zero, and write a sentence that says association rather than cause. Do that for every row before you write a word of your results section, and the numbers stop being intimidating. If a coefficient will not survive that sentence, it is probably not a finding yet.