
Use a nonparametric test instead of a parametric test when your data break a parametric assumption and that assumption matters at your sample size: ordinal or ranked outcomes, severe skew that a transformation cannot fix, influential outliers, censored values at a detection limit, or small samples where the central limit theorem has not taken over. If your groups have more than about 15 to 20 observations each and no extreme outliers, non-normality alone is usually not a reason to switch.
The decision follows from the research question and the study design first, not from the name of a test. Work outward from there: what you measured, how the observations were collected, which assumption is actually broken, and whether it breaks badly enough to distort the result.
Table of Contents
- 1What Is the Difference Between Parametric and Nonparametric Tests?
- 2When to Use Nonparametric Tests Instead of Parametric Tests
- 3How to Check Whether a Parametric Test Is Appropriate
- 4When to use nonparametric tests instead of parametric tests by study design
- 5Which Nonparametric Test Matches the Research Question?
- 6What Counts as a Serious Problem With the Data?
- 7Can You Use a Nonparametric Test With a Small Sample?
- 8What If the Data Are Ordinal Rather Than Numerical?
- 9Should You Transform the Data or Use a Nonparametric Test?
- 10How to Choose and Report the Test in a Research Paper
- 11Frequently Asked Questions
- 12Are nonparametric tests always less powerful than parametric tests?
- 13Does a nonparametric test compare medians automatically?
- 14Do nonparametric tests work when group variances are unequal?
- 15Can I choose a statistical test based only on sample size?
- 16Which statistical software can perform nonparametric tests?
- 17Conclusion: Start With the Research Question and Assumptions
What Is the Difference Between Parametric and Nonparametric Tests?
A parametric test is a hypothesis test that assumes a specific distribution form for the population and estimates its parameters. A t-test, an F-test in one-way ANOVA, and Pearson’s correlation all sit in this family, and all of them assume the outcome is approximately normally distributed within each group.
A nonparametric test, often called a distribution-free test, assumes no particular distribution shape. It works by replacing the raw values with ranks or by comparing counts, so it stays valid whether the data are normal, skewed, ordinal, or full of outliers.
The difference is not that one family has assumptions and the other has none. Nonparametric tests have their own requirement that gets stated rarely: to read a rank test as a test of central tendency, the groups should share a similar distribution shape and differ mainly in location. When one group is tight and another is widely spread, the rank test is really testing a general difference in distributions rather than a clean shift in medians.
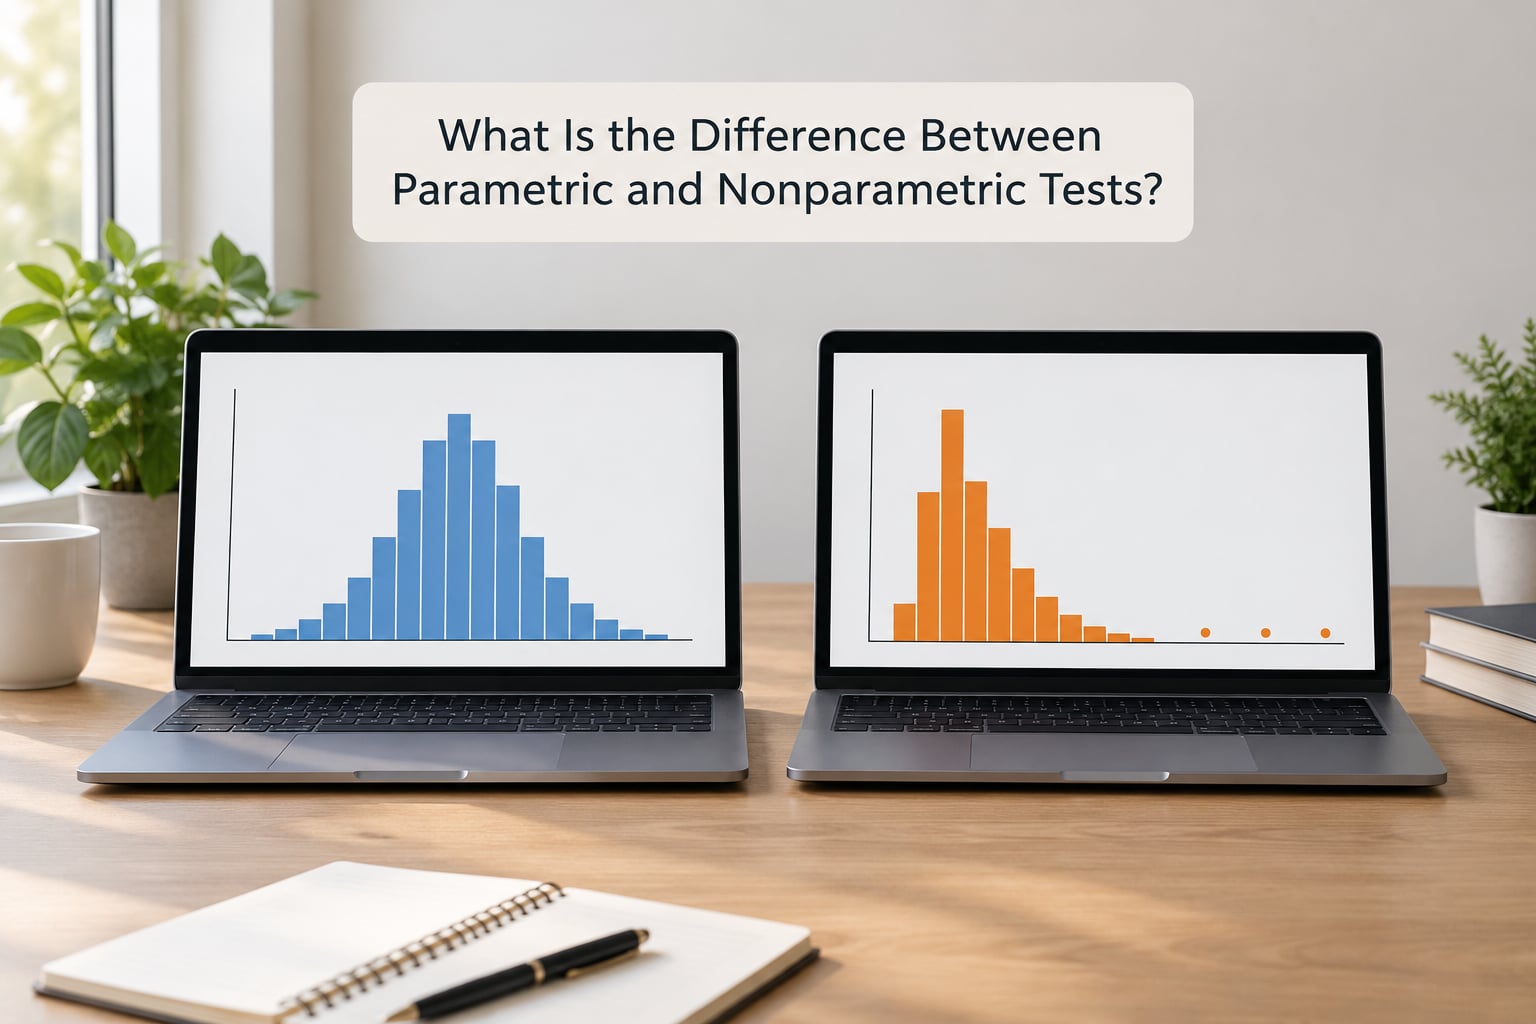
Nonparametric also does not mean “no parameters.” It means the test either uses fewer parameters or estimates them through methods that do not depend on a normality assumption.
When to Use Nonparametric Tests Instead of Parametric Tests
Here is the decision checklist in the order you should apply it. Each trigger below means the ordinary parametric answer is no longer safe.
- Your outcome is ordinal or ranked, not interval. Likert items, satisfaction rankings, exam placements, and disease severity grades carry order but no guarantee that the gap between 3 and 4 equals the gap between 1 and 2.
- Influential outliers distort the analysis. A single salary observation or a single corrupted sensor reading can drag a mean far enough to change your conclusion, while ranks barely move.
- The distribution is badly skewed and a transformation does not help. Counts, waiting times, incomes, and heavy-tailed measurements often stay skewed after a log or Box-Cox transform, and transformed results then apply only to the transformed scale.
- Values are censored at a detection limit. Lab assays record “below 0.1” or “above 10,000” as symbols rather than numbers. Neither family handles these gracefully, and a rank-based approach with assigned values is the usual compromise.
- The design is one where the parametric version has no clean twin. Two-way ANOVA, mixed models, and ANCOVA have assumptions that rank-based post-hoc substitutes do not fully repair. A permutation test on the model itself is often the better answer.
- The sample is small and the skew is visible. Below roughly 20 observations per group, the central limit theorem has not rescued the sampling distribution of the mean.

Now the counter-rule, which is where most guides go quiet. Non-normality by itself is not a sufficient reason. A rough threshold from simulation work, as summarised on statisticsbyjim.com, is more than 20 observations for a one-sample t-test, more than 15 per group for a two-sample t-test, and more than 15 per group for a one-way ANOVA with two to nine groups.
Those are guides, not laws, and they assume no wild outliers. Check your own data rather than trusting a threshold your supervisor read in a textbook.
How to Check Whether a Parametric Test Is Appropriate
Graph the data before you run any test for normality. A test gives you a p-value; a plot tells you how badly the assumption is broken and where, which is the information you actually need for a decision.
Start with a histogram and a boxplot per group. A Q-Q plot is the sharper tool: if the points track the diagonal line reasonably well, the normality assumption is in good shape. If they curve sharply at one end, you have skew, and if isolated points sit far off the line, you have outliers.
After looking, you can test formally. Shapiro-Wilk is the more sensitive option at small sample sizes, and the Kolmogorov-Smirnov test is the traditional alternative that more textbooks still recommend. Levene’s test checks whether group variances are equal, which matters for the classic independent-samples t-test and one-way ANOVA but not for Welch’s versions.
Be honest about the limits. Normality tests have very low power at small n, so a non-significant result at n = 12 per group tells you almost nothing. A significant result at n = 400 can be triggered by a trivial departure that does not threaten your p-value at all.
When to use nonparametric tests instead of parametric tests by study design
The design narrows the field before any distribution check happens.
- Two independent groups point to the independent-samples t-test or the Mann-Whitney U test.
- Two matched or paired samples, such as before-and-after measurements on the same people, point to the paired t-test or the Wilcoxon signed-rank test.
- Three or more independent groups point to one-way ANOVA or the Kruskal-Wallis test.
- Three or more repeated measurements on the same subjects point to repeated-measures ANOVA or the Friedman test.
- Ordinal or ranked outcomes point to Mann-Whitney, Wilcoxon, Kruskal-Wallis, Friedman, Spearman’s rank correlation, or Fisher’s exact test depending on the question.
- Clustered data, such as students nested in schools or patients nested in clinics, need a multilevel model or a cluster-robust approach rather than a plain rank test.
Study design is also how you check independence. If observations are related, no distributional trick rescues the analysis.
Which Nonparametric Test Matches the Research Question?
Match the alternative to the question you already planned, not to the data you happen to dislike.
| Parametric test | Nonparametric alternative | Use the nonparametric version when |
|---|---|---|
| Independent-samples t-test (two groups) | Mann-Whitney U test | The outcome is ordinal or ranked, or outliers make the group means unreliable. |
| Paired t-test (matched or pre/post) | Wilcoxon signed-rank test | Differences are skewed or the measurements are ordinal. Many ties weaken this test. |
| One-way ANOVA (three or more groups) | Kruskal-Wallis test | Group distributions are strongly skewed or contain influential outliers. |
| Repeated-measures ANOVA | Friedman test | Repeated ordinal measurements across conditions or time points. |
| Pearson correlation | Spearman’s rank correlation | One or both variables are ordinal, or the relationship is monotonic but not linear. |
| Chi-square test of independence | Fisher’s exact test | Any expected cell count is below 5. Chi-square is itself nonparametric. |
| Two-way ANOVA | No clean substitute; use a permutation test on the model or aligned rank transform | Two factors and interaction effects with assumptions violated. Rank-based substitutes lose power and are awkward to interpret. |
Two details in that table catch people out. First, the chi-square test is nonparametric, so the common question of whether it belongs to the parametric family has a straightforward answer. Second, there is no “nonparametric t-test.” The Mann-Whitney U and the Wilcoxon signed-rank test fill that role.
Read the Mann-Whitney result carefully. If both groups share a similar distribution shape, you can describe a difference in typical values. If the shapes differ, the honest statement is that one group tends to have higher values overall, not that the medians differ.
What Counts as a Serious Problem With the Data?
Not every violation deserves the same response. Ranked from most to least serious, here is what actually threatens your conclusion.
- Influential outliers that carry real meaning. A genuine extreme case should stay in and needs a method that limits its leverage, such as a rank test or a robust model. An outlier caused by a data-entry error should be fixed, not analysed away.
- Severe skew with a floor or ceiling. Many observations piled at 0 or at the maximum score, as in exam marks or pain ratings, break both normality and the spread assumption.
- Dependent observations. Repeated measures on the same subject, siblings in one family, or patients in the same clinic violate independence. No choice of family fixes this.
- Severely unbalanced groups. A design with 40 observations in one group and 6 in another makes both the parametric and the rank result fragile.
- Unequal variances. This one is often overstated. Welch’s t-test handles unequal variance in a two-group comparison, and Welch’s correction is available for ANOVA, so variance inequality alone rarely justifies a switch.
- Mild skew in a reasonably large sample. Least serious of all. Leave the parametric test in place.
When your parametric and nonparametric results disagree, work through it in order. First decide which test matches the question you asked. Then check whether the distributions differ in shape as well as location, because that alone can explain a divergence. Report the test you selected in advance of looking at significance, explain the assumption that ruled out the other, and treat the discrepancy as a limitation in your discussion rather than as a reason to report whichever result is more convenient.
It is defensible to use a t-test for one variable and a Mann-Whitney U for another inside a single study. Say so in your methods section and state the rule you applied to each variable.
Can You Use a Nonparametric Test With a Small Sample?
Yes, with a caveat that surprises most people: a nonparametric test does not rescue a tiny sample. Small n already limits power, and rank-based tests give up a little more, so a real effect is less likely to be detected. Practitioners running pilots with 10 to 20 observations per group hit this wall repeatedly and report the same frustration.
What you do gain is validity. With n = 10 per group and heavy skew, a t-test can inflate the Type I error rate above your nominal 5 percent, while an exact rank method keeps it close to where you set it.
Look for the word “exact” in your software output. Exact inference enumerates every possible arrangement of the ranks and computes the true p-value, which matters when samples are small or tied ranks are heavy. Asymptotic inference uses a large-sample approximation and drifts when both are problems. Report which one you used, because an exact p-value and an approximate one are not the same claim.
What If the Data Are Ordinal Rather Than Numerical?
Treat ordinal data as ordinal. A five-point satisfaction item records an order, and nothing more. Whether the distance from “very dissatisfied” to “dissatisfied” equals the distance from “neutral” to “satisfied” is an assumption you make, not something the data prove.
That does not force you into rank tests every time. Treating Likert items as interval data and using a t-test is common in psychology and can be defensible when the design is balanced and the group distributions are symmetric. It is a debatable choice rather than an error, and the defensible move is to state your reasoning.
Rank-based methods become the clearer answer when responses are heavily tied, when group sizes are small, or when the outcome is a genuine ranking with no meaningful intervals. Spearman’s rank correlation handles the ordinal version of association the same way.
Should You Transform the Data or Use a Nonparametric Test?
Try a transformation before you abandon the parametric family, because a transformed analysis often keeps more power and still supports a mean-based interpretation. Match the transform to the shape of the problem: a square root for count-like variance patterns, a log for right skew with a wide range, a reciprocal for severe right skew, and Box-Cox as a data-driven search across candidates.
Two things to hold onto. The result then describes the transformed scale, so “log income differs between groups” is not the same claim as “income differs between groups,” and you must say which one you tested. And a transformation cannot fix a floor effect, where many values sit at zero.
Beyond transformation, three options often serve better than picking a named rank test. Robust standard errors in a mixed model absorb mild non-normality while keeping the model structure. A permutation test reshuffles labels to build the reference distribution directly, so it needs no distributional assumption at all and works for designs like two-way ANOVA. A bootstrap resamples with replacement to build confidence intervals, which handles skewed outcomes and unequal group sizes well when you report an interval rather than a single p-value.
How to Choose and Report the Test in a Research Paper
Run this six-step sequence and you will have a choice you can defend to a supervisor or a reviewer.
- Name the question. Are you comparing typical values, testing an association, or testing whether proportions differ? The question picks the family.
- Record the measurement scale and design. Interval, ordinal, or nominal. Independent, paired, repeated, or clustered.
- Look at the data. Histogram, boxplot, and Q-Q plot per group. Note outliers, floor effects, and spread.
- Test what matters. Shapiro-Wilk or Kolmogorov-Smirnov for normality, Levene’s for variances, only where the visual inspection left doubt.
- Decide against your sample size. Above 15 to 20 observations per group with no extreme outliers, keep the parametric test. Below that with visible skew, switch or transform.
- Report the reasoning, not just the result. Name the assumption you checked, the test you chose, and why it fits.
A methods-section template you can adapt:
“Response times were compared between the two conditions using the Mann-Whitney U test. A Shapiro-Wilk test indicated that the normality assumption was violated (W = 0.86, p < .001) and two influential outliers were present. Group medians were 42 seconds and 61 seconds. The distribution shapes were visually comparable, so the result is interpreted as a difference in typical response times, U = 18, z = -2.94, p = .003, exact p = .004, rank-biserial correlation r = 0.62, 95% CI [0.18, 0.84].”
Include the effect size and the confidence interval. A p-value alone tells a reader that something happened, not how much, and reviewers increasingly ask for both.
Frequently Asked Questions
Are nonparametric tests always less powerful than parametric tests?
No. When the parametric assumptions hold, parametric tests are more powerful because they use the actual values rather than their ranks. When assumptions are badly violated, the picture reverses: an invalid parametric test can lose far more than the rank test gains, because it can produce a wrong answer rather than merely a less sensitive one. The comparison only makes sense at the same sample size and with the same effect.
Does a nonparametric test compare medians automatically?
Not automatically. A Mann-Whitney U test compares the relative ordering of values, which equals a difference in medians only when the two groups share a similar distribution shape and differ mainly in location. If one group is tightly clustered and the other widely spread, the result reflects a general difference in distributions. Report the medians descriptively and describe the test result as one group tending higher.
Do nonparametric tests work when group variances are unequal?
Often, but check before you rely on it. The Mann-Whitney U test behaves acceptably under moderate variance differences, and some simulation work supports it more broadly, yet severe inequality combined with small samples can still distort the Type I error rate. For a two-group comparison, Welch’s t-test handles unequal variances directly and may suit skewed data just as well. For more groups, Welch’s ANOVA is the counterpart.
Can I choose a statistical test based only on sample size?
No. Sample size tells you whether the central limit theorem has made the sampling distribution of your mean roughly normal, nothing more. You also need the measurement scale, the study design, the number of groups, and the shape of the distribution with outliers removed from the picture. A pilot with 12 per group still needs a design check before a t-test is defensible.
Which statistical software can perform nonparametric tests?
All the major packages do. SPSS, R and Stata each include Mann-Whitney U, Wilcoxon signed-rank, Kruskal-Wallis and Friedman under their nonparametric menus, and each also supports exact versions for small samples. R adds the widest range of permutation and bootstrap routines, and tools such as jamovi and JASP give the same tests through a point-and-click interface.
Conclusion: Start With the Research Question and Assumptions
Start with what you measured and how it was collected, then find the assumption that is genuinely broken and judge how much it matters at your sample size. Above 15 to 20 observations per group with no extreme outliers, keep your parametric test even when the data look imperfect. Below that, with ordinal outcomes, heavy skew, influential outliers, or censored values, switch to the rank-based match for your design and say in your methods section exactly why.