To run a Mann Whitney U test in SPSS, go to Analyze > Nonparametric Tests > Legacy Dialogs > 2 Independent Samples, move your outcome variable into Test Variable(s), move your two-group variable into Grouping Variable, click Define Groups and enter 1 and 2, tick Mann-Whitney U under Test Type, then press OK. It takes about ninety seconds once your data is tidy.
The test itself is the nonparametric answer to the independent samples t-test. SPSS ranks every score, compares the average ranks between your two groups, and turns the gap into a U statistic and a p-value. Nothing more clever is happening, which is exactly why it is so easy to run badly.
Here is the short version before the long version:
- Data setup: one numeric outcome variable (continuous or ordinal) and one categorical variable with exactly two groups, coded 1 and 2.
- Menu path: Analyze > Nonparametric Tests > Legacy Dialogs > 2 Independent Samples.
- Output: a Ranks table and a Test Statistics table carrying Mann-Whitney U, Wilcoxon W, Z, and two significance columns.
- Report: medians and interquartile ranges for both groups, U, Z or the exact p-value, and an effect size you calculate yourself.
Table of Contents
- 1What You Need Before You Run the Test
- 2Step-by-Step: How to Run a Mann Whitney U Test in SPSS
- 31. Check the Variables and Group Coding
- 42. Explore the Data and Check the Assumptions
- 53. Open the Mann-Whitney Test Dialog
- 64. Assign the Test Variable and Grouping Variable
- 75. Select Options and Run the Analysis
- 86. Interpret the SPSS Output
- 97. Report the Result in APA Style
- 10How to Run It With SPSS Syntax Instead
- 11Common Mistakes and How to Fix Them
- 12Frequently Asked Questions
- 13Can you run a Mann-Whitney U test in Excel?
- 14What does the Mann-Whitney U value actually mean?
- 15Should I report Exact Sig. or Asymp. Sig.?
- 16Why is my Mann-Whitney test not working in SPSS?
- 17Why do I report medians instead of means?
- 18When should I use a t-test instead of the Mann-Whitney U test?
What You Need Before You Run the Test
The Mann Whitney U test is the right tool when you have two independent groups and an outcome that is ordinal, or continuous but too skewed or too thinly sampled for a t-test. A five-point satisfaction item, a pain score from 0 to 10, a reaction time with a long right tail — all of these suit it. If your outcome is normally distributed and your groups are comfortably sized, the independent samples t-test is more powerful, and reviewers will ask why you gave that up.
You need four things lined up first. An outcome variable measured at least at ordinal level. A grouping variable with two and only two categories. Independent observations, meaning one person or one unit appears in only one group. And a check that the two groups have roughly similar distribution shapes, because SPSS ranks the shapes, not just the centres.
The null hypothesis is that the two populations come from the same distribution, or in plain terms that the two groups score equally. Alternative researchers usually frame this as a difference in central tendency.
On versions, SPSS Statistics 26 and later put a redesigned dialog at Analyze > Nonparametric Tests > Independent Samples with Objective and Fields tabs. That version works fine and some people prefer it. The Legacy Dialogs route is still shipped, still taught, and is what nearly every course handout, YouTube walkthrough and forum answer refers to, so it is the one worth learning first.
Step-by-Step: How to Run a Mann Whitney U Test in SPSS
1. Check the Variables and Group Coding
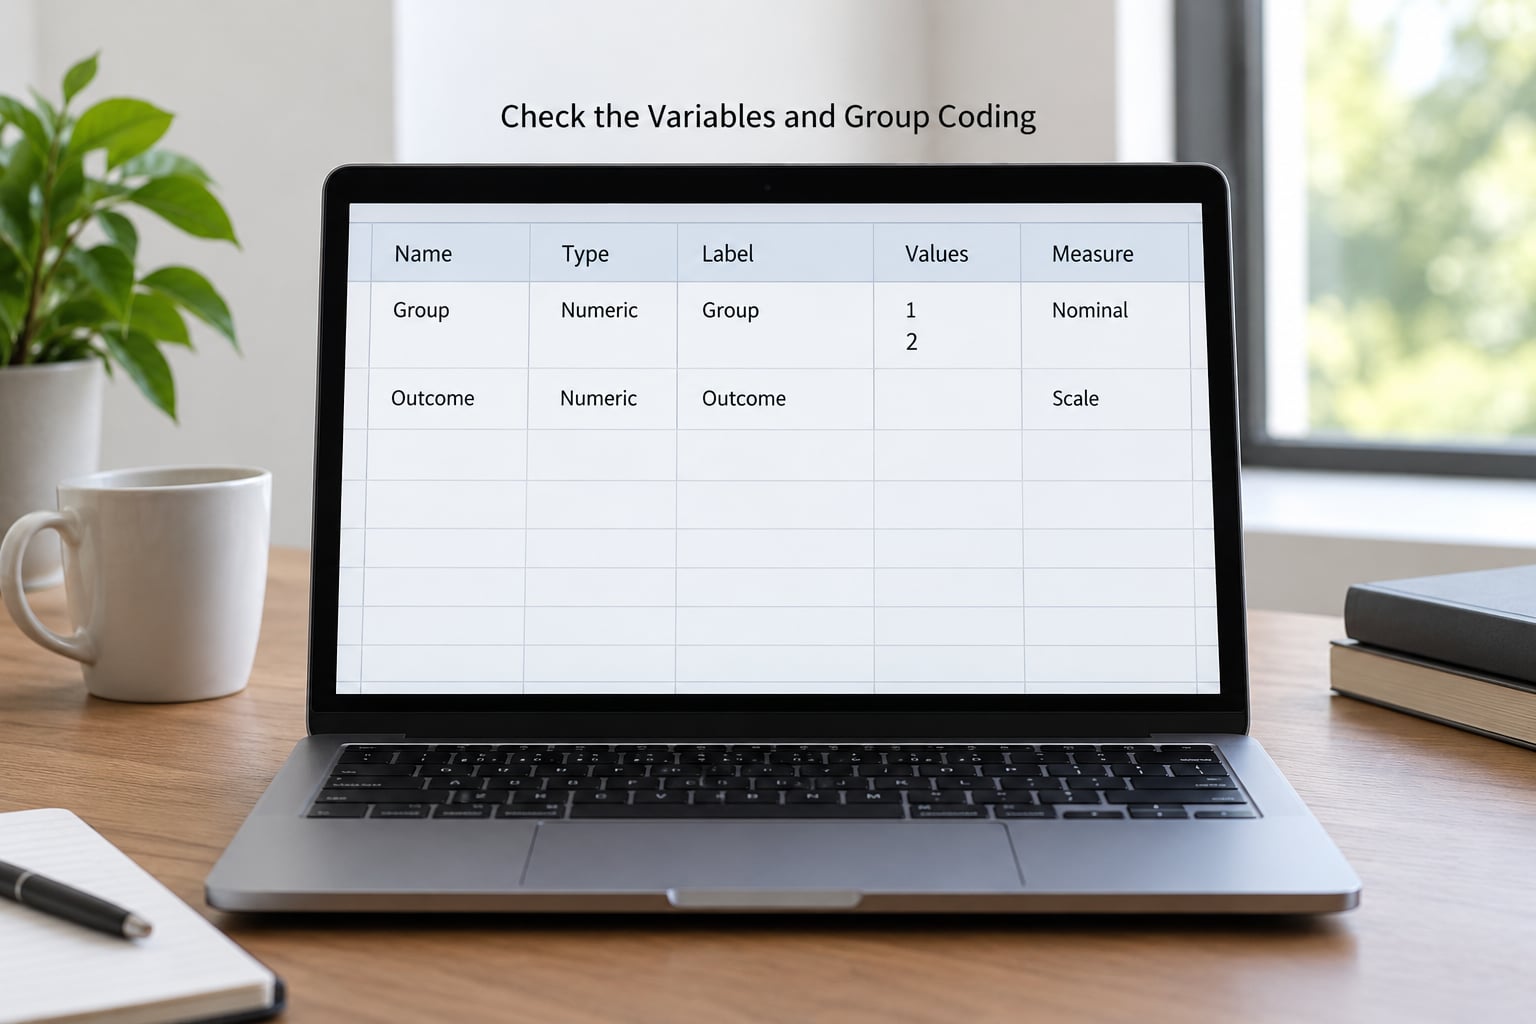
Open Data View and look at the grouping column. It needs exactly two distinct values. If it holds 1, 2 and 3 because you merged three conditions and changed your mind, SPSS will refuse the dialog rather than guess which two you meant.
Give those values readable labels in Variable View. Click the cell in the Values column for the grouping variable, then Add. Label 1 as Control and 2 as Treatment, or whatever your two conditions are actually called. It takes a minute and it stops you from reversing the groups in your write-up.
Then confirm the outcome variable is numeric. Numeric values in the cells, Measure set to Scale for a true continuous measure or Ordinal for a rating item. A variable typed as String cannot be tested at all, and SPSS will not warn you politely — it will simply exclude every case.
Scroll the missing data setting while you are in there. If some respondents skipped the outcome item, leaving it at user-missing excludes those cases only from analyses that use that variable, which is usually what you want.
2. Explore the Data and Check the Assumptions
Run Analyze > Descriptive Statistics > Explore. Put the outcome in Dependent List and the grouping variable in Factor, then click Plots and request a histogram with the option to show the data grouped by the factor. This gives you split histograms, one panel per group, which is the fastest way to see skew, gaps and outliers.
Look for three things. Long tails or a strong ceiling or floor effect, which is your reason for using a rank test. Extreme outliers, one or two values miles away from the rest, which distort ranks badly at small sample sizes. And similar shapes across the two panels. If one group is tightly bunched and the other spreads across the range with a different pattern, the median comparison stops being a clean summary and you need to describe distributions instead.
If your groups are large, normality stops being much of a worry anyway, since the test leans on the central limit theorem. Small groups are where the shape check earns its keep.
3. Open the Mann-Whitney Test Dialog
Go to Analyze > Nonparametric Tests > Legacy Dialogs > 2 Independent Samples. Three areas matter in the window that opens.
The Test Variable(s) list on the left holds your outcomes. The Grouping Variable box takes the categorical splitter. The Test Type box at the bottom holds the tick boxes for Mann-Whitney U, Kolmogorov-Smirnov, and a custom entry field. Everything else on that dialog is greyed out until you fill these in, which is normal.
4. Assign the Test Variable and Grouping Variable
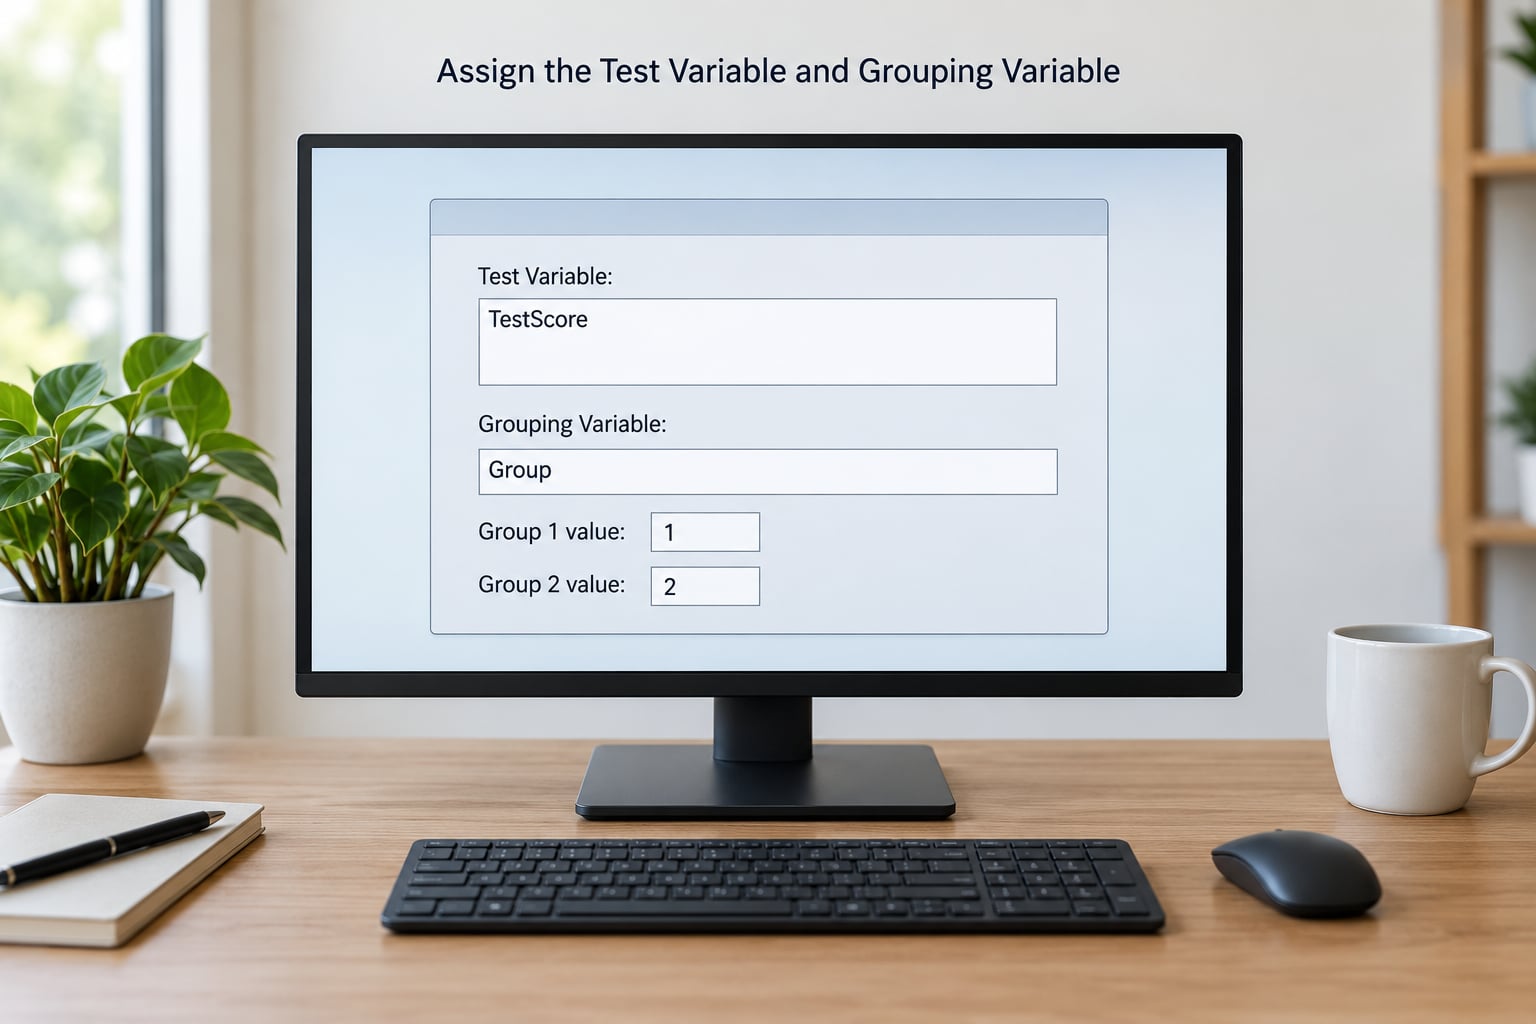
Click your outcome variable, then the arrow button to move it into Test Variable(s). Then click your grouping variable, then the arrow into Grouping Variable. SPSS will usually offer you Group 1 and Group 2 automatically. If it does not, or if you want to be certain, click Define Groups and type the two group numbers in the boxes.
This is where most first runs go wrong. The single most common error is forgetting Define Groups entirely, which leaves SPSS with no way to know where one group ends. The other is typing labels instead of codes: if your variable is coded 1 and 2, you enter 1 and 2, not Control and Treatment.
One useful trick: the split you see in the grouping variable is the split SPSS will use. If that does not match your two conditions, fix the coding before running anything.
5. Select Options and Run the Analysis
Tick Descriptives under Options if you want SPSS to add means and standard deviations to the Ranks table. Be aware those are means of ranks, not of your raw scores. Then click OK. The output appears in the Output Viewer with a Ranks table and a Test Statistics table.
That Ranks table shows the mean rank for each group, which is the heart of the result. What it does not show is a median, and the median is what APA reporting wants. To get medians and interquartile ranges for each group, go to Analyze > Descriptive Statistics > Frequencies, move the outcome into Variable(s), then click Statistics and tick Quartiles, plus Median if you want it spelled out. To split them by group, click Data and set the grouping variable as the By variable. Frequencies > Custom Tables gives you the same numbers in a tidier layout.
Those medians never make it into the test output, so grab them in the same session and write them down.
6. Interpret the SPSS Output
The Ranks table gives you N, the mean rank, and the sum of ranks for each group. A large gap between the two mean ranks, say 24.0 against 34.0, is the difference the U statistic summarises.
The Test Statistics table has five columns that trip up most readers. Mann-Whitney U is the test statistic and the number you report. Wilcoxon W is the same information in the sum-of-ranks form SPSS uses internally; you do not report it. Z is the standardised score used for the normal approximation, and its sign simply tells you which group ranked higher. Asymp. Sig. (2-tailed) is the approximate two-tailed p-value from that Z. Exact Sig. (2-tailed) is a true p-value computed from the exact distribution rather than the normal curve.
Exact Sig. [2*(1-tailed Sig.)] is the same exact p-value, written the long way round. SPSS prints two related exact columns when you have small groups, and they will agree to two or three decimal places.
So which one goes in your paper? This is the single most common source of confusion, and the rule is short.
| Column | Use it when | Report it |
|---|---|---|
| Exact Sig. (2-tailed) | Small groups, roughly 5 to 10 cases per group or fewer, and SPSS offers it | Yes, with the Mann-Whitney U value |
| Exact Sig. [2*(1-tailed Sig.)] | Same situation, this is the identical value in a different format | No, pick the cleaner column |
| Asymp. Sig. (2-tailed) | Larger groups where the normal approximation is reliable, or when exact tests are unavailable on your licence | Yes, alongside Z |
Exact tests are unavailable for very large samples in SPSS, and on some licences exact tests are limited to small samples altogether, so the asymptotic column is not the wrong answer by default. Use it whenever your groups are not tiny.
Interpretation stays modest. A p-value below .05 says the rank distributions of the two groups differ. It does not say which group is better, it does not explain why they differ, and with unequal distribution shapes it does not strictly license the word median either.
7. Report the Result in APA Style
Here is the template:
A Mann-Whitney U test indicated that [outcome] was [higher or lower] in [group A] (Mdn = [x], IQR = [a]-[b]) than in [group B] (Mdn = [y], IQR = [c]-[d]), U = [U], [z or exact p], p = [.000], r = [.xx].
Worked through with real output values: graduate students reported a median stress score of 22.0 with an interquartile range of 18.0 to 27.0, undergraduates reported a median of 18.0 with an interquartile range of 15.0 to 21.0, with 29 and 30 cases in the two groups. SPSS gave Mann-Whitney U = 312.50, Wilcoxon W = 747.50, Z = -2.87, Asymp. Sig. (2-tailed) = .004, and mean ranks of 25.8 and 34.1.
Sentence: A Mann-Whitney U test showed that stress scores were higher for graduate students (Mdn = 22.0, IQR = 18.0-27.0) than for undergraduates (Mdn = 18.0, IQR = 15.0-21.0), U = 312.50, z = -2.87, p = .004, r = .37.
SPSS prints no effect size for this test, which is why so many write-ups stop at p. Calculate it yourself as r = |Z| / square root of N, where N is the total number of cases in both groups combined. Here that is 2.87 divided by the square root of 59, which is 7.68, giving r = 0.37. Benchmarks run 0.10 for a small effect, 0.30 for medium and 0.50 for large, so 0.37 sits in the medium band, which matches how large the median gap looked in practice.
Report p as .004, never p = .000. If the output truly says less than .001, write p < .001.
How to Run It With SPSS Syntax Instead
Once you know what you are doing with the dialog, syntax is faster and easier to reproduce. Open a new syntax window and paste:
NPAR TESTS
  /M-W= stress BY group (1 2)
  /MISSING ANALYSIS.
Swap stress for your outcome and group for your grouping variable, keeping the two codes in brackets. Add /MISSING ANALYSIS to drop cases with blanks, or /MISSING SCOPE=ANALYSIS to drop them only for this procedure rather than the whole session.
The syntax route also handles several outcomes in one run, which saves real time in a survey with a stack of scale items:
NPAR TESTS
  /M-W= stress anxiety sleep BY group (1 2)
  /MISSING ANALYSIS.
For a quick distribution check that pairs with the test, this paneled histogram draws the outcome split by group:
GRAPH /HISTOGRAM= stress
  /PANEL COLVAR= group COLOP=CROSS.
Common Mistakes and How to Fix Them
| Mistake | Why it happens | Fix |
|---|---|---|
| The test will not run | The grouping variable has more than two values, so SPSS has no way to split it | Recode the variable into two groups, then assign the same two codes in Define Groups |
| Output is blank or all cases dropped | The outcome was typed as String, or the grouping codes you entered do not match the data | Check the Measure column in Variable View and re-enter the numeric codes 1 and 2 |
| Used for paired or repeated data | The Mann Whitney U test assumes independent groups | Switch to the Wilcoxon signed-rank test for paired scores or the Wilcoxon run test for ordinal repeated measures |
| Reporting means and standard deviations | The output Ranks table reports mean ranks, which look like means and are not | Report medians and interquartile ranges, generated from Frequencies or Custom Tables |
| Picking the wrong p-value column | SPSS prints two exact columns plus an asymptotic one | Use Exact Sig. (2-tailed) for small groups, Asymp. Sig. (2-tailed) otherwise |
| Reporting U but no effect size | SPSS does not compute one for this test | Calculate r = |Z| / square root of N and report it |
| Many tied values, such as 1 to 5 Likert items | Ties share an average rank and weaken the approximation | Read the asymptotic column with the tie correction SPSS applies, and lean on medians in the write-up |
| Tiny groups, three or four per condition | The normal approximation stops being trustworthy | Read the exact column, report both Ns, and consider a permutation test via the Exact submenu |
| Conclusion written as if the test explains the cause | A rank comparison says distributions differ, nothing more | Phrase findings as an association and discuss causes separately |
Two further habits save time. Check the direction against the Ranks table before you write anything, because a significant p-value with the sign backwards is an easy and embarrassing error. And save your syntax to a file, so re-running after a data correction takes seconds rather than a re-click.
The pattern in most SPSS support threads is consistent: running the test is rarely where people get stuck, writing it up is. Knowing which two numbers out of that Test Statistics table belong in your results paragraph is the part worth practising.
Frequently Asked Questions
Can you run a Mann-Whitney U test in Excel?
Not natively. Excel has no built-in Mann-Whitney U routine, and the old Data Analysis add-in only covers t-tests and a few others. You would have to rank the pooled data yourself in a helper column, sum the ranks per group, and look the result up in a critical value table. SPSS, R, jamovi, JASP and online calculators all produce the U statistic, Z and exact p-value directly, so use one of those instead.
What does the Mann-Whitney U value actually mean?
U is the smaller of the two rank-sum counts that result from comparing every score in one group with every score in the other. Under the null hypothesis it follows a known distribution centred near n1 multiplied by n2 divided by 2. A small U means the groups are separated in the ranks, a large U near that centre means they overlap. Report the U value, but explain the difference in medians in words.
Should I report Exact Sig. or Asymp. Sig.?
Report the exact two-tailed value when your groups are small, roughly 10 cases or fewer per group, because the normal approximation is unreliable there and SPSS computes the true p-value. Report Asymp. Sig. (2-tailed) for larger samples, where the approximation is sound. Ignore Exact Sig. [2*(1-tailed Sig.)], which is the same exact p-value written the long way. Exact tests may be unavailable on some SPSS licences.
Why is my Mann-Whitney test not working in SPSS?
Three causes account for nearly every failure. The grouping variable holds more than two values, so SPSS cannot split it. You forgot to click Define Groups or entered labels such as Control instead of the numeric code 1. Or the outcome variable was typed as String rather than Numeric. Check all three in Variable View before re-running, and look at Frequencies to confirm the codes actually present in the data.
Why do I report medians instead of means?
The Mann-Whitney U test works on ranks, so it describes relative position in the distribution rather than arithmetic average. Means and standard deviations belong to the t-test family and can look misleading on skewed data. Get your medians and interquartile ranges from Frequencies or Custom Tables with the grouping variable set as the By variable, then report those alongside U and the p-value.
When should I use a t-test instead of the Mann-Whitney U test?
Use the independent samples t-test when your outcome is continuous, roughly normal within each group, and the two variances are comparable. It uses the actual magnitudes rather than ranks, so it is more powerful when its assumptions hold. Reach for the Mann-Whitney U test with ordinal outcomes, strongly skewed continuous data, or small groups. If both are defensible, run the t-test first and report it, keeping the rank test as a check.
Start with Variable View: confirm one numeric outcome, one grouping variable with exactly two codes, and clean value labels. Run the test through Analyze > Nonparametric Tests > Legacy Dialogs > 2 Independent Samples, then pull medians and interquartile ranges from Frequencies before you leave the session. Everything else — U, Z, the right significance column and the effect size — falls into place from those two habits.