
The Wilcoxon signed-rank test in SPSS takes about two minutes to run: go to Analyze > Nonparametric Tests > Legacy Dialogs > 2 Related Samples, move your two paired variables into the test pair box, tick Wilcoxon under Test Type, and click OK. The Output Viewer then gives you a Ranks table and a Test Statistics table. Everything else is reading those two tables correctly.
This guide covers the click path, what each row of the output means, and the sentences to write for your results section. It applies to IBM SPSS Statistics 26 through 29, where the legacy dialog is still the most reliable route. The newer Related Samples dialog on the main Nonparametric Tests screen works too, but it takes a couple more clicks and gives you less to interpret in the output.
Table of Contents
- 1What You Need
- 2Step-by-Step: How to Run a Wilcoxon Signed-Rank Test in SPSS
- 31. Prepare and Check Your Paired Data
- 42. Open the Wilcoxon Test Dialog
- 53. Select the Test and Run the Analysis
- 64. Read the SPSS Output
- 75. Report the Result
- 8Common Mistakes
- 9Frequently Asked Questions
- 10When should I use the Wilcoxon signed-rank test in SPSS?
- 11Is the Wilcoxon signed-rank test the same as a paired-samples t-test?
- 12What does the Z value mean in SPSS Wilcoxon output?
- 13Can I run a Wilcoxon signed-rank test when the data are normally distributed?
- 14How do I report a nonsignificant Wilcoxon signed-rank result?
- 15What should I do if my SPSS output shows a very small p value?
- 16Quick Recap and Next Steps
What You Need
You need two numeric variables holding the same cases. Row 1 is participant 1 in both columns, row 2 is participant 2 in both columns, and so on down the file. That alignment is the whole game. If your pre-test and post-test scores are in two separate columns per participant rather than one column per time point, SPSS will not pair them correctly.
You also need the same case count in both variables. SPSS drops any row that is blank in either variable, so a mismatch quietly shrinks your sample and quietly changes your result. Check for missing values before you run anything: Data > Check Variables will list them per column.
Worth checking first is whether a paired t-test would be the better fit. The Wilcoxon test exists for cases where the differences between pairs are badly skewed or the data are ordinal, like Likert items. Many people reach for it by habit and end up reporting a less powerful test on data that were fine for a t-test.
A quick way to see the shape of your differences: Transform > Compute Variable, create PreMinusPost, then run Analyze > Descriptive Statistics > Explore on it and look at the histogram. Symmetric and roughly bell-shaped means the t-test is on the table.
Step-by-Step: How to Run a Wilcoxon Signed-Rank Test in SPSS
1. Prepare and Check Your Paired Data
Open your data file in Data Editor and look at the Variable View tab at the bottom. Both variables should be set to Scale (or Ordinal for Likert blocks). A text variable will not appear in the test pair box, which is the most common reason the dialog looks broken.
Sort your file by ID before pairing, if the rows were entered out of order. SPSS pairs by row position, not by any matching key, so a single out-of-place row silently pairs the wrong participant with the wrong score.
2. Open the Wilcoxon Test Dialog
Click Analyze, hover over Nonparametric Tests, then Legacy Dialogs, and choose 2 Related Samples. The dialog is named for the two related samples it compares, not for the Wilcoxon test, which is why it is hard to find if you search the menus for the test’s own name.
3. Select the Test and Run the Analysis
Put your pre-test variable in the left box marked Test Variable(s) and your post-test variable in the right box marked Pair 1. SPSS orders the pair as first minus second, so the order you choose determines the sign of Z.
Tick the Wilcoxon checkbox under Test Type. Click Options to add descriptive statistics, quartiles, and effect size, and to set a null hypothesis median other than zero if your research question needs it. Then click OK and the output appears in a new Output Viewer window.
4. Read the SPSS Output
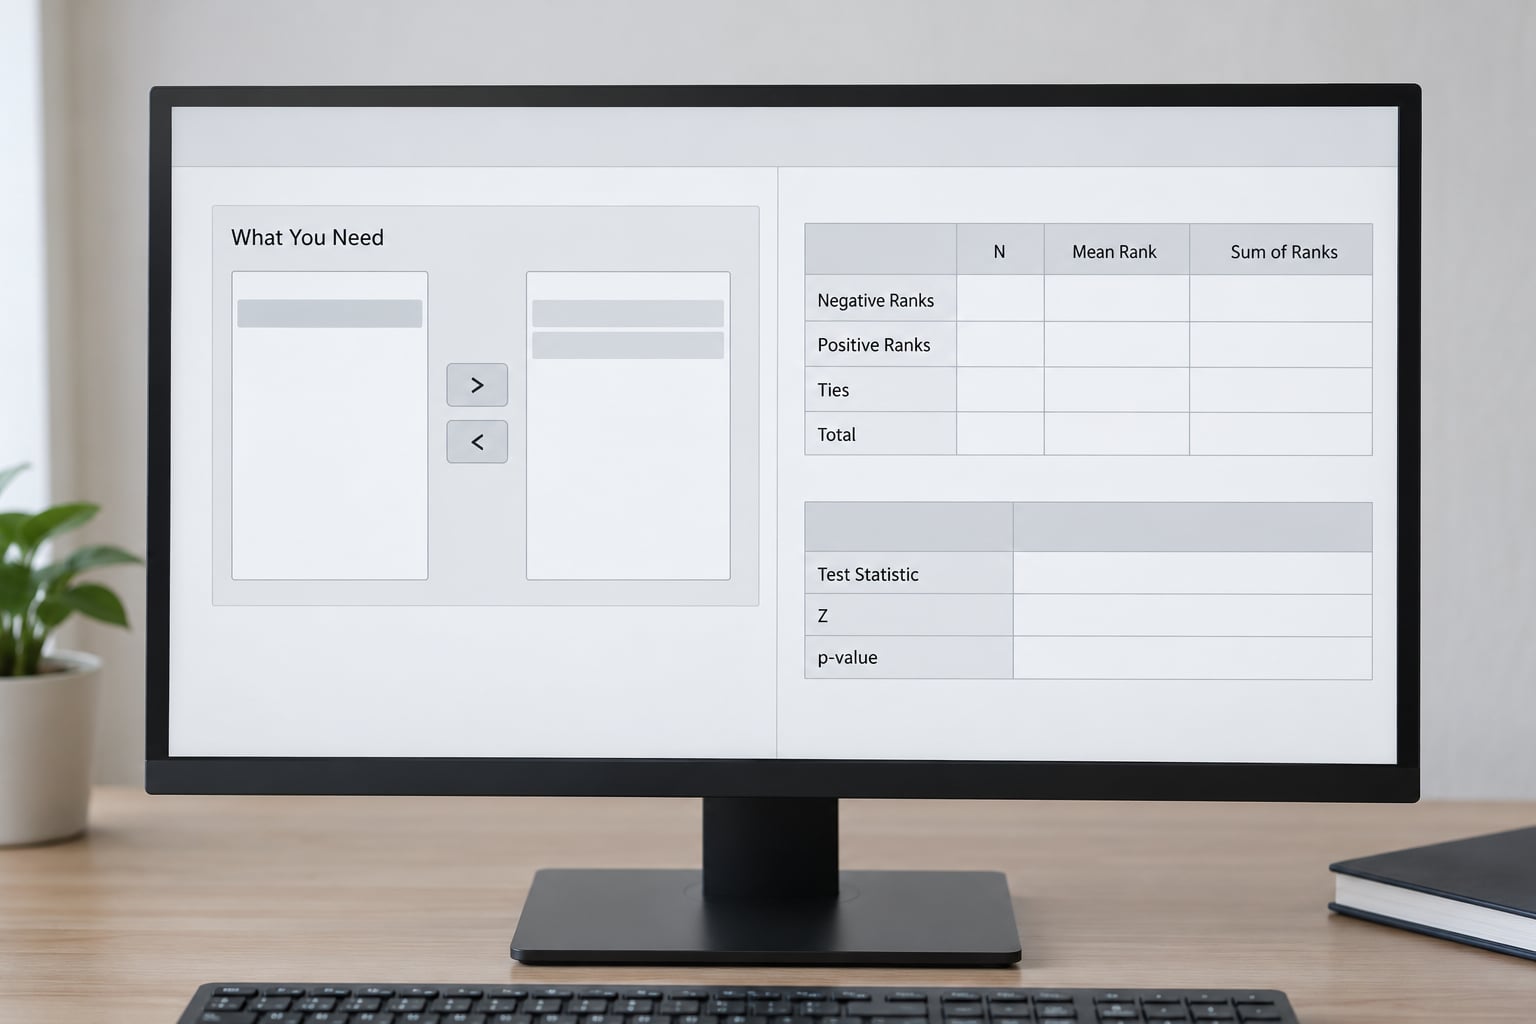
Two tables matter. The Ranks table lists Negative Ranks, Positive Ranks, and Ties, with the count, mean rank, and sum of ranks for each. SPSS differences are calculated as your first variable minus your second, ranks the absolute differences, and assigns low ranks to small gaps and high ranks to large ones. Negative Ranks counts pairs where the first variable scored lower.
The Test Statistics table gives Z and Asymp. Sig. (2-tailed). Z is the standardized version of the sum of ranks that most closely resembles a normal score; because the test statistic is normally scaled, the p-value is called asymptotic. If Asymp. Sig. (2-tailed) is below your alpha level, usually 0.05, you reject the null hypothesis of no median difference.
Z will be negative when the first variable tended to score lower and positive when it tended to score higher, so the sign is your direction. SPSS also silently drops pairs where the two values are identical, so the N in the output can be lower than your file. Lots of ties get averaged, which is why a hand calculation often lands on a slightly different number than SPSS.
Effect size comes from r = Z / sqrt(N). Around 0.1 is a small effect, 0.3 a medium one, 0.5 a large one.
5. Report the Result
For a significant result: A Wilcoxon signed-rank test showed that post-test scores (Md = 42, IQR = 30 to 55) were significantly higher than pre-test scores (Md = 31, IQR = 24 to 41), Z = 3.21, p < .001, r = 0.45.
For a null result, say the test failed to find a difference rather than that the groups were equal: A Wilcoxon signed-rank test found no significant difference between pre-test (Md = 31) and post-test (Md = 33) scores, Z = 0.74, p = .46, r = 0.09.
One-tailed testing needs care. SPSS reports only the two-tailed value. If you set a directional hypothesis before seeing any data, halving that value is defensible, but you must state the directional test in your report. Chopping the p-value in half after the result comes back silent is p-hacking.
Common Mistakes
The most frequent error is running an independent-samples test on paired data. Mann-Whitney U or an independent t-test on two columns of matched scores treats each row as a separate person and throws the pairing away. Reach for it only when your two groups are genuinely different people.
The second is single-column data. One column of scores with no paired partner cannot be tested at all. Split it into two variables by case or use the sign test, which needs only the direction of each difference.
The third is misreading Z as a score on your variable. It is not. It carries no unit and only tells you direction and significance.
The fourth is overstating a result. A significant Wilcoxon test tells you the median difference is not zero. It does not tell you the intervention caused the change, and with small samples it often misses real differences, which is the question raised repeatedly on stats forums about big median gaps turning up as p = .40.
The fifth is picking the test purely because the data are ordinal. Ordinal data with genuinely tied ranks can push SPSS toward the exact distribution rather than the Z approximation, and the p-value will look very different from R’s wilcox.test default. Both are correct; they answer slightly different questions about the tail of the distribution.
Quick reference for choosing the right test:
- Same people measured twice, continuous data, differences not normal: Wilcoxon signed-rank test.
- Same people measured twice, differences normal: paired t-test.
- Same people measured twice, ordinal data: sign test, or Wilcoxon with few ties.
- Two different groups, one measure each: Mann-Whitney U or independent t-test.
- Three or more conditions, same people: Friedman test, then post-hoc Wilcoxon tests.
- Two conditions, outcome is binary: McNemar test.
Frequently Asked Questions
When should I use the Wilcoxon signed-rank test in SPSS?
Use it when you have paired measurements on the same cases, such as pre-test and post-test scores, and the differences between pairs are strongly non-normal or the data are ordinal. The test examines whether the median difference is zero. If your difference scores look roughly bell-shaped, a paired t-test is more powerful and easier to defend, so run both and compare the assumptions before choosing.
Is the Wilcoxon signed-rank test the same as a paired-samples t-test?
No. Both compare two related measurements, but the t-test works on the mean difference and assumes normally distributed differences. The Wilcoxon test works on the ranked absolute differences and assumes symmetry rather than normality, so it is less sensitive to outliers. With a large, clean sample the two usually agree; with small or skewed samples they can point in different directions.
What does the Z value mean in SPSS Wilcoxon output?
Z is the sum of the signed ranks rescaled to a standard normal score. Its sign shows direction: a negative Z means your first variable scored lower than your second. Its size shows how far the result sits from zero, not how many points your participants changed. Use Asymp. Sig. (2-tailed) for the decision and Z / sqrt(N) if you need an effect size r.
Can I run a Wilcoxon signed-rank test when the data are normally distributed?
Yes, the test stays valid when the differences are normal, it simply gives up some power to buy robustness. Running it on normal data is defensible when you planned it as a nonparametric analysis or when ordinal scales prevent a t-test. It is harder to defend as a swap made after the t-test came back non-significant, because reviewers read that as data-dependent test selection.
How do I report a nonsignificant Wilcoxon signed-rank result?
Name the test, the medians, and the statistics, then state that no significant difference was detected. Write: A Wilcoxon signed-rank test found no significant difference between pre-test (Md = 31) and post-test (Md = 33) scores, Z = 0.74, p = .46, r = 0.09. Avoid writing that the scores were equal, since failing to reject the null never proves equivalence.
What should I do if my SPSS output shows a very small p value?
Check it is not a data entry error before celebrating. Look for accidental duplicated rows, a variable pasted into both pair boxes, or rows that were sorted differently in one column, all of which create fake perfect pairings. Then confirm the output lists the N you expect, and report the p value alongside the effect size rather than on its own.
Quick Recap and Next Steps
Start by confirming your rows are aligned and both variables are numeric. Run the test through Legacy Dialogs > 2 Related Samples, read Asymp. Sig. (2-tailed) against your alpha level, and report the medians, Z, p, and r together. If the p value looks too good, sort your data and run it again before you write it up.