
If you have ever run a reliability analysis and stared at a number between 0 and 1 without knowing whether it is good, the short answer is this: Cronbach’s alpha measures how consistently a group of questionnaire items hang together, and 0.70 is the conventional floor for exploratory research rather than a score to aim for. Reading the number properly means checking more than the total, because a single alpha cannot tell you whether your scale has one construct or three, and it cannot tell you whether the scale measures what you claim it measures.
This guide walks through the interpretation ranges, a worked example you can adapt for your own data, the situations where a high alpha is actually bad news, and the exact wording to paste into your methods section. Updated for 2026, it reflects the current reporting expectations in journals and graduate programs rather than the rule-of-thumb tables that circulate without explanation.
Table of Contents
- 1What Cronbach’s Alpha Measures
- 2What alpha does not tell you
- 3How to Interpret Cronbach Alpha Values
- 4Is a Cronbach’s alpha of 0.7 good?
- 5Is a Cronbach’s alpha of 0.6 acceptable?
- 6What does a 0.9 Cronbach’s alpha mean?
- 7Where did the 0.70 and 0.80 cut-offs come from?
- 8How to Calculate Cronbach’s Alpha
- 9What average inter-item correlation should you aim for?
- 10Worked Examples of Cronbach Alpha Results
- 11A six-item scale with alpha 0.823
- 12A 20-item scale with alpha 0.747
- 13A four-item scale with alpha 0.91
- 14A three-item scale with alpha 0.58
- 15A twelve-item scale with alpha 0.97
- 16How to read the output in SPSS, R and Minitab
- 17How to Improve a Low Cronbach Alpha
- 18Check reverse-scored items first
- 19Check wording and item relevance
- 20Test whether the scale is multidimensional
- 21Consider sample size and item spread
- 22Delete items only with a defensible reason
- 23How to Report Cronbach’s Alpha in Your Study
- 24Frequently Asked Questions
- 25What Cronbach’s alpha value is considered acceptable for a research questionnaire?
- 26Is a Cronbach’s alpha of 0.60 acceptable for a student research questionnaire?
- 27Why can Cronbach’s alpha be negative or greater than 1?
- 28Should I calculate Cronbach’s alpha separately for every survey subsection?
- 29What is the difference between Cronbach’s alpha and McDonald’s omega?
- 30Does a high Cronbach’s alpha prove that a scale is valid?
- 31Conclusion
What Cronbach’s Alpha Measures
Cronbach’s alpha, written with the Greek letter alpha, estimates the internal consistency of a multi-item scale. Internal consistency means the items agree with one another, so that adding them together into a single total score makes sense. If people who score high on “I enjoy my job” also tend to score high on “My job keeps me busy,” alpha will be high. If those answers move independently, alpha will be low.
A reliability test, broadly, asks how much a measuring instrument gives the same result under similar conditions. There are several kinds. Internal consistency asks whether items within one instrument agree. Stability over time, called test-retest reliability, asks whether the same instrument gives similar scores weeks apart. Agreement between raters asks whether two judges code the same answer the same way. Cronbach’s alpha answers the first of those three only.
That distinction matters more than most students expect. Clinicians posting on research forums about internal consistency versus test-retest stability run into exactly this problem: a scale can be internally consistent today and still change when the sample, setting, or wording changes. Alpha is silent about all of that.
Reliability is also not validity. Reliability asks whether the instrument is consistent; validity asks whether it measures the construct you claim. An alpha of 0.95 tells you nothing about construct validity, because a set of items can agree perfectly on the wrong thing. Alpha is best thought of as a necessary but weak condition for validity, not a substitute for evidence of validity.
What alpha does not tell you
- It does not measure validity, or whether your scale captures the full concept.
- It does not prove the scale is unidimensional. A high value can result from items measuring several related but distinct subtopics.
- It does not measure stability across time or equivalence across groups.
- It does not justify averaging items into one score on its own. Average inter-item correlation matters too.
How to Interpret Cronbach Alpha Values
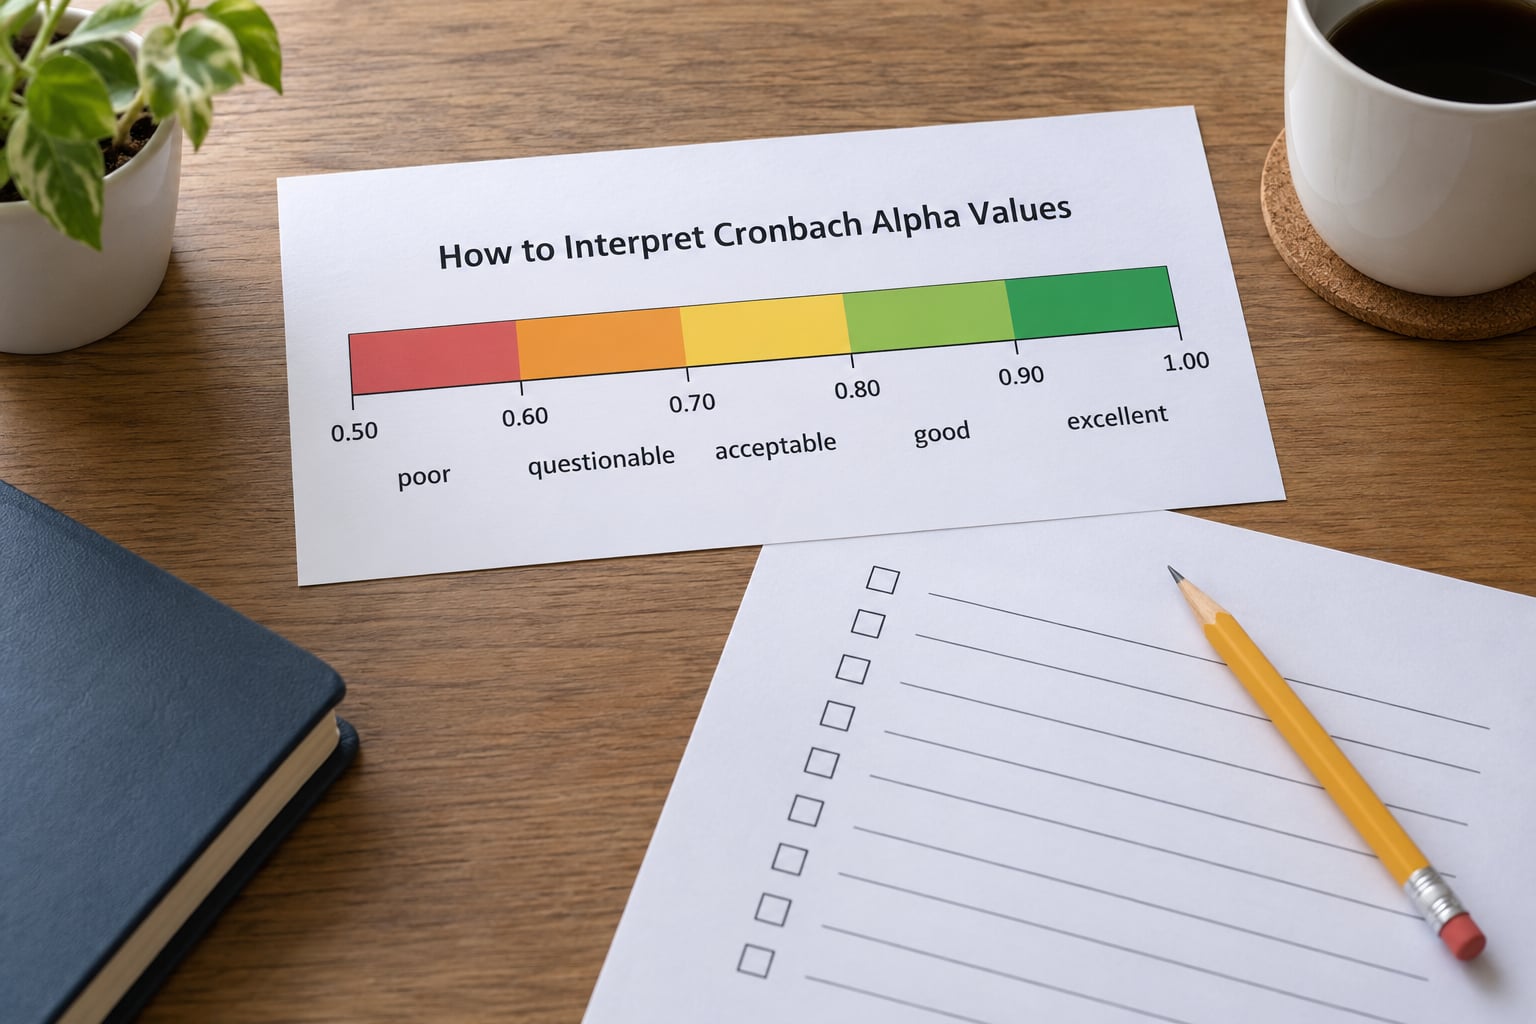
Cronbach’s alpha values are interpreted against a set of conventional ranges. Read the row that matches your number, then read the right-hand column to see whether that value is appropriate for the kind of study you are running.
| Cronbach’s alpha | Reliability label | When it is acceptable |
|---|---|---|
| 0.90 and above | Excellent | High-stakes instruments, individual diagnosis, confirmatory research; check for redundant items first |
| 0.80 to 0.89 | Good | Most applied research, published instrument validation, comparative group studies |
| 0.70 to 0.79 | Acceptable | Exploratory research, pilot studies, thesis questionnaires not yet validated |
| 0.60 to 0.69 | Questionable | Report with caution and an explicit justification; revise before wider use |
| 0.50 to 0.59 | Poor | Usually signals a scale problem rather than a sample-size problem |
| Below 0.50 | Unacceptable | The items are not measuring one shared construct as written |
Is a Cronbach’s alpha of 0.7 good?
It is acceptable, not good. Most methodological literature treats 0.70 as the minimum for exploratory research and 0.80 as the expected value for a validated instrument used in applied work. A scale sitting exactly at 0.70 tells a reader that the items agree just enough to combine, and that the instrument has not been shown to be dependable enough for individual-level decisions. Aim higher if the design allows it, but report it honestly if you cannot.
Is a Cronbach’s alpha of 0.6 acceptable?
Sometimes, with conditions. For a student pilot study with a small exploratory sample, 0.60 can be reported as long as you describe the scale as newly developed, note the value, and treat the findings as preliminary. For confirmatory work, clinical scoring, or anything where individual decisions follow from the score, 0.60 is not acceptable. Fix the instrument or use a validated alternative rather than defending the number.
What does a 0.9 Cronbach’s alpha mean?
It means the items are highly redundant with each other and the total score has little measurement error. That sounds ideal, but alpha rises mechanically as you add items, so researchers sometimes inflate it by piling on near-duplicate questions. Read 0.90 as a prompt to check the item pool, not as a trophy. Above roughly 0.95, near-identical items are the usual explanation and the construct definition has probably narrowed too much.
Where did the 0.70 and 0.80 cut-offs come from?
They are conventions, not theoretical thresholds. The descriptor labels trace back to educational measurement literature from the mid-twentieth century and have been repeated ever since, which is why researchers on statistical forums keep asking about their origin. Nothing in the derivation of alpha produces a natural break at 0.70. Treat the cut-offs as shared professional shorthand that lets readers communicate quickly, and justify any deviation from them by describing your study’s purpose.
How to Calculate Cronbach’s Alpha
Cronbach’s alpha compares how much variance the individual items produce with how much variance the combined total produces. Written out in words: alpha equals the number of items divided by one plus the sum of the item variances, all divided by the variance of the total score. When items correlate well, the total’s variance shrinks relative to the sum of the parts and alpha climbs. When items barely correlate, the total’s variance stays large and alpha falls.
Two consequences follow directly from that formula, and both explain results students find puzzling. First, alpha depends on the number of items. Adding items that are even moderately related will raise alpha almost regardless of their quality, which is why a 20-item scale often scores higher than a 6-item scale measuring the same thing. Second, alpha depends on the average inter-item correlation. A scale with 0.90 alpha on four items implies very strong agreement among those four; the same 0.90 on 30 items implies much weaker agreement per item pair.
The standard output also includes an alpha based on standardized items. Alpha’s raw calculation uses each item’s own variance, so items measured on different scales distort the result. The standardized version first converts every item to a mean of 0 and variance of 1, so alpha reflects correlations alone. If the two values differ noticeably, your items are on different scales or have very different spreads, and you should check your response options.
Alpha can also come out near zero or negative. A negative value means the items are, on net, pulling in opposite directions or are essentially unrelated, which points to a miscoded dataset or a scale that does not hang together. It is a data problem to investigate, not a result to report without comment.
What average inter-item correlation should you aim for?
For a scale meant to produce one total, an average inter-item correlation somewhere around 0.30 to 0.50 is usually healthy. Below 0.20 the items share little and alpha will struggle to reach 0.70 no matter how many you add. Above 0.60, items are so closely redundant that the scale may not be measuring a broad construct at all.
Worked Examples of Cronbach Alpha Results
Reading a number only makes sense alongside the design behind it. The examples below use a common setup: a five-point Likert questionnaire administered to 120 respondents.
A six-item scale with alpha 0.823
You administer six Likert items about job satisfaction to 120 respondents and SPSS returns an alpha of 0.823, with alpha based on standardized items of 0.831. This sits in the good range and is comfortably reportable. The sentence a researcher would write: “Internal consistency for the six-item job satisfaction scale was acceptable, with a Cronbach’s alpha of 0.82.” Here alpha is treated as a number, not as a claim about validity, and no items were removed.
A 20-item scale with alpha 0.747
Here alpha is in the acceptable band for exploratory research, but the item statistics tell a more complicated story. Several corrected item-total correlations sit below 0.30, and deleting any single item lifts alpha to only 0.79. A 20-item scale at 0.747 implies weak average inter-item correlation, which points at items worded differently or measuring distinct subtopics. Reporting 0.75 with a note about dimensionality is more honest than deleting items until the number climbs.
A four-item scale with alpha 0.91
On paper this looks excellent. In practice, four items averaging an inter-item correlation near 0.70 is extremely narrow, and you should check whether they are near-duplicates. This is the case that most often turns out to be a design flaw rather than a strength, particularly when the scale is presented as covering a broad construct.
A three-item scale with alpha 0.58
With only three items, alpha is heavily constrained. Low values often reflect weak wording or items that measure different aspects rather than a fatal flaw in the data. Check reverse-scored items first, since a missed reverse code inverts one item and drags the whole coefficient down. If the items are genuinely measuring different things, report separate alphas for the separate subscales rather than forcing a single total.
A twelve-item scale with alpha 0.97
Values this high on twelve items usually mean redundancy. Alpha cannot exceed 1, and pushing toward that ceiling restricts the variance in the total and slows the detection of relationships with other variables. Treat it as a reason to review the item pool, not as evidence of a superior instrument.
How to read the output in SPSS, R and Minitab

The three main tools report the same quantities with different labels. Knowing what each field means saves a lot of confusion.
| Output field | What it means |
|---|---|
| Cronbach’s Alpha | The overall internal consistency of the scale using each item’s own variance |
| Cronbach’s Alpha Based on Standardized Items | The same coefficient after every item is rescaled to unit variance; use it when response formats differ |
| Corrected item-total correlation | How strongly each item correlates with the total of the remaining items; values below 0.30 are a flag |
| Alpha if item deleted | The coefficient the whole scale would have without that item |
| Variance and covariance (R psych) or summary table (R) | The variance of each item and of the total score that alpha is computed from |
| Squared multiple correlation | How well each item is predicted by the other items, useful for spotting narrow overlap |
A consistent pattern matters more than any single cell. If the total alpha is high but one item’s corrected item-total correlation is below 0.20, that item is probably worded in a way respondents read differently from the rest, and deleting it will inflate alpha without improving the instrument.
How to Improve a Low Cronbach Alpha
Low alpha is a diagnostic signal about the instrument, not a verdict on your study. Work through the checks in this order, because the earlier steps catch the most common causes and the later ones carry real risks.
Check reverse-scored items first
A miscoded reverse item is the single most frequent cause of an unexpectedly low coefficient. Confirm that every negative-worded item was recoded in the dataset, not just in the questionnaire design, and that the recoding direction was right. This is quick to verify and it changes the number immediately.
Check wording and item relevance
Read each item aloud and ask whether a respondent would interpret it the way you intended. Items that are ambiguous, double-barrelled, or phrased at a different level of specificity than the rest of the scale will not correlate strongly with the total. If an item is vague enough that it could apply to several constructs, that ambiguity will show up as a low item-total correlation.
Test whether the scale is multidimensional
If items cluster into distinct groups, one alpha is the wrong statistic. Run a factor analysis or check subscale alphas separately and report reliability for each dimension. Researchers often discover that a scale scoring 0.66 overall returns 0.81 and 0.79 for its two components, which is a far more useful result than a single mediocre number.
Consider sample size and item spread
Small samples produce unstable estimates, and items with little variation contribute almost nothing to a reliable total. If most respondents picked the same answer on an item, that item carries no usable information. Look at the standard deviation for each item and consider whether the response scale is too coarse for the population you sampled.
Delete items only with a defensible reason
Deleting an item is legitimate when it measures a different construct, is confusingly worded, or duplicates another item poorly. It is not legitimate simply because removal raises alpha. Repeatedly dropping items to chase a target number damages content validity, and reviewers familiar with the practice will notice a scale that shrunk from 20 items to 8 across two drafts. Decide on deletion based on item content and corrected item-total correlations, then report what you did.
If the instrument is genuinely sound and alpha remains low, report it with context and treat the analysis as preliminary. A noted limitation is a stronger position in a thesis or peer review than an unexplained deletion.
How to Report Cronbach’s Alpha in Your Study
Report the number, the number of items, the response format, the sample used, and any decisions you made about items. The APA-style convention is to give the value to two decimal places and name the scale:
“Internal consistency for the six-item job satisfaction scale was good, with a Cronbach’s alpha of 0.82.”
For a scale with multiple dimensions, give one value per subscale rather than one overall figure. If you removed items, say which ones and why. If alpha was computed on standardized items, say so. For a single-indicator scale or an ordinal outcome with two categories, alpha is the wrong statistic and KR-20 is usually more appropriate.
One last point on framing. Alpha is conventionally reported as a reliability statistic, and reviewers expect to see it before any validity claim. Presenting it as a measure of whether your scale works is what leads to confusion in review; presenting it as one piece of evidence about item agreement leaves room for the other evidence you should be collecting anyway.
Frequently Asked Questions
What Cronbach’s alpha value is considered acceptable for a research questionnaire?
An alpha of 0.70 or above is the conventional minimum for exploratory research, and 0.80 or above is expected for a validated instrument used in applied work. Values of 0.90 and above indicate excellent internal consistency but often mean items are redundant. The cut-offs are conventions rather than theoretical thresholds, so always report the value with the number of items and the purpose of your study.
Is a Cronbach’s alpha of 0.60 acceptable for a student research questionnaire?
It can be, if the study is exploratory and you report it honestly. Describe the scale as newly developed, state that internal consistency was low, and treat the findings as preliminary rather than confirmatory. For clinical scoring or individual-level decisions, 0.60 is not acceptable, and the instrument should be revised or replaced with a validated alternative.
Why can Cronbach’s alpha be negative or greater than 1?
Alpha exceeding 1 usually results from a calculation or coding error, such as negative item variances entering the formula, or from data with very low variability. A negative value means the items are essentially unrelated or pull in opposite directions, which points to a miscoded dataset or a scale that does not hang together. Investigate the data before reporting either result.
Should I calculate Cronbach’s alpha separately for every survey subsection?
Only where the subsections are meant to be scored separately. If a subscale produces its own score, it needs its own coefficient, and one overall alpha can hide a poorly performing section. If the items form a single unidimensional scale, one coefficient for the whole scale is correct. Running alpha on arbitrary page breaks in a questionnaire produces numbers that mean nothing.
What is the difference between Cronbach’s alpha and McDonald’s omega?
Alpha estimates internal consistency under an assumption that items are equally weighted, effectively treating the scale as a single unidimensional measure. Omega estimates reliability more generally and tends to produce higher values, especially when items load on several related dimensions. For congeneric scales where loadings differ, omega is often the better estimate of reliability.
Does a high Cronbach’s alpha prove that a scale is valid?
No. Alpha measures how much items agree with one another, nothing more. A set of items can agree perfectly on the wrong thing, and a high alpha does not show that the scale is unidimensional or that it captures the full construct. Validity requires separate evidence, such as factor analysis, convergent and discriminant comparisons, and a clear theoretical argument.
Conclusion
Start by reading the total alpha against the table above, then look at corrected item-total correlations and the alpha-if-item-deleted column before deciding anything. Check reverse coding, item wording, and dimensionality, because those explain most disappointing results. Report the number with your item count and response format, and treat anything above 0.95 as a prompt to review the item pool rather than a sign of a finished instrument.