
Presenting qualitative findings comes down to three moves: organise your codes into a small set of named themes, define each theme in prose, then support every theme with two to four participant quotes and your own interpretation of what they show. Done well, your results section reads as an argument rather than a transcript dump, and an examiner can see at a glance which evidence belongs to which claim.
This guide works for a master’s dissertation, a journal article, a UX readout for a product team, or an evaluation report for a funder. It also works if your analysis is still in progress, which is where most people get stuck.
One term first, because it comes up constantly in search results. A thematic presentation is the results section of a qualitative study in which each theme is written up under its own heading, defined in prose, evidenced with verbatim participant quotes, and then interpreted by the researcher. Everything below builds on that pattern.
Table of Contents
- 1What You Need
- 2How to Present Qualitative Findings With Themes and Quotes, Step by Step
- 3Step 1: Review Your Research Question and Completed Analysis
- 4Step 2: Organize Codes Into Themes
- 5Step 3: Define Each Theme Clearly
- 6Step 4: Select Strong Supporting Extracts
- 7Step 5: Edit and Integrate Quotes Into the Narrative
- 8Step 6: Present Supporting and Contradicting Evidence
- 9Step 7: Write the Findings Section Theme by Theme
- 10Common Mistakes
- 11Frequently Asked Questions
- 12What is a thematic presentation?
- 13What is a thematic analysis table?
- 14How many quotes should I use per theme?
- 15What are the 5 methods to analyze qualitative data?
- 16Can ChatGPT do a thematic analysis?
- 17Should findings and discussion be separated in qualitative research?
- 18Conclusion
What You Need
Before you open a blank document, gather six things. Missing any one of them shows up later as a vague paragraph you have to rewrite twice.
- Your research question and sub-questions. These decide which themes belong in the findings section and which are background.
- Your coding framework or your completed coding. Either a codebook with definitions, or the finished list of codes from your analysis software.
- Your transcripts, fieldnotes and memos. You need the raw source text, because quotes come from here rather than from a summary someone wrote for you.
- Participant context. Pseudonyms, relevant background, data collection setting, and how long each interview ran. A quote about a broken appointment means more when the reader knows the participant was new to the service.
- An approved anonymisation method. Decide before you quote, not after. Removing a name is not enough if the combination of employer, job title and city identifies the person.
- Your output format. A dissertation chapter, a 4,000-word journal article and a conference poster carry different numbers of quotes and different visuals. Fixing this early stops you writing a thesis chapter and then squeezing it into a poster at midnight.
How to Present Qualitative Findings With Themes and Quotes, Step by Step
Seven steps. Most people finish step two and stop, then wonder why the codebook will not turn into an essay.
Step 1: Review Your Research Question and Completed Analysis
Reread the research question and check that your analysis actually answers it. Themes that do not speak to the question belong in a later section or in an appendix, not in your findings.
Write the question at the top of a blank page and beside it list your candidate themes. Anything you cannot tie back to the question gets cut or moved. If your study had inclusion criteria, check your sample against them here rather than leaving it for the limitations paragraph, where it reads as an excuse.
Step 2: Organize Codes Into Themes
Turn your code list into a hierarchy of main themes and sub-themes. Codes that appear together, or that answer the same question about the data, become sub-themes under one main theme.
The test for whether something is a theme rather than a topic is simple. A topic is a subject area, like “communication”. A theme is a claim about that subject, like “staff withheld information to protect colleagues”. If your headings could be printed on a table of contents for the whole field, they are topics.
Then choose your theme order. Three orders work, and mixing them looks careless. Order by significance, putting your strongest theme first. Order by research question sequence, so the findings mirror the study design. Order chronologically or by process stage, which suits case study and process tracing work. Whatever you pick, say so in one sentence before the first theme so the reader can follow your logic.
Step 3: Define Each Theme Clearly
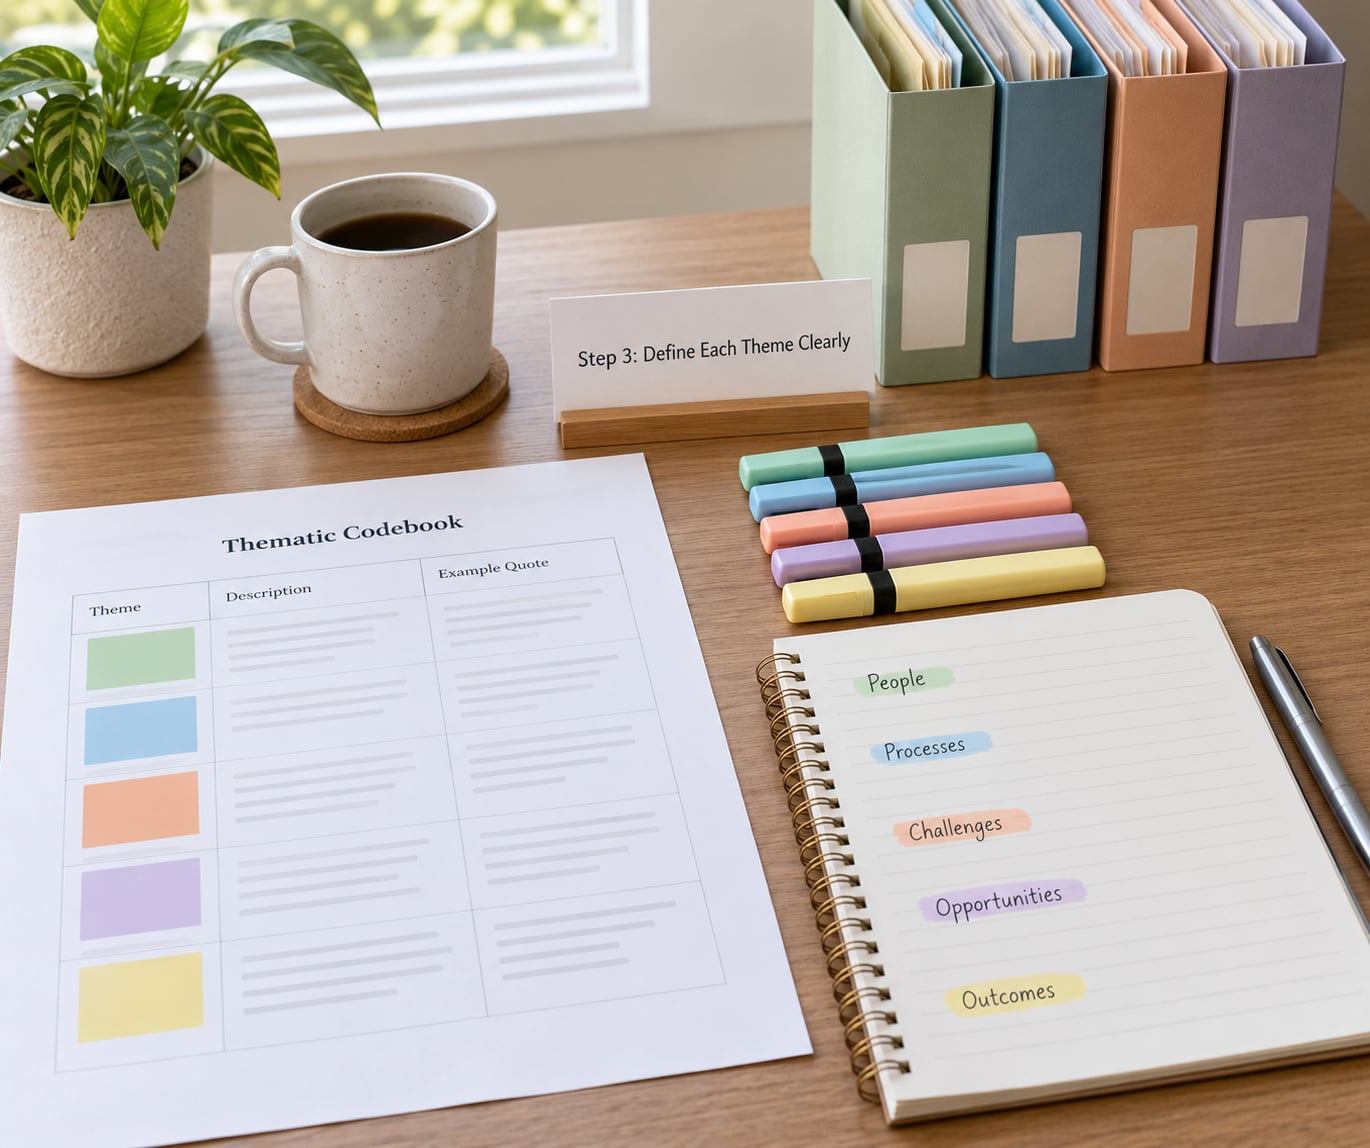
Give each theme a label of a few words and follow it with two or three sentences saying what the theme covers, where it sits in your argument, and why it matters for the research question.
Run the label against four checks. Is it clear to someone outside your project? Is it short enough to use as a heading? Does it capture the essence rather than one example? Is it the same label every time you mention it, including inside other themes and in your abstract? Supervisors reject vague, overlapping and inconsistent labels more often than anything else.
Vague labels look like “Management issues” or “Things participants liked”. They say nothing, and each heading paragraph then has to invent meaning from scratch. Stronger labels look like “Supervisory oversight shaped what got reported”, which already tells the reader what the theme argues.
Step 4: Select Strong Supporting Extracts
Two to four quotes per theme is the useful range. Fewer than two and a theme rests on your word alone; more than four and you have written a quote dump that buries the argument.
Pick extracts that do different jobs. Include at least one that is typical of most participants, one that captures a nuance a summary would flatten, and one that shows a disagreement or a boundary case. Avoid choosing only the vivid or quotable lines, because a findings section built on the best lines reads as advocacy.
A negative case is an account that runs against the pattern you have described. Disconfirming evidence is one of the cheapest credibility moves available to you, and a reviewer who sees none will assume you looked only for agreement.
Keep enough context for the quote to make sense on its own. If the participant is describing a specific event, say what it was. If you cut two sentences out of a long answer, the reader cannot see the qualification you are about to interpret, and your interpretation looks unsupported.
Step 5: Edit and Integrate Quotes Into the Narrative
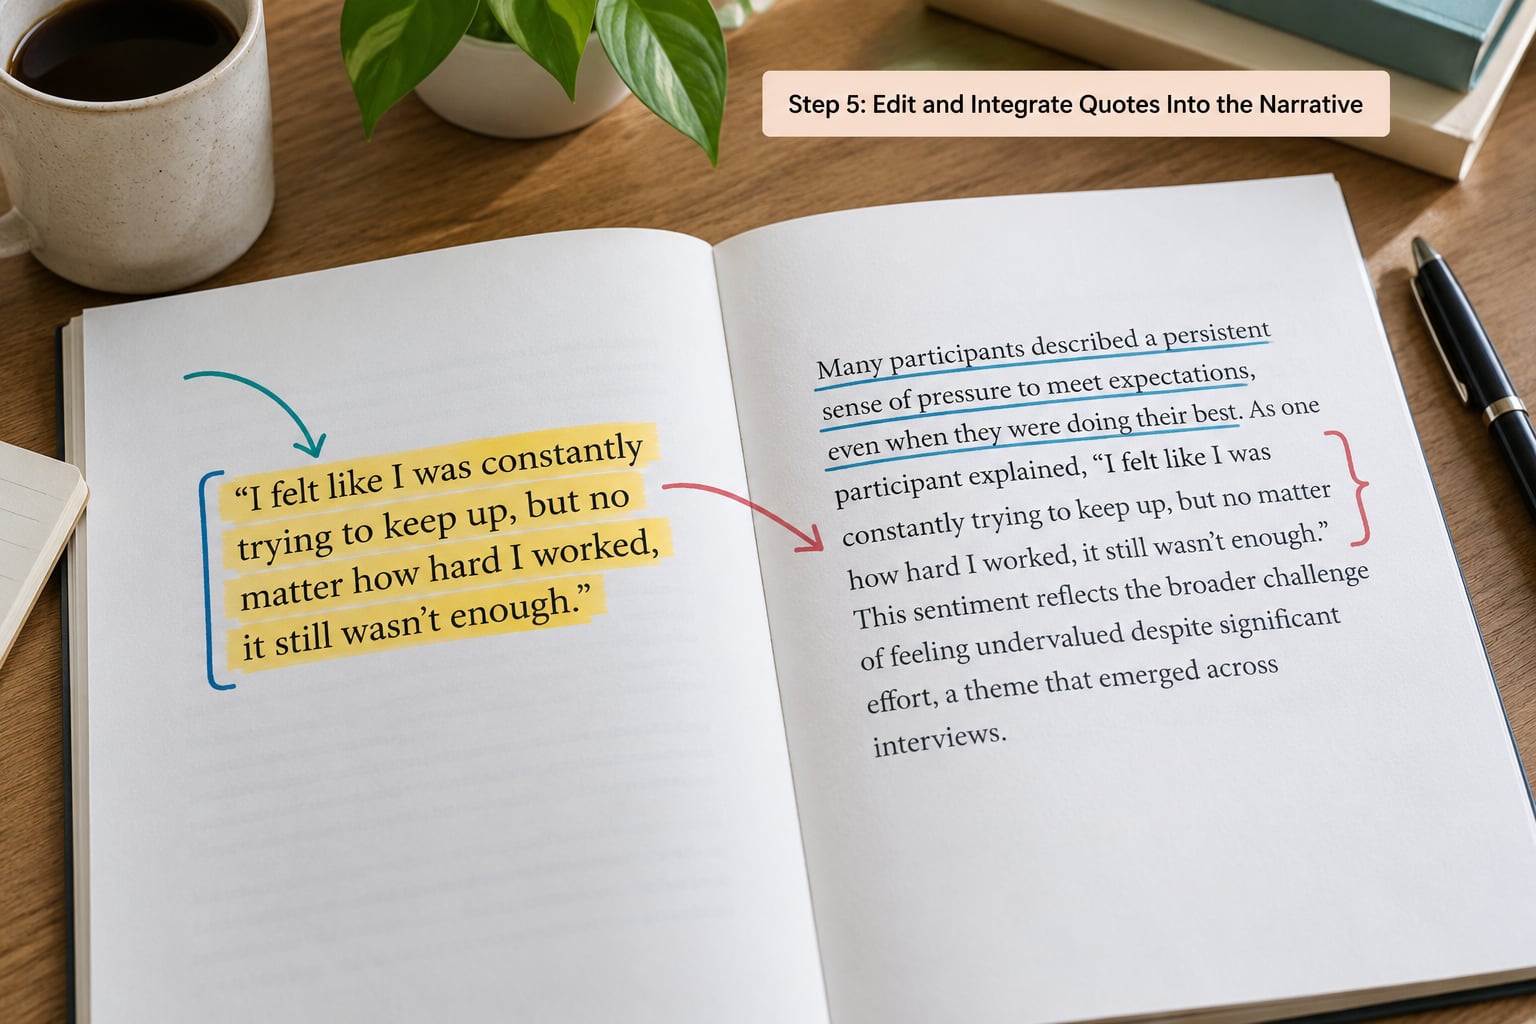
Shorten quotes without changing their meaning. Use an ellipsis where you remove material from the middle, and square brackets where you add a word for clarity, as in “I had to wait [for twenty minutes] before anyone answered”.
Follow the citation convention your discipline uses. In APA style, participant data is usually cited in text with a pseudonym and a locator, for example (P4, p. 12) or (Participant 4, para. 8) for transcripts. Reserve block quotations for extracts longer than about three lines of your text; anything shorter runs inline in quotation marks.
One warning about editing: tidying a participant’s grammar into your own polished sentence changes the voice and can change the meaning. Quote what was said, and let the analysis do the tidying. Patching a quote together from two different places so it reads more neatly is a research integrity failure, not a style choice.
Step 6: Present Supporting and Contradicting Evidence
For every theme, ask what would count against it and then go looking. Interviews and fieldnotes are full of material that does not fit, and that material is where the credibility of your analysis lives.
Report it in the same breath as the supporting evidence, not in a separate defensive paragraph at the end. A theme read like this says the pattern holds across most accounts, that two participants framed the same event differently, and that the difference appears to relate to length of exposure.
Step 7: Write the Findings Section Theme by Theme
Build every theme paragraph the same way: setup, quote, comment. The setup states the pattern the theme describes. The quote supplies the evidence. The comment interprets what the quote shows and how it answers the research question.
Here is the shape of one finished paragraph. Setup: Three of the eight participants had moved an appointment to a phone call rather than raise it in person with the practice manager. Quote: “I knew I’d get told off, so I just rang and said it was a general query” (P4, p. 12). Comment: Phone contact let the participant raise a sensitive administrative issue while keeping the interaction outside the formal record. That pattern suggests the channel, not the complaint, was what the participant was managing.
Thematic analysis tables and other visual displays support this structure rather than replacing it. A summary table with columns for theme, definition, supporting extracts and location in the data gives an examiner a map of the whole section on one page.
Common Mistakes
Seven problems show up in almost every draft I see, and each has a direct fix.
- Quote dumping. Blocks of quotes with no analysis between them. Fix: apply setup, quote, comment to every paragraph, and if a quote has no comment, you do not need the quote.
- Standing quotes. A participant quote that makes a claim the researcher never takes up. Fix: after each quote, write one sentence beginning with what the quote shows. If you cannot, either delete the quote or strengthen your interpretation.
- Vague theme labels. Headings like “Attitudes” or “Challenges”. Fix: rewrite each label as a claim, then check it against the four checks in step three.
- Inconsistent labels. The same theme called “Trust” in one section and “Reliability” in the next. Fix: fix one label and search the document for variants.
- Over-reading a single line. One vivid quotation treated as if it represents the whole sample. Fix: state how many accounts support the pattern and where the evidence is thin.
- Percentages and significance tests. Converting a small qualitative sample into percentage claims. Fix: report raw counts. Eleven of fourteen interviews is clearer and more honest than 79 percent, and percentages imply a sampling frame the study does not have.
- No negative cases. Only data that supports the theme appears. Fix: for each theme, note at least one account that complicates it, or record that you found none.
Two smaller habits worth keeping: check your draft against the COREQ checklist for interviews and focus groups, or SRQR for mixed methods, before you submit. And if you used AI tools to help organise or summarise material, treat every output as a draft to verify against the transcript. Generated or machine-cleaned participant quotes do not belong in a findings section at all, since they are no longer verbatim.
Related analysis methods come up when supervisors ask why you chose this one. Five are common: thematic analysis, grounded theory, framework analysis, content analysis and narrative analysis. Thematic analysis suits work organised around shared meanings across a sample. Grounded theory is built to generate theory from the data and has its own sampling logic. Framework analysis applies an existing framework to data that is then compared case by case. Content analysis counts occurrences systematically. Narrative analysis treats the story itself as the object of study. Pick one, name it in your methods section, and let its conventions drive the presentation.
Frequently Asked Questions
What is a thematic presentation?
A thematic presentation is the results section of a qualitative study in which each theme is written under its own heading, defined in prose, supported with participant quotes, and then interpreted by the researcher. The structure repeats per theme: a definition paragraph, evidence in the form of two to four extracts, and commentary that explains what the evidence shows in relation to the research question.
What is a thematic analysis table?
A thematic analysis table is a summary display that lists each theme with its definition, the sub-themes beneath it, the codes or extracts that support it, and where in the data that evidence sits. Researchers usually place one in the findings section so a reader can see the whole structure of the analysis on a single page before reading the theme-by-theme narrative.
How many quotes should I use per theme?
Two to four quotes per theme is the working range. One quote leaves a theme resting on your interpretation alone, and more than four turns the section into a transcript excerpt. Choose extracts with different jobs: one typical account, one that adds nuance, and where relevant one negative case. Across a whole findings section, the count is usually in the low twenties for a dissertation chapter.
What are the 5 methods to analyze qualitative data?
Five widely used methods are thematic analysis, grounded theory, framework analysis, content analysis and narrative analysis. Thematic analysis organises data around shared meanings. Grounded theory generates theory from the data. Framework analysis compares cases against an existing framework. Content analysis counts units systematically. Narrative analysis studies how accounts are structured as stories.
Can ChatGPT do a thematic analysis?
It can help in limited ways: organising a code list, suggesting candidate groupings, and checking whether your theme descriptions overlap. It cannot substitute for the interpretive decisions that make the analysis yours, and it cannot produce verbatim quotes from your transcripts without risking invention. Always verify any output against the source text before it goes anywhere near your findings section.
Should findings and discussion be separated in qualitative research?
There is no single correct answer, and both arrangements are accepted. Many theses keep them apart: the findings section presents themes and evidence, and the discussion interprets what they mean in relation to literature. Others integrate them, which suits shorter papers and practitioner reports where every claim needs immediate context. Check your programme’s guidance and stay consistent with the arrangement you choose.
Conclusion
Start with one theme. Pull its extracts together, choose two that do different work, and write a single paragraph that names the pattern, gives the quote, and says what it shows about your research question. Do that for one theme before touching the rest, and you will have a template the other sections can copy.
Everything above, from the theme labels to the quote counts, comes down to one habit: the theme carries the claim, the quote proves it, and your interpretation is what proves you earned the right to make it. Write that habit into every paragraph and the examiner sees an argument rather than a pile of data.