
If you want the short answer: the right statistical software for your thesis is the one your data structure, planned methods and supervisor all accept. Three names cover most theses. SPSS suits social science beginners who want a point-and-click interface, R suits anyone who wants reproducibility and advanced methods, and Stata suits economics and panel data work. Everything else is a variation on those three.
The wrong pick costs more than a week of learning. The usual failure is not choosing badly by accident; it is choosing by habit, then discovering in month seven that the program cannot do the one analysis the design needs. Fix that by deciding against a written list of requirements rather than against brand reputation.
Below is the process I would run myself, roughly in order, with the checks that actually predict whether you will finish on time.
Table of Contents
- 1What You Need Before Choosing Statistical Software
- 2Step-by-Step: How to Choose Statistical Software for Your Thesis
- 31. Start with Your Thesis Analysis Plan
- 42. Match the Software to Your Main Methods
- 53. Check Data Import, Cleaning, and Collaboration Requirements
- 64. Compare Cost, Access, Learning Curve, and Support
- 75. Run a Small Trial Before You Commit
- 86. Make the Final Choice and Document It
- 9Recommendation by Discipline
- 10Common Mistakes When Choosing Thesis Analysis Software
- 11Frequently Asked Questions
- 12What statistical software is best for research?
- 13Can I use Excel for thesis statistics?
- 14What is the best free statistical software for students?
- 15Is R or Python better for statistical analysis?
- 16Is SPSS still used for theses?
- 17What happens if I switch statistical software mid-thesis?
- 18Conclusion
What You Need Before Choosing Statistical Software
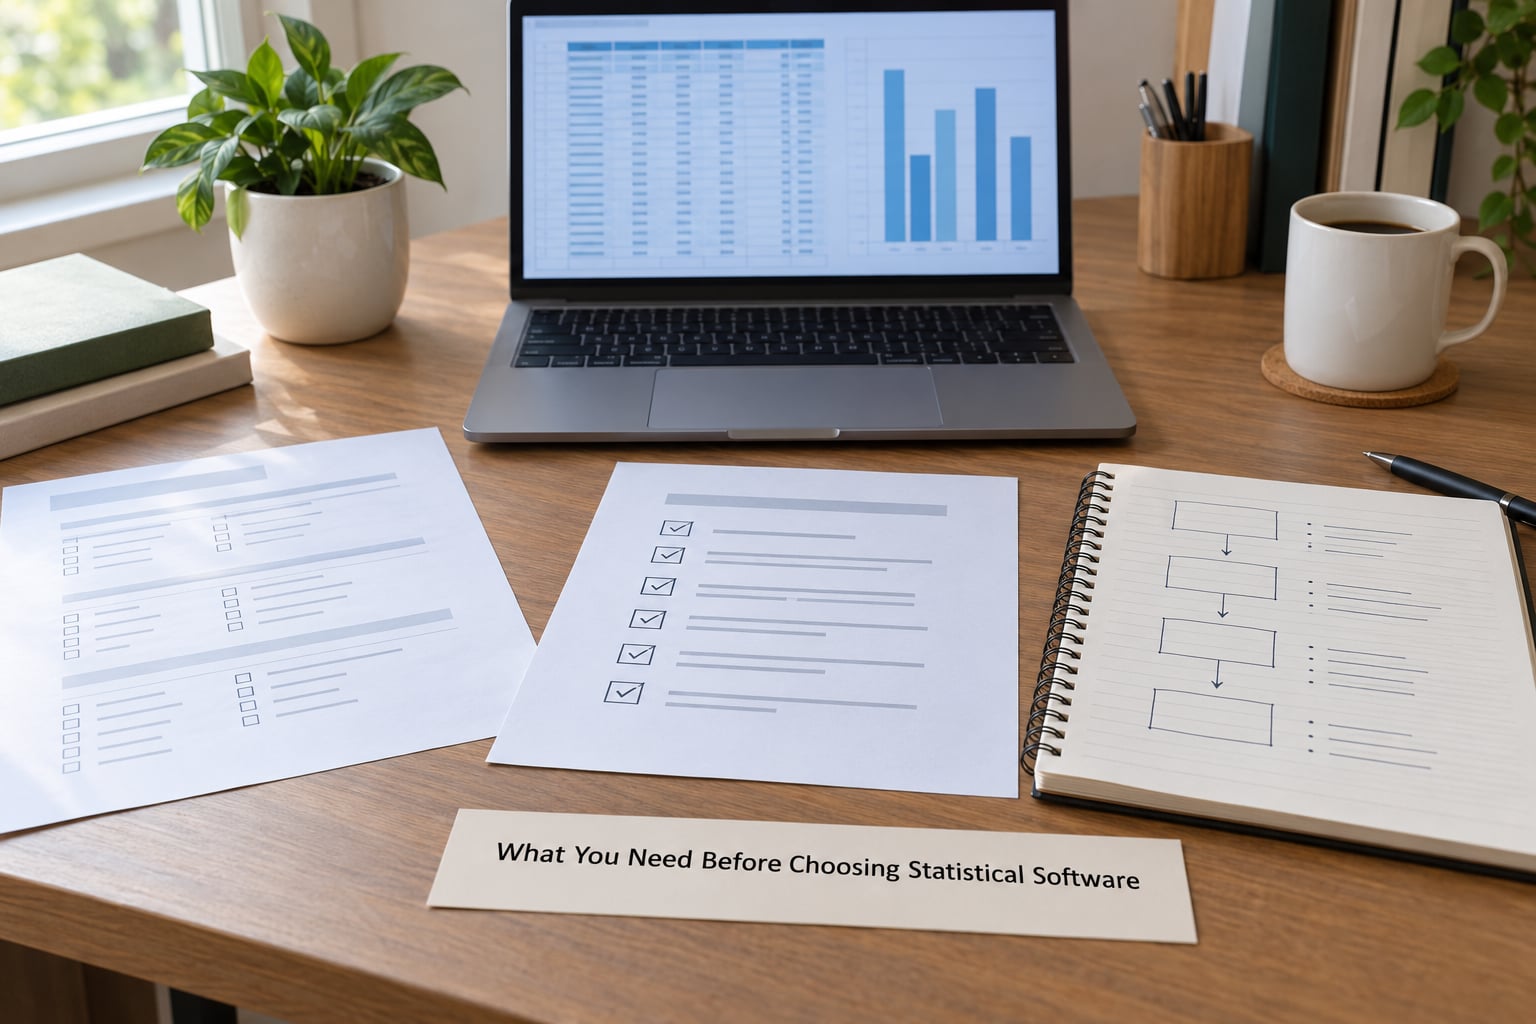
You cannot compare options until you can describe your project. Write these eight items down before you install anything.
- Data structure. Rows as participants or cases, or one row per observation with repeated measures? Wide or long format? Nominal, ordinal, interval or ratio variables? A 5-point Likert item is ordinal until you defend treating it as continuous, so decide what you will claim.
- Planned analyses. List the actual tests and models, not the topic area. Descriptive statistics, t-tests, ANOVA, chi-square, correlation, regression, non-parametric tests, factor analysis, repeated measures or multilevel models all land very differently.
- Sample size. Number of cases, number of groups, number of time points, and whether cases are clustered by school, site or interviewer.
- Required outputs. Specific tables, figures, effect sizes and confidence intervals your department expects. Some programs emit APA-style tables almost for free.
- Software access. What your university licenses, what your supervisor owns, what you can install on your own machine, and what runs on your laptop without a subscription.
- Budget. Some tools are free forever, some need a student licence, some need a site licence through a department.
- Supervisor expectations. This one decides more theses than any technical factor. Ask what they will open when they check your work.
- Current skill level. Be honest about whether you are comfortable writing code. It is fine to start with a menu-driven tool and move later.
If you cannot fill in items 2 and 7, stop and do those first. The rest of the process is fast once those two are settled.
Step-by-Step: How to Choose Statistical Software for Your Thesis
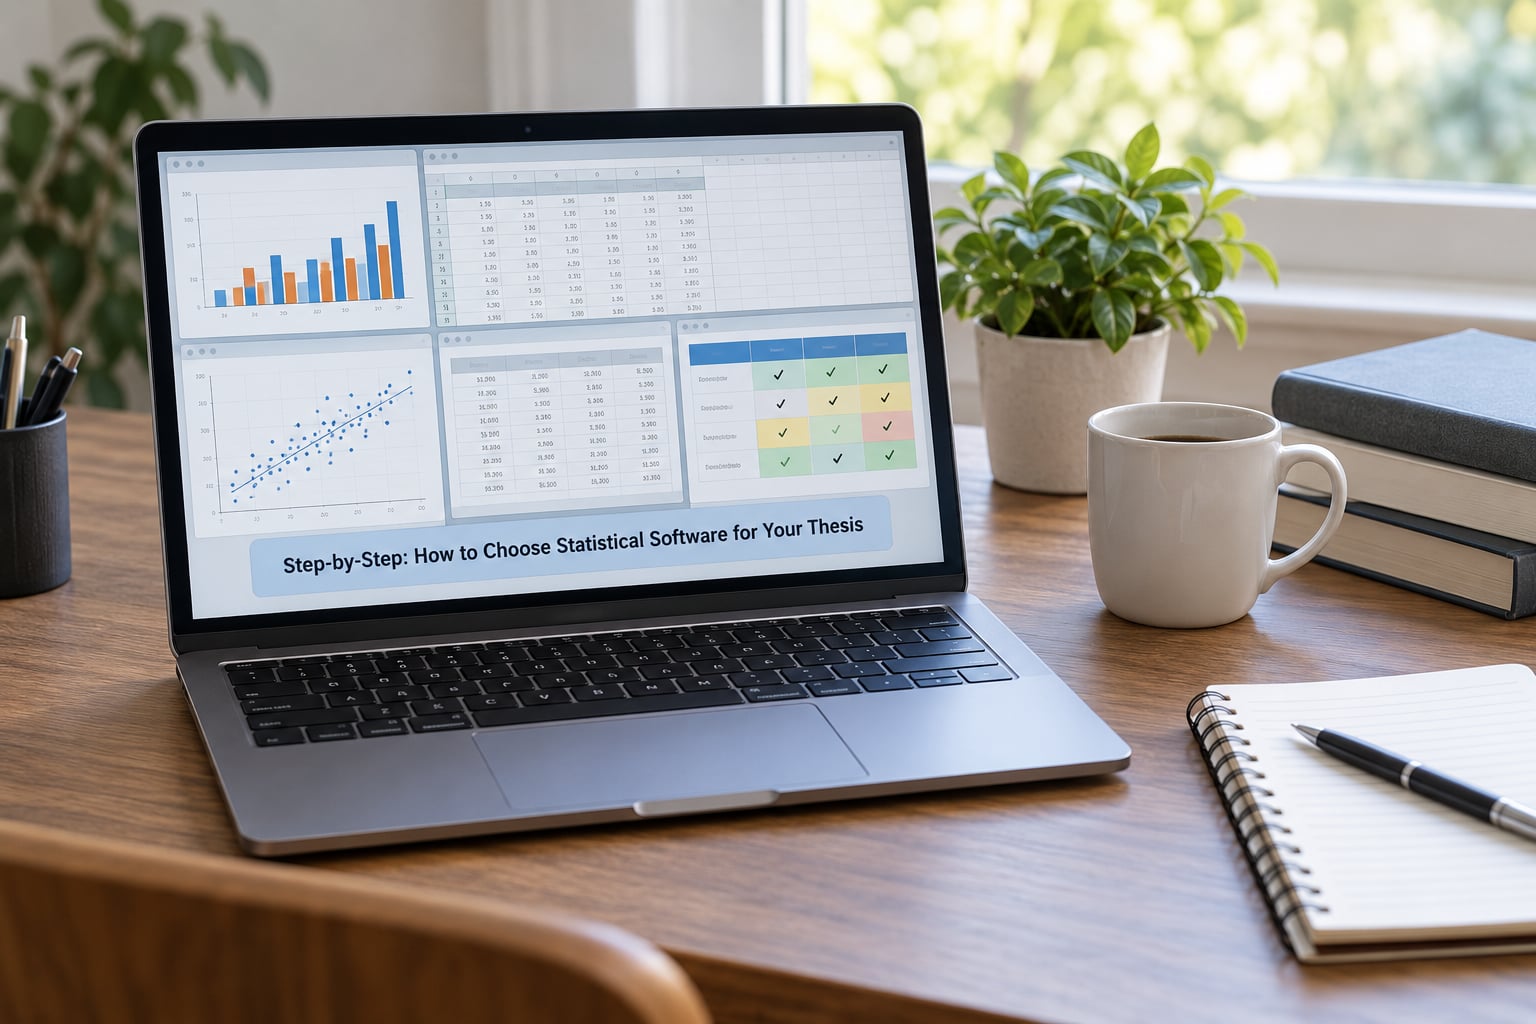
1. Start with Your Thesis Analysis Plan
Turn your research question into a requirements list. Each row should carry the analysis, the variables it needs, and the software feature that provides it. A row might read: mixed-effects model, outcome plus time plus random intercept for site, needs a mixed-model command in the base package or a contributed library.
This is also where you split exploratory from confirmatory work. Exploratory analysis is how you find out what your data looks like; confirmatory analysis is the pre-planned test you report. Software that keeps both in one scripted file serves the second phase better, and that is a real selection criterion rather than a preference.
Software cannot rescue a weak design. No package fixes a sample size that cannot detect the effect you claim, an unvalidated instrument, or confounders you never measured. Decide the method first, then pick the tool that runs it cleanly.
2. Match the Software to Your Main Methods
Match your requirements list against software families rather than hunting for a single winner. No package wins every row, and the row you actually need decides the answer.
| Analysis in your plan | Software that handles it comfortably | Note for selection |
|---|---|---|
| Descriptive statistics, cross-tabs, t-tests, ANOVA, chi-square | SPSS, jamovi, JASP, PSPP | Point-and-click, output ready to paste |
| General regression and diagnostic plots | R, Stata, Python, SPSS | All four work; graphics quality differs |
| Mixed-effects and multilevel models | R (lme4, nlme), Stata, Python | Free tools need a contributed package |
| Generalized linear models, survival analysis | R, Stata, SAS | R needs packages; Stata and SAS ship them |
| Survey weights, complex samples, stratified designs | SPSS, Stata, R (survey), SAS | Check that your design type is supported |
| Multiple imputation and missing-data handling | R (mice), Stata, SPSS (since v25) | Older SPSS versions lack modern methods |
| Factor and scale validation | R (lavaan), SPSS, jamovi, JASP, Stata | Check confirmatory factor analysis support |
| Panel and fixed-effects models | Stata, R (fixest, plm), Python | Stata is the standard in economics |
| Longitudinal growth curves | R, Stata, Mplus | Latent growth needs dedicated software |
| Spatial and geographic analysis | R, Python (GeoPandas), QGIS | Often a second tool, not a replacement |
| Sample size and power analysis | G*Power, R (pwr), jamovi power module | Run this before data collection, not after |
| Qualitative coding and thematic analysis | NVivo, MAXQDA, ATLAS.ti, R (tidytext) | A different category of tool entirely |
A few families deserve a note. SPSS, jamovi and JASP give you a spreadsheet-style grid and menu dialogs, which is why they remain the default in psychology, education and health survey work. Stata is built around econometrics and its do-file workflow, which is why economics departments rarely argue about it.
R and Python are command-driven. R has the deepest statistics-specific library ecosystem, including mixed models, causal inference and survey packages. Python fits when your thesis sits next to machine learning, scraping or a large data pipeline, where pandas, SciPy and statsmodels cover the analysis side.
For mixed methods, the choice splits. Quantitative strands follow the rules above. Qualitative strands need a code-based tool such as NVivo, MAXQDA or ATLAS.ti, where you tag interview and focus group extracts, build a codebook, and pull themes. Several of them now export coded tables into SPSS or Excel, so mixed-methods projects usually run two tools side by side. That is normal and worth budgeting time for.
3. Check Data Import, Cleaning, and Collaboration Requirements
Test imports before you commit. Take a real slice of your data and move it between formats: CSV, Excel, .sav (SPSS), .dta (Stata), and native R or Python objects. If a numeric identifier comes in as text, or a Likert variable arrives as a factor with levels instead of numbers, you have found a real problem on day one.
Next, ask how the work travels. If your supervisor sends .sav files and expects .sav files back, R will still read them but the exchange gets awkward. Some departments hand in an appendix of printed syntax, which rules out a purely menu-driven workflow. Others want a script, do-file or R Markdown document so the analysis can be re-run.
Data size and shape matter too. Very wide files and files with thousands of variables behave differently across tools. Repeated-measures data that fits in one SPSS data editor table can need reshaping in R. Know now whether you will be dealing with 40 cases or 40,000, and whether cases nest inside sites or schools.
Reproducibility is the part students underrate. Any tool can produce results, but only a scriptable workflow lets you re-run the whole analysis after a correction, hand the work to an examiner, or pick up where you left off after a crash. If you can only click through menus, document every click.
4. Compare Cost, Access, Learning Curve, and Support
Cost is mostly about access, not sticker value. R, jamovi, JASP and PSPP are free and open-source, and a free tool is never a reason for an examiner to reject your work. SPSS, Stata and SAS usually arrive through a university site licence, which means the real question is whether your department holds one and whether you can install outside campus networks.
Student and personal licences for SPSS and Stata exist and change terms, so check the vendor’s current terms rather than trusting a forum answer from two years ago. SAS follows a similar pattern with institutional licensing.
The learning curve is the variable people misjudge. A menu-driven tool gives you results in an afternoon and leaves you dependent on the program forever. A script-driven tool takes a week of syntax to learn and then saves you weeks on every later chapter. For a thesis with a hard deadline, time to first result often matters more than method coverage.
Forum discussions on this question tend to split the same way. On Reddit’s r/statistics, the most common opener is coding anxiety, and the most common resolution is starting with something comfortable and learning R alongside it. In GradCafe threads comparing Stata and R, the recurring point is that Stata’s graphical interface feels closer to SPSS, while R asks more of you up front. Budget for that difference rather than pretending it is not there.
5. Run a Small Trial Before You Commit
How to choose statistical software for your thesis with real confidence takes about an hour. Build a miniature dataset with the same variable types, the same grouping structure and a few deliberately missing values, then run your planned analysis in each shortlisted option.
Check six things during the trial. Does the file import without manual repair? Does the program flag the missing values you expect? Can it run your exact test or model, including post-hoc comparisons and effect sizes? Can it produce the diagnostic plots your method needs? Can you save the analysis as syntax, a do-file or a script rather than a series of clicks? And can you export the final table and figure in a format your thesis template accepts?
Time the trial. If you got a defensible result in an hour in one tool and struggled for a whole day in another, that difference will repeat across every chapter you have left. The trial also exposes the awkward parts early, which is far cheaper than finding them during your final correction window.
6. Make the Final Choice and Document It
Write down the decision in a short paragraph: the methods you need, the two options you trialled, the criterion that decided it, and the version you will use. Include package or module versions, because results can shift when a library updates.
Confirm the choice with your supervisor or committee before you commit weeks to it. A five-question conversation saves a month: which package do you use, what file should I send you, do you want syntax or an appendix, who checks my analysis, and what output format do you need.
Then decide what you hand in alongside the thesis. A common, well-regarded set is your cleaned data file, the syntax or script that produces every reported result, a short methods note describing each step, and an appendix listing the analysis in order. That bundle works in SPSS, Stata, R or Python, and it survives a change of tool.
Recommendation by Discipline
| Field | Start with | Alternative | Why |
|---|---|---|---|
| Psychology and social science | SPSS | R or jamovi | Department familiarity and ready-made output |
| Economics and business | Stata | R | Panel and fixed-effects support, do-file habits |
| Public health and epidemiology | R | SPSS, SAS | Survival analysis, weighted survey data, GLMs |
| Education research | SPSS or jamovi | R | Hierarchical data with many small clusters |
| Engineering and computing | Python | R, MATLAB | Pipelines, simulation, control of versions |
| Qualitative and mixed methods | NVivo, MAXQDA or ATLAS.ti | R with text packages | Coding, codebooks, thematic analysis |
| Biology and ecology | R | Python | Mixed models and species data pipelines |
Common Mistakes When Choosing Thesis Analysis Software
Picking the most popular program. Popularity tells you what other people did, not what your design needs. Start from your analysis plan and work backwards to the tool.
Learning a new tool too late. R is a fine choice and a bad surprise in the last month. If you have never written code, start with a menu-driven tool now and add R for the analyses that need it.
Ignoring file formats and versions. A supervisor expecting .sav files, or a package update that changes a default, can derail a submission. Test imports and record versions before the analysis begins.
Assuming the software supports your method. Confirmatory factor analysis, multilevel models, complex survey designs and multiple imputation are not in every free tool by default. Verify the specific method exists in the version you have.
Underestimating reproducibility. If your results cannot be regenerated from a file you hand in, you cannot answer a legitimate examiner question. Use syntax from the first real analysis onward, even if you typed it by hand at first.
Never asking what the supervisor expects. This is the cheapest fix on the list and the one students skip. Five minutes of questions prevents most rework.
Frequently Asked Questions
What statistical software is best for research?
It depends on your design rather than on a single winner. SPSS suits social science survey work and beginners who want menus. Stata suits economics and panel data. R suits advanced methods and reproducible workflows, and Python suits projects that involve large data pipelines. The best choice is the one your method needs, your supervisor accepts, and you can learn in the time you have.
Can I use Excel for thesis statistics?
Excel is fine for entering and cleaning small datasets, and it is usually not acceptable as the analysis engine for a thesis. It has no built-in assumption checks, no reproducible syntax, and it encourages manual edits that cannot be traced later. Use it to look at data, then run your statistics in a proper package and report from that output.
What is the best free statistical software for students?
R, jamovi, JASP and PSPP are free, and none of them is judged less credible than a paid package. Pick jamovi or JASP if you want menus and readable output, and R if your method needs libraries that only R has. Check what your university provides first, since a site licence may already cover SPSS or Stata.
Is R or Python better for statistical analysis?
Choose R when the analysis is the whole project: it has the deepest statistics-specific libraries for mixed models, causal inference and surveys. Choose Python when your thesis sits beside data cleaning at scale, automation or machine learning. Both are free and both can produce publication-ready output, so the deciding factor is your department and your supervisor.
Is SPSS still used for theses?
Yes, heavily. SPSS remains the default in psychology, education, nursing and health survey research because most supervisors read SPSS output without effort and because its menus remove a coding barrier. It has also added modern methods such as multiple imputation in recent versions. Being widely accepted in your field is an argument in its favour, not against it.
What happens if I switch statistical software mid-thesis?
Switching is rarely free but rarely catastrophic. Data moves between .sav, .dta and CSV files reasonably well, so the cost is mostly re-learning syntax and re-checking that outputs match your department’s format. Switch early rather than late, keep your cleaned data in a neutral format like CSV, and bring your supervisor in before you start rewriting anything.
Conclusion
If you are still unsure how to choose statistical software for your thesis, start with a written requirements list rather than a ranked list of tools. Most students reverse the order, and that is where the wasted months come from.
Write down every method your design requires, trial two realistic options on a small dataset, and pick the one that fits your workflow, your supervisor’s expectations and your available learning time. Then record the decision, the versions and the syntax before the real analysis starts. Most thesis software problems come from deciding late, not from choosing badly.