Most SPSS errors come down to four things: a typo in syntax, a variable that is not the type you think it is, a filter that quietly removed your cases, or a missing licence for an add-on module. The fix is rarely exotic. You read the full message, work out which of those four it is, change one setting, and rerun. That is how to fix common SPSS error messages, and it takes about ten minutes for almost every problem students hit.
The reason these errors feel hard is that SPSS names them by number. “Error 532” tells you nothing until you know it means the significance level you typed is not between 0 and 1. Below is a lookup table of the messages people paste into search engines most often, mapped to the cause and the fix.
| Message you see | What it means | How to fix it |
|---|---|---|
| Error 1: The following string is not a valid variable name | Variable name starts with a digit or $, @, #, _, or uses characters like a period | Rename it under 8 characters, starting with a letter, using letters, digits and underscores |
| Error 101: Missing system-missing value | Syntax refers to a variable that is not in the active dataset | Run DATASET ACTIVATE followed by the dataset name, or open the right file |
| Error 102: The variable does not exist | Name is misspelled or the variable was never created | Check spelling in Variable View and confirm the dataset is active |
| Error 460: This command is not allowed within LOOP | A transformation or EXECUTE sits inside a LOOP structure | Move the command outside the LOOP and rerun |
| Error 532: Significance level must be between 0 and 1 | Alpha entered as 5, 05 or .05 misread, or as a percentage | Enter 0.05, not 5 or 05 |
| Syntax Error: Unexpected end of file | Missing period terminator at the end of a command | Every command needs a period on its own or at the end of the line |
| String variable cannot be added together | A text variable is in an arithmetic expression | Check Type in Variable View, then recode or move it out of the equation |
| No cases to Process | Filter, empty value range, or missing codes removed every row | Turn off filter status and check value ranges and missing declarations |
| At least one variable must be numeric | MEAN, T-TEST, ANOVA or REGRESSION got a string variable | Check Measure and Type, recode labels, reselect variables |
| Warning: Necessary variables are missing | The active dataset is not the one holding your variables | Activate the correct dataset before running the syntax |
| Warning: 53 uncoded cases | Missing values fell outside every declared value range | Declare missing values in Variable View, then rerun |
| Not authorized to run this command | Your licence does not include the module the procedure needs | Check your licence tier with your institution, or use the base alternative |
Note what these messages share: almost none of them mean your analysis is wrong. They mean SPSS stopped or flagged something before it went further. Once you know which category a message falls into, the rest of this guide walks through each one.
Table of Contents
- 1What You Need
- 2Step-by-Step
- 31. Fix “Syntax Error” or Unexpected Text
- 42. Fix “String Variable Cannot Be Added Together” or Invalid Numeric Data
- 53. Fix “No Cases to Process”
- 64. Fix “At Least One Variable Must Be Numeric”
- 75. Fix Redundant or Collinear Variables in Regression
- 86. Fix Missing Values and System-Missing Problems
- 97. Fix Output, Chart, or Viewer Errors
- 108. Fix File, Save, and Data-Import Problems
- 11Common Mistakes
- 12Frequently Asked Questions
- 13Why does SPSS show an error after I change a variable?
- 14Can I ignore an SPSS warning if my output still appears?
- 15How do I find the exact case or value causing a SPSS error?
- 16Why does SPSS say a variable is not numeric when it looks numeric?
- 17Should I delete cases or variables when SPSS reports a warning?
- 18When should I ask for help with an SPSS error?
- 19Conclusion
What You Need
Before you change anything, make a copy of the file. Working on a duplicate costs you one minute and saves you from the version where you overwrote a recoded variable and lost the original.
You need four things working:
- A saved data file in .sav format, not an unsaved session. If your title bar says “Untitled” you have no file to reopen.
- The syntax file that produced the error, or a clean one to rebuild from.
- Both editor windows — Data Editor (Variable View and Data View) and Output Viewer. Most diagnosis needs all three.
- Access to the same SPSS version the error came from.
Menu names shift slightly between recent desktop releases. SPSS 28, 29, 30 and 31 all place Filter Cases under Data and value labels in Variable View, but the wording of some dialog buttons differs. If a step here does not match what you see on screen, look for the closest equivalent rather than assuming the path is wrong.
Step-by-Step
Here is the process that works regardless of the message. Reproduce the error first, so you know it is still there. Then read the entire message, not just the number — the text after the number names the offending variable or command. Next, decide which bucket it belongs to: syntax, data, variables, procedures or output. Apply one correction. Rerun only the corrected syntax. If the output table appears and the sample size matches your expectation, you are done.
One rule matters more than the rest: never ignore a warning just because output appeared. A warning means SPSS finished anyway and something in the results may not be what you think.
1. Fix “Syntax Error” or Unexpected Text
This is usually a missing period terminator or an unbalanced quote. SPSS reads commands as complete units, and a period ends the unit.
Open the Syntax Editor. The offending statement gets highlighted, and the Output Viewer note tells you the line. Then check four things:
- Punctuation — every command ends with a period.
- Quotation marks — every opening quote has a closing partner.
- Operators — there is no stray comma before a period.
- Command names — the verb is spelled the way SPSS expects, for example FREQUENCIES not FREQUENCY.
A malformed command looks like this:
FREQUENCIES age gender
VARIABLES = age gender
SPSS reads that as one run-on command and stops. Add the period:
FREQUENCIES VARIABLES=age gender.Run it and confirm the output: an Frequencies table with counts and percentages appears in the Output Viewer. If you get that table, the fix worked.
If your error is inside a RECODE block, the pattern is nearly always the same — a RECODE needs an INTO target, and conditional logic needs DO IF wrapping around it. A RECODE with no INTO leaves the data untouched and the analysis runs on the old values.
2. Fix “String Variable Cannot Be Added Together” or Invalid Numeric Data
This message means SPSS found text where it expected a number. The variable is declared as a string, so arithmetic on it is impossible until you either change the data or change the variable.
Go to Variable View and check the Type column. Anything labelled A8 or A20 is text. Anything labelled F8.2, F8.0 or similar is numeric.
Now find the offending rows. Edit > Find in the Data Editor lets you search for a value, or sort the variable and scan for text sitting in a column of numbers. A single stray entry is enough to trigger the error while the other 400 rows look perfect.
The classic case: a respondent wrote “25 years” in an age field instead of 25. SPSS stores that entire cell as text. You have three options, and they are not equally good.
- Clean the entry if it is one or two typos. Correct it in Data View and save.
- Recode into a new variable if the text carries meaning. Create a numeric variable and use Transform > Recode into Different Variables, mapping text to a code.
- Declare it missing if the entry cannot be recovered. Setting it as user-missing keeps the row in the file while excluding it from calculations.
Overwriting the original variable in place is the one option to avoid. You lose the ability to audit the change.
3. Fix “No Cases to Process”
When SPSS reports no cases, every row was excluded before the calculation began. Five things cause it, and you can check each in under a minute.
Check the filter first. Look at the status bar under the Data Editor. If it shows a filter indicator, an earlier IF condition is still active. Data > Filter Cases > All Cases clears it.
Check value ranges. If your data legitimately contains 999 for missing, and 999 falls outside the ranges you set in Transform > Recode, the rows disappear. Open the Value ranges dialog and widen it.
Check missing declarations. User-missing codes defined in Variable View exclude cases from the analysis by design.
Check Select Cases. Data > Select Cases leaves an “unselected” flag on rows that look present in the grid but are not analysed. Data > Select Cases > All restores them.
Check weight cases. A weight variable set earlier silently multiplies your frequencies. All cases included means undoing the weighting.
After clearing, run FREQUENCIES on the grouping variable and confirm the total equals your expected sample size. If it is short, the filter is still on somewhere.
4. Fix “At Least One Variable Must Be Numeric”
MEAN, T-TEST, ANOVA, REGRESSION and most parametric tests need actual numbers, not labels. “Male” and “Female” cannot be averaged, and SPSS will refuse rather than guess.
There are two separate settings to check, and students confuse them constantly. Type controls how data is stored. Measure controls how SPSS treats it statistically.
- Nominal — categories with no order. Gender, region, yes or no responses.
- Ordinal — categories with order. Likert items, satisfaction rankings.
- Scale — continuous quantities. Age, income, test scores.
Numeric storage does not mean scale. A response coded 1 to 5 can be numeric and still be ordinal, and that distinction changes which tests you are allowed to run later.
When you hit the error, first look at the Variables box in the dialog. The offending variable is usually still sitting there after a failed attempt. Remove it, then confirm in Variable View that the numeric measure you need is actually marked scale. If a nominal category has no numeric equivalent yet, recode it into dummy variables using Transform > Create Dummy Variables, then run the test on the dummies.
5. Fix Redundant or Collinear Variables in Regression
This one is a warning, not a failure. Regression runs, but two or more predictors carry nearly the same information, so the model cannot tell which one is doing the work.
Open Explore > Correlations and run a correlation matrix on your predictors. Anything above 0.90 between two predictors is a strong flag.
Then check the Coefficients table. Tolerance near zero, or a VIF above 5, confirms redundancy. A negative tolerance and a VIF of 10 or more is severe.
Do not delete a variable just to silence the message. Ask which of the two overlapping measures actually represents your hypothesis. If both were collected, dropping one may be defensible; if they measure different constructs that happen to correlate, the fix is interpretation rather than deletion. Removing a predictor changes every coefficient and every R-squared in the model.
What you should do: build a simplified model without the redundant variable, compare it to the full one, and write down the difference in your analysis notes. If the results barely move, you have your justification. If they shift a lot, the original model was unstable and the collinearity was doing more damage than the warning suggested.
6. Fix Missing Values and System-Missing Problems
Two kinds of missing exist in SPSS and they behave differently. System-missing is SPSS’s own marker for a genuinely absent value — a blank cell. User-defined missing is a value you declared, typically a code like 9 or 999 that means “did not answer”.
Both are declared in Variable View, in the Missing column. Click the cell, choose Define user missing values, and enter the codes. Leave it blank and SPSS treats 999 as a real number, which drags means down and corrupts every test that touches the variable.
Run FREQUENCIES with the missing values declared and look at the output table. SPSS shows a Valid and a Missing row, and those two numbers should add up to your total N. If they do not, something is still uncoded.
One warning worth naming: “Warning: 53 uncoded cases.” It means 53 rows held a value outside every declared range, so SPSS treated them as system-missing. Frequently it appears when Excel imports turn a column into text. Fix the source variable, not the warning.
And be clear about what listwise deletion does. SPSS drops every case that is missing on any variable in the model. Run a regression with ten predictors and a handful of blanks anywhere, and your N can drop by a third with no visible warning. Check the “Valid N” line in the output before you report anything.
7. Fix Output, Chart, or Viewer Errors
When output goes wrong rather than the analysis, the cause is usually the Viewer or the file, not your data.
Deleted output objects. Any table or chart you delete in the Viewer is gone until you rerun the procedure. Output is not saved history — it regenerates. Rerun the syntax and the table returns.
Incompatible chart options. Bar charts of mean scores and most scatterplot overlays fail on string or ordinal variables. Switch the chart type in Chart Builder, or change the Measure in Variable View first.
Oversized or corrupted viewer. After a very large dataset the Viewer slows down noticeably. Close the output file, rerun, and save the output to a separate .spv file through File > Save As.
Unsupported formats. Exporting to a format your software cannot open creates a file that looks empty. Use File > Export, and export tables as HTML or Word-friendly formats rather than PDF when you intend to edit the numbers later.
Verify the fix by reopening the .spv file after saving. If the tables render, the Viewer is healthy.
8. Fix File, Save, and Data-Import Problems
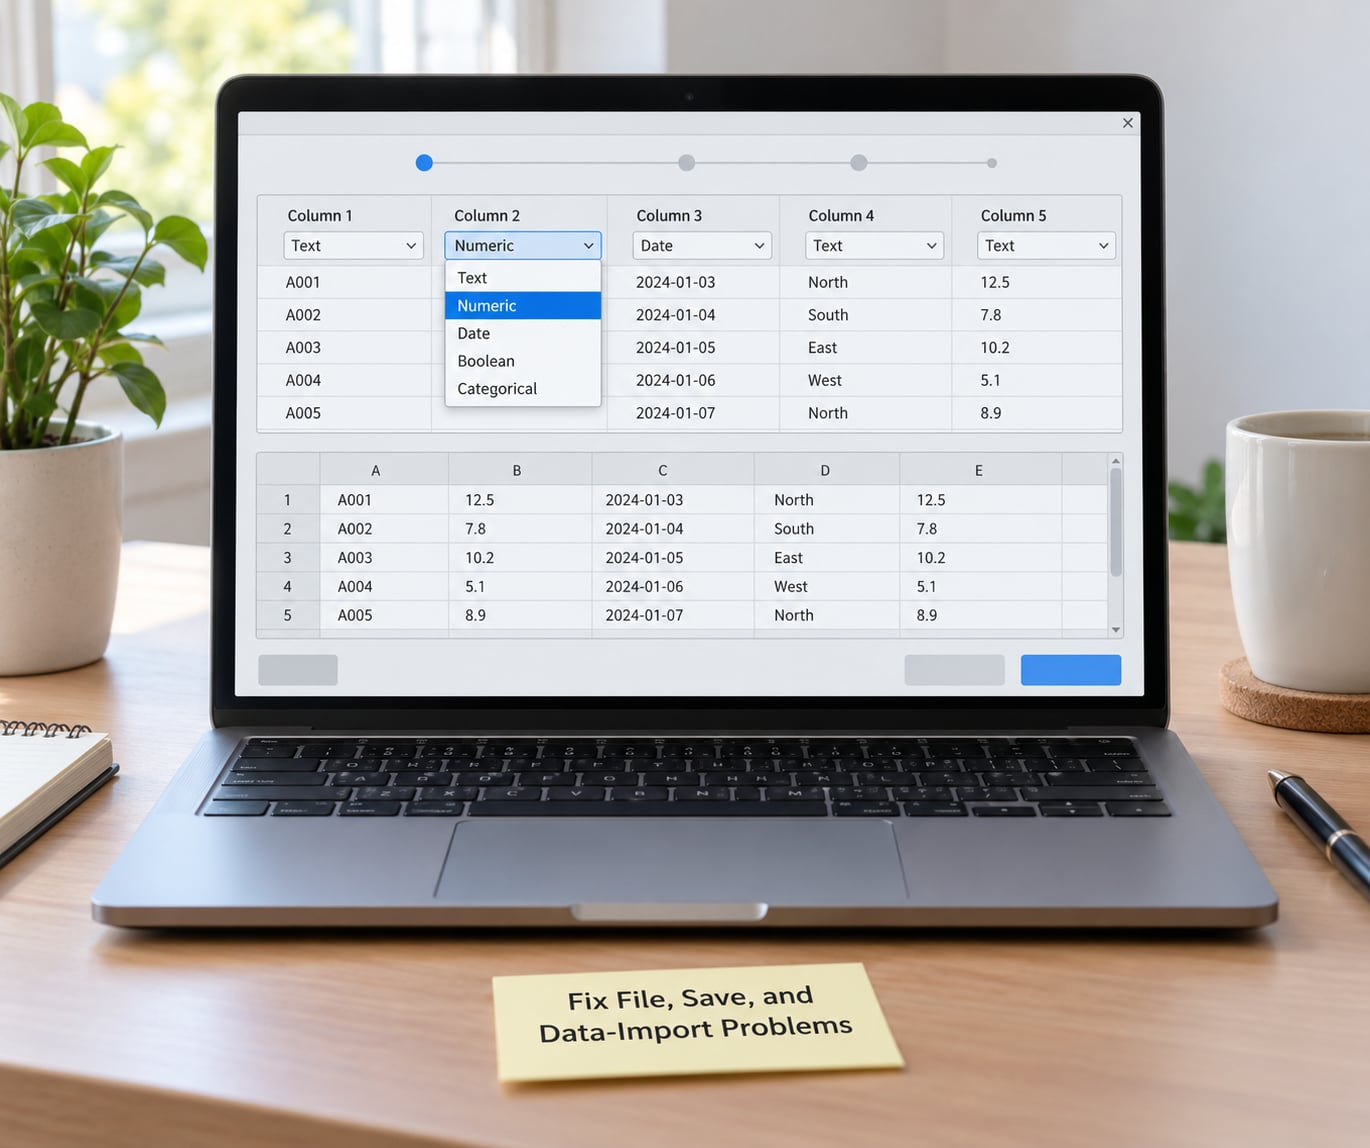
Import problems are where most “SPSS is broken” reports begin. The usual sequence is a clean Excel file, a messy import, and a warning about string-to-numeric conversion.
Variable names. Excel headers become SPSS variable names, and anything the system will not accept produces Error 1. Headers starting with a digit, containing spaces, periods, hyphens or starting with $ are the usual culprits.
Types. If a column of numbers arrives as text, select it in the preview window of the Text Import Wizard and set its type to Numeric. Then scan the column for mixed content — one cell containing “25 years” turns the whole column to text.
Dates. Dates depend on your regional settings and can silently become text. Set the column type to Date and specify the format rather than accepting the default.
Decimals and delimiters. A CSV saved with semicolons instead of commas will produce one giant variable. Confirm the delimiter in the preview before you click OK.
Read-only or locked files. A file open in another program, or on a synchronised cloud folder, will fail to save without a clear message. Close it everywhere, move it out of the sync folder, and save again.
Verify the import by checking Type and Measure in Variable View and confirming the row count matches your spreadsheet. If the counts match and the columns are typed correctly, the import is sound.
Common Mistakes
Most failed SPSS sessions come from repeating one of these behaviours rather than from a genuinely hard problem.
Changing several settings at once. You recode, add a filter, and edit a variable, then rerun and get a different error. Now you cannot tell which change caused what. Make one change, rerun, note the result.
Treating every warning as fatal. “Not authorized to run this command” blocks the procedure entirely. A collinearity warning does not — output appears and your numbers may be fine. Learn which of the two you have before reacting.
Deleting cases because your N is too small. A filter left on from twenty minutes ago will do that. Clear Filter, Weight and Select Cases before you touch a single row.
Assuming labels are values. If a variable shows values 1 and 2 with labels “Male” and “Female”, the data contains the numbers. Any syntax using “Male” directly will fail. Use the code, or the value label with a quoted string where SPSS allows it.
Ignoring the Output Viewer. The Viewer holds the error, the warning and the valid case count. Working only in the dialog box means working blind.
Rerunning without saving clean syntax. If you build an analysis by clicking, you cannot reproduce it. Use the Paste button in every dialog — it writes the equivalent syntax into the Syntax Editor, which you then save as your record.
Ignoring version and licence differences. Syntax from a book written for an older release may use procedures your licence does not include. That is a licensing fact, not a mistake on your part, and your institution’s IT desk can confirm your tier.
Frequently Asked Questions
Why does SPSS show an error after I change a variable?
Changing a variable alters the active dataset, and any syntax referencing it now runs against different data or a different type. Renaming a variable breaks every command that used the old name, and changing a variable from numeric to string breaks any arithmetic on it. Check the Type and Measure columns in Variable View after every edit, and rerun the affected syntax rather than assuming the earlier output still applies.
Can I ignore an SPSS warning if my output still appears?
Sometimes, but never without reading it. A warning means SPSS finished the procedure and flagged something that may affect the results. Collinearity warnings rarely change conclusions, but warnings about missing cases, uncoded values or listwise deletion can silently shrink your sample and shift every number. Read the warning, check the valid case count in the output, and only then decide it does not apply.
How do I find the exact case or value causing a SPSS error?
Sort the offending variable in Data View and scan for values that break the pattern, such as text sitting in a column of numbers. Edit and Find in the Data Editor searches for a specific value across the file. For case selection problems, run FREQUENCIES on the case number variable and check which rows fell outside your filter or value ranges. Running the frequencies first often reveals the problem faster than hunting cell by cell.
Why does SPSS say a variable is not numeric when it looks numeric?
It probably is numeric, but stored as text. SPSS stores a whole column as string the moment one cell contains anything other than a number, so a single entry like 25 years converts the entire variable. Check the Type column in Variable View — A8 or A20 means string, F8.2 means numeric. Fix the offending cell, then change the type back, or recode the variable into a new numeric one.
Should I delete cases or variables when SPSS reports a warning?
Only when you have a substantive reason, not to make a message disappear. Deleting a case changes your sample size and may bias results; deleting a predictor changes every coefficient in the model. Clear any active filter first, because it removes cases silently. If the warning concerns redundancy in regression, compare a simplified model to the full one and document the difference before deciding.
When should I ask for help with an SPSS error?
Ask your supervisor or your institution’s IT support when the error mentions licensing or authorisation, when it appears only on a remote server, or when the same message survives the documented fix. Licence-tier questions in particular are not user errors, and support staff can confirm which modules your subscription includes. Bring a screenshot of the full message and your syntax file — that turns a long email thread into a two-minute conversation.
Conclusion
Start with a copy of your file, reproduce the error, and read the entire message including the text after the number. Then check the four usual suspects in order: syntax punctuation, variable type and measure, filter and weight status, and the active dataset. One correction, one rerun, one check of the valid case count.
Whichever fix worked, write it down and save the corrected syntax. That file is the reproducibility record your supervisor or examiner will ask for later, and it saves you the whole diagnosis again when a similar error appears in your next dataset.