Chapter 4 is where your finished analyses turn into evidence a reader can follow. Knowing how to write Chapter 4 results of a dissertation is mostly about discipline: report what the data showed, in the order of your research questions, with tables that carry labels, units and notes, and leave interpretation for the discussion chapter.
The work takes most students three to six evenings of focused writing once the analysis is done. The hard part isn’t the sentence-level craft, it’s resisting the urge to explain everything you found. If you already have your output files, you can start with the seven-stage workflow below and work straight through.
Table of Contents
- 1What You Need
- 2Step-by-Step: How to Write Chapter 4 Results of a Dissertation
- 3How to Write Chapter 4 Results of a Dissertation: Start With the Evidence
- 4How to Write Chapter 4 Results of a Dissertation: Open the Chapter
- 5Report Each Result in the Same Order
- 6Create Tables and Figures That Are Easy to Interpret
- 7Write the Narrative Around the Numbers
- 8Close With a Chapter Summary
- 9Check the Chapter for Accuracy and Consistency
- 10Common Mistakes
- 11Common Mistakes and Quick Fixes
- 12Frequently Asked Questions
- 13How long should Chapter 4 of a dissertation be?
- 14Should Chapter 4 interpret the results, or only present them?
- 15How do I write Chapter 4 results of a dissertation with many analyses?
- 16Do I need tables and figures if I describe the findings in paragraphs?
- 17What should I write when a statistical test is not significant?
- 18Conclusion
What You Need
Before you write a single paragraph, gather the material the chapter has to be built from. Without these in one place, the writing stalls every time you need to check a number.
- Your research questions, objectives or hypotheses. These set the running order of the whole chapter. Every result you report has to answer one of them.
- Your analysis outputs. For quantitative work, the full output files from SPSS, R, Stata or similar. For qualitative work, your coding summary, code frequencies, theme list and any framework diagrams.
- Statistical tables and figures, already built. Not screenshots, not pasted software output. Properly formatted tables with titles, footnotes and labels.
- Your syntax or analysis log. The record of what you actually ran, in what order, with which variables. Supervisors ask for this and it saves hours of reconstruction later.
- Your university’s guidelines. Word or page limits, formatting rules, required structure, and whether results and discussion are combined into one chapter.
- Chapters 1 to 3, in their final form. You need the research questions and the stated method so the results match what you promised you would do.
For a survey study, also have your screening record ready: how many responses you collected, how many you excluded and why, and how many cases remained for analysis. That number appears in more than one table and examiners check it every time.
Step-by-Step: How to Write Chapter 4 Results of a Dissertation
Learning how to write Chapter 4 results of a dissertation works best as an ordered process, because each stage assumes the previous one is finished and clean. The seven stages below follow the sequence your reader will expect, and they work for quantitative, qualitative and mixed methods designs once you adapt the evidence type.
How to Write Chapter 4 Results of a Dissertation: Start With the Evidence
Start by confirming that every analysis you promised in Chapter 3 has actually been run. Most drafts that go wrong later are missing a test the methodology section named, or reporting a test that nobody asked for.
Then assemble your evidence set. For a quantitative design, a correctly prepared set contains a demographics or respondent profile table, a descriptive statistics table for every variable used in an inferential test, one table per research question, and any figures that show a distribution or a relationship. For qualitative work, it contains a participant or sample profile, the coding process summary, a theme table showing each theme with its supporting codes, and the interview extracts you will quote.
Check each item against your original output. A statistic you cannot trace back to a file is a statistic you cannot defend.
How to Write Chapter 4 Results of a Dissertation: Open the Chapter
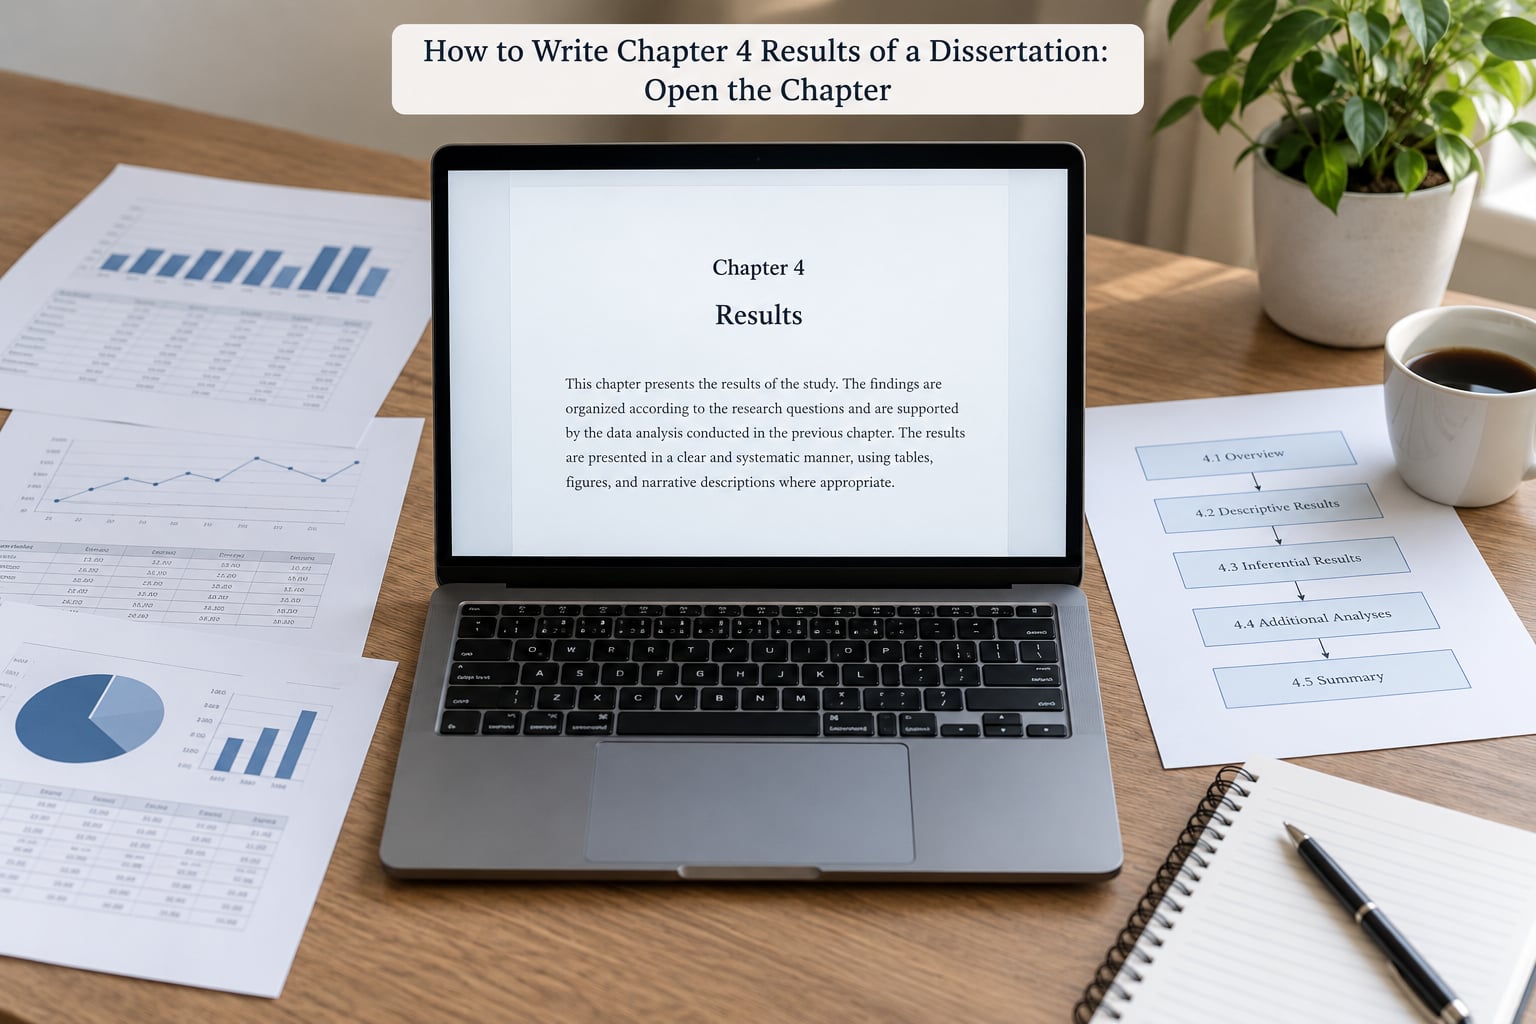
The chapter opening is short, usually 150 to 300 words, and it does three things: it says what the chapter reports, it states the order the reporting follows, and it gives a one or two sentence reminder of the study context.
Do not re-run your methodology here. A reader who needs the sample design explained again has a problem in Chapter 3, not in Chapter 4.
A workable version looks like this: This chapter presents the findings of the study in the order of the three research questions set out in Chapter 1. Section 4.2 describes the sample profile, Section 4.3 reports the descriptive statistics, and Sections 4.4 to 4.6 address each research question in turn. The discussion of what these findings mean is deferred to Chapter 5.
That last sentence is doing real work. It tells the examiner you know the boundary between results and discussion, and it removes the temptation to interpret for the next forty pages.
Report Each Result in the Same Order
Consistency is what makes a results chapter readable. Use the same five-part sequence for every research question, and run it every time without exception.
- Introduce the analysis. Name the research question and say what was tested, for example To address Research Question 2, an independent samples t-test was conducted to compare mean scores between the two groups.
- Identify the test or model precisely. Give the test name and any variants used, such as Welch’s t-test, one-way ANOVA, or multiple regression with robust standard errors.
- Report the statistics. Give the relevant values, the degrees of freedom where they apply, and the p-value. Where you have them, give the confidence interval and the effect size.
- Describe the substantive pattern. Say what the numbers look like, using plain language. Participants in Group A scored a mean of 24.6, compared with 21.3 in Group B.
- State the conclusion for that question only. The result was statistically significant at the .05 level, so Research Question 2 is supported. Then stop.
Reporting style matters here. Statistical symbols are italicised in APA style: t, F, p, r, R2. Exact p-values to three decimal places when they are below .001, otherwise two decimal places, with no leading zero for p (p = .032, never p = 0.032).
Findings sit in past tense. What the study found happened. When you refer to your own chapter, though, use present tense: Table 4.3 shows, Chapter 4 reports, Figure 4.1 illustrates. That single rule trips up a lot of students and it is one of the fastest corrections an editor will make.
Create Tables and Figures That Are Easy to Interpret

A table should be readable on its own, without the paragraph above it. Every table needs a number, a descriptive title, column and row labels, units, and a note beneath it that defines any abbreviation or statistical symbol you used.
Number tables and figures sequentially, by section or by chapter, and pick one system and keep it. Table 4.1, Figure 4.1, Table 4.2. Do not restart numbering in every section if your guidelines specify chapter-level numbering.
For descriptive statistics, report the count, mean, standard deviation, and the minimum and maximum. Add the median when the distribution is skewed, and add skewness and kurtosis when you have reported an assumption test that used them.
For inferential results, a typical table gives the test, the group or model, the test statistic, the degrees of freedom, the p-value, and an effect size with its confidence interval. Partial eta squared, Cohen’s d and R2 all belong here, because a p-value on its own tells a reader nothing about magnitude.
A few practical rules that supervisors notice. Round to two decimal places for means and test statistics, three for p-values. Remove gridlines and shading so the table prints cleanly in black and white. Never paste raw output with variable names like var_07 visible; relabel them. And do not put a chart in when a table already carries the same numbers, unless the shape is the point.
For figures, write a caption that states what is plotted, which variables, which units, and any relevant sample size. A title like Figure 4.2 alone is not a caption.
Write the Narrative Around the Numbers
Numbers in tables do not argue with each other. The narrative exists to tell the reader what to look at, in what order, and what pattern it forms.
Weak reporting buries the result in method detail: A one-way ANOVA was conducted using SPSS version 26 in order to compare the three conditions, following the procedure described by Field. That belongs in Chapter 3 and belongs to the discussion of method, not here.
Improved reporting leads with the finding and keeps the method to one clause: A one-way ANOVA showed a statistically significant difference in mean satisfaction between the three conditions, F(2, 147) = 6.42, p = .002, partial η2 = .080. Post hoc comparisons using the Tukey HSD test identified the web panel condition (M = 4.11) as scoring significantly higher than the in-person condition (M = 3.52, p = .004).
Be careful with claims. A significant result supports a conclusion about the tested relationship; it does not prove a mechanism, and it does not license generalisation beyond your sample without justification. Equally, a non-significant result does not prove the absence of an effect. Say what you found and hold the interpretation for Chapter 5.
For qualitative work the same logic applies to text instead of statistics. Introduce the theme, describe how it developed across participants, then present a short verbatim extract as supporting evidence, in quotation marks and attributed to a participant code such as P07. State how many participants contributed to the theme, and be honest about the one or two that disagreed.
Mixed methods studies need an explicit integration point. After reporting both strands separately, add a short joint display section that says where they converge and where they conflict, and draw the joint display or table that shows both on the same research question.
Close With a Chapter Summary
A short chapter summary closes the results. It restates each finding in the same order as the research questions, in a few sentences each, and it does no more than that.
Keep interpretation, limitations and recommendations out of it. If your summary explains why a finding happened, or what it means for practice, you have written a paragraph of Chapter 5 and started an argument your examiner will question.
The last sentence should point forward. Something like The findings presented in this chapter are discussed in relation to the literature and to the study’s limitations in Chapter 5 is enough.
Check the Chapter for Accuracy and Consistency
Do a full verification pass before you send the chapter to your supervisor. It takes about an hour and it catches nearly everything that gets drafts returned.
- Confirm the final sample size is identical everywhere it appears, including the demographics table and every test that used it.
- Check that every table and figure is cited in the text in numerical order, and that no table exists that you never mention.
- Verify that each test name, statistic symbol and degrees-of-freedom value matches the original output exactly.
- Check decimals are consistent: p-values, coefficients, means and standard deviations should not each use a different number of places.
- Confirm you have said how missing data and outliers were handled, consistently with Chapter 3.
- Read the methodology chapter side by side with your results and confirm each stated analysis actually appears.
- Apply your university’s style rules on tense, table formatting, referencing and appendix use.
- Read your summary and check it sets up Chapter 5 rather than pre-empting it.
Common Mistakes
These are the errors that come up most often, and each has a direct fix.
- Pasting raw software output. Rebuild the table in your document, round the values, and relabel every variable and column.
- Reporting p-values alone. Always pair significance with an effect size and, where available, a confidence interval.
- Interpreting inside the results chapter. If the sentence explains why or what it means, it belongs in Chapter 5.
- Repeating the method. One clause naming the test is enough; the rationale belongs in Chapter 3.
- Overloading tables. Split a table doing five jobs into two tables doing one job each.
- Mixing statistical notation. Pick one style for symbols, decimals and italics and hold it across every table.
- Calling a non-significant result proof of no effect. State that the test did not reach the significance threshold and leave the reasoning to Chapter 5.
Common Mistakes and Quick Fixes
Beyond the list above, most rejected chapters share a handful of patterns. Each one has a quick correction and a worked example.
Copy-pasted output. Fix: rebuild every table by hand, even when it is slower. The signal that a table came straight from software is unrounded values such as 0.78234 and internal variable names.
Reporting results out of sequence. Fix: match the chapter order to the order of your research questions exactly. A reader who jumps from Question 2 to Question 1 to Question 3 has to rebuild your logic mentally, and most will not.
Bloating the chapter with every output you produced. Fix: report what answers your questions and what supports the argument. Analyses run for curiosity do not belong, even when they are interesting.
Contradicting your own methodology. Fix: read Chapter 3 and Chapter 4 back to back. If Chapter 3 says you tested assumptions before ANOVA and Chapter 4 jumps straight to the ANOVA, something was skipped or changed, and you need to say which.
Two habits keep the rest at bay. Write in past tense for findings and present tense for what the reader can see in a table or in your own document. And keep interpretation out: describe what happened, hold the meaning back for five pages.
Frequently Asked Questions
How long should Chapter 4 of a dissertation be?
Most institutions land between 15 and 30 pages for a master’s dissertation and 30 to 60 pages at doctoral level, but length follows evidence, not a target. A study with six research questions and mixed methods needs more space than one with two questions. Ask your department for its word limit, then treat that as a ceiling rather than a goal to fill.
Should Chapter 4 interpret the results, or only present them?
Only present them. Chapter 4 describes what the analysis found, in order, with the supporting tables and figures. Interpretation, comparison with the literature, limitations and recommendations belong in the discussion chapter. A short sentence pointing forward is welcome, but the argument itself waits until Chapter 5.
How do I write Chapter 4 results of a dissertation with many analyses?
Group the analyses under the research questions they serve rather than listing test after test. Give each research question its own numbered section, report only the tests that answer it, and lead each section with the finding. If you find yourself unable to name the question a table serves, that table does not need to be there.
Do I need tables and figures if I describe the findings in paragraphs?
Almost always, yes. Numbers reported only in running text are hard to check and impossible to scan, and most marking rubrics award credit for clear presentation of data. Use tables for exact values, figures for shapes such as distributions and trends, and keep the paragraph for describing the pattern they show.
What should I write when a statistical test is not significant?
Report the statistics as they are and state that the result did not reach your significance threshold. For example, note the test statistic, the degrees of freedom and the p-value, then say the result was not statistically significant. Do not describe it as proof of no effect or no relationship, because a non-significant test does not establish that.
Conclusion
Start with your research questions, line every result up against the one it answers, and discard anything that answers none of them. Build the evidence set next: verified tables, labelled figures, and a record of what you actually ran.
Then write in a fixed sequence for each result, keep the meaning of your findings out of the chapter, and finish with a verification pass that checks every number against its original output. Get that right and knowing how to write Chapter 4 results of a dissertation stops being the hard part of the submission.