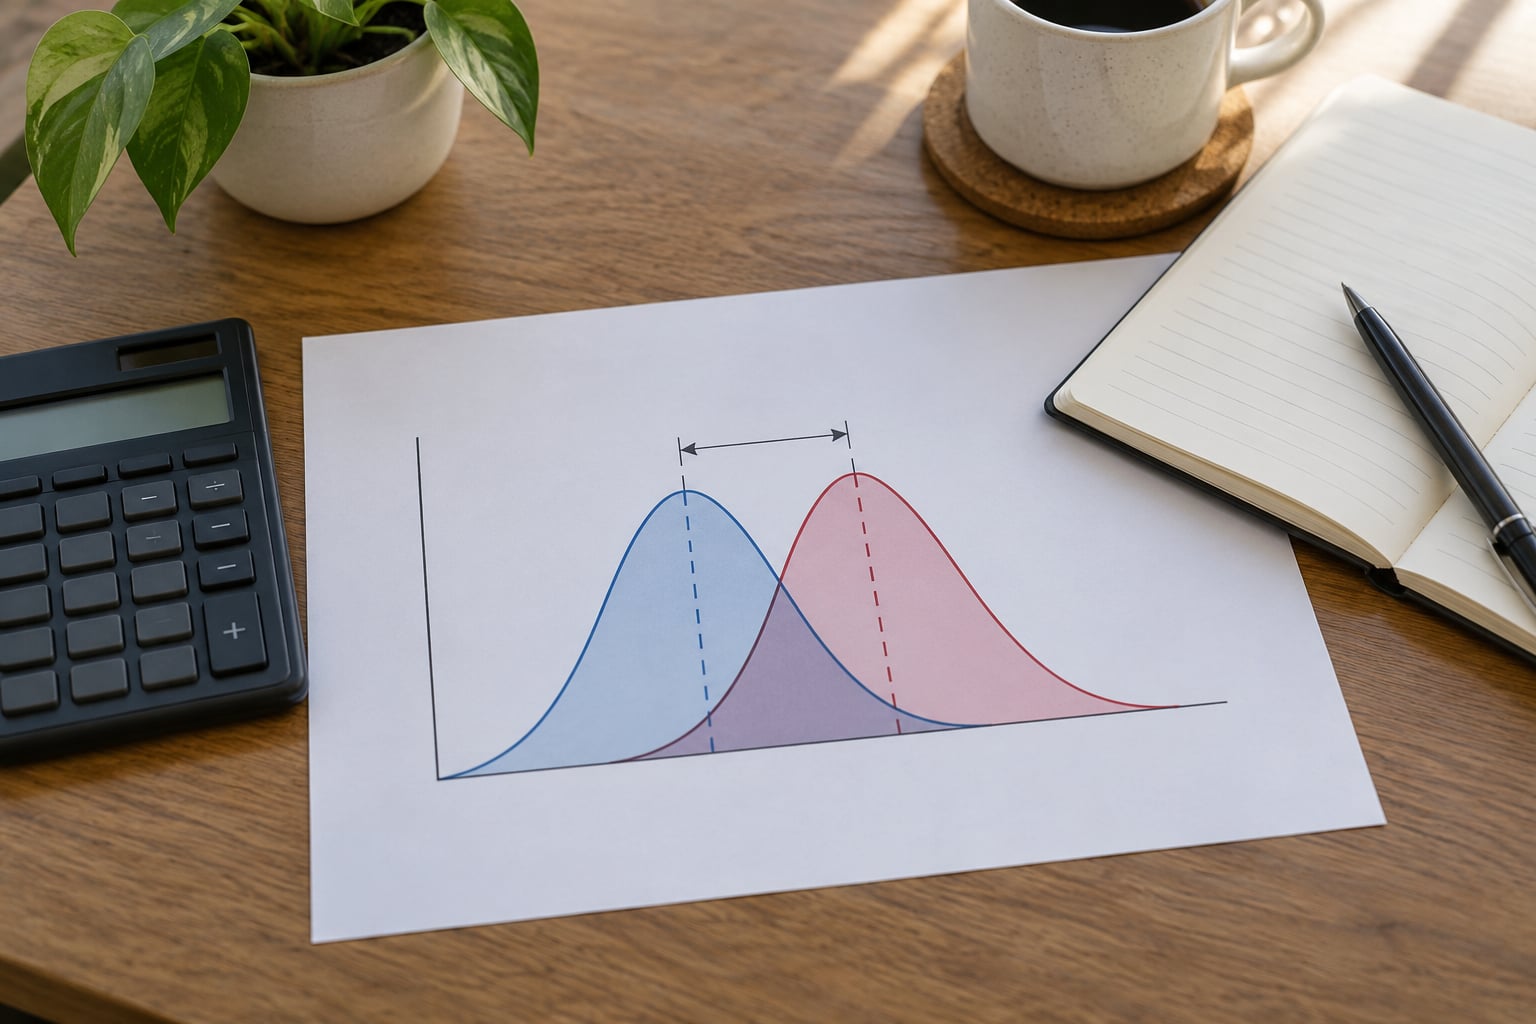
Cohen D tells you how big a difference between two group means is, measured in standard deviations: 0.2 is small, 0.5 is medium, 0.8 is large. If you have ever written “the effect was significant, p < .05” and then wondered whether it actually mattered, this is the statistic that answers that question. Most student results sections would read very differently with one.
Cohen developed the measure in 1988 as a way of describing effect size without relying on sample size alone. A p-value tells you how unlikely a result would be under the null hypothesis. It says nothing about the size of the gap, and it gets smaller the more people you put in the study. Cohen D is the opposite trade: it stays roughly the same when you add participants.
Below is the process I walk my own students through, including the parts that trip people up. Numbers here are worked examples, not results from a real study, so you can follow the arithmetic without hunting for someone else’s data.
Table of Contents
- 1What Does a Cohen D Value Measure?
- 2How to Interpret Cohen D Values
- 3Common Cohen D Value Ranges
- 4Positive and Negative Cohen D Values
- 5How to Interpret Cohen D Values in Common Tests
- 6Cohen D Values and Statistical Significance
- 7How to Report Cohen D Values in Your Research
- 8Why Cohen D Values Can Be Misread
- 9Frequently Asked Questions
- 10What is a good Cohen D value?
- 11Is a negative Cohen D value bad?
- 12Is Cohen D the same as eta squared?
- 13How do I calculate Cohen D from a t-test?
- 14Does a large Cohen D always mean statistical significance?
- 15Should I report a confidence interval for Cohen D?
- 16Conclusion
What Does a Cohen D Value Measure?
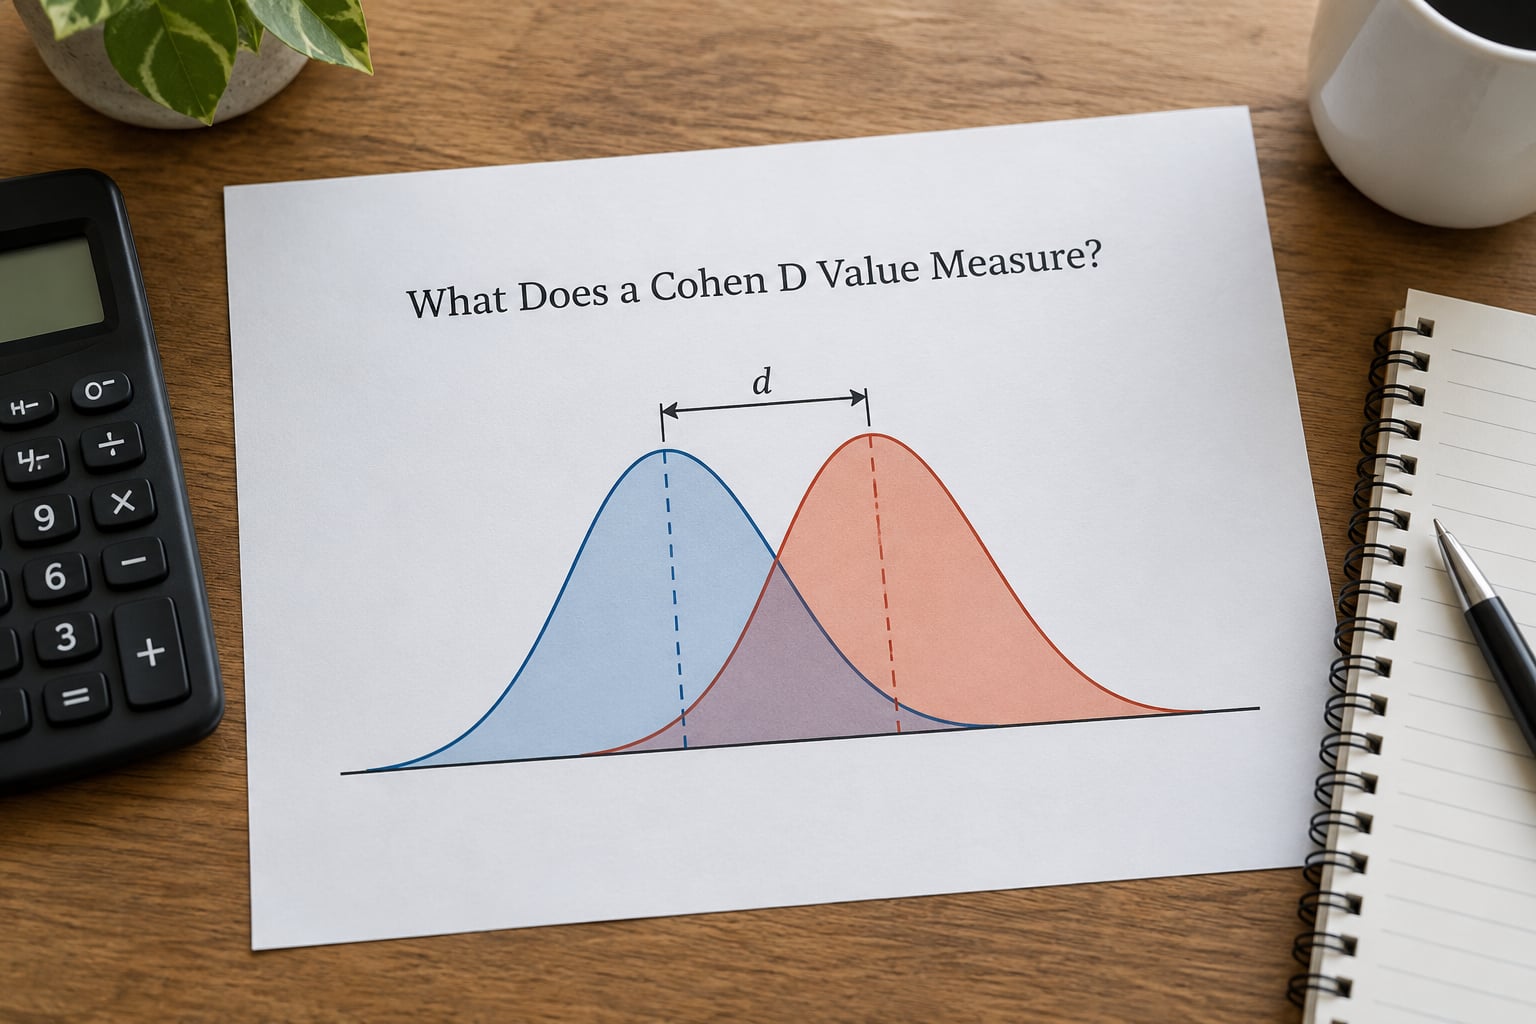
Cohen D is a standardized mean difference. It answers one question: how far apart are the two group means, once you have measured that gap in standard deviations rather than in raw scores.
The formula is short:
d = (M1 − M2) / spooled
M1 and M2 are the two group means. The pooled standard deviation is one estimate of variability that combines both groups, so it does not sit awkwardly above the larger group and below the smaller one.
Because the numerator is a raw score difference and the denominator is a standard deviation, the result has no original units. A score of 0.5 on a 100-point test and a score of 0.5 on a 7-point survey mean the same thing, which is exactly why you can compare effect sizes across studies.
Here is a worked example. Group A scored a mean of 78 on a reading assessment. Group B scored 70. Their standard deviations were 12 and 10 across 25 and 25 participants.
The pooled standard deviation works out to about 11, and the mean difference is 8. So d = 8 / 11 = 0.73. That is a large effect by the conventional labels, and the average person in Group A scored about 0.73 of a standard deviation above the average person in Group B.
Cohen D is not a test. It does not produce a p-value, it cannot reject a null hypothesis, and it does not tell you whether your sample was big enough. It measures magnitude. You need both to make a full claim.
How to Interpret Cohen D Values
Six steps take you from a printed number to a sentence you would be happy to defend in a viva or a methods meeting.
1. Read the sign. A positive value means group one scored higher than group two; a negative value means the reverse. The magnitude is what matters, so most people work with the absolute value, |d|, when comparing to benchmarks.
2. Take the absolute value. |0.83| and |−0.83| describe effects of identical size. Only the direction differs.
3. Compare against benchmarks. 0.2, 0.5 and 0.8 are the traditional cut points. Between them, treat the label as a description of where the value sits, not a verdict.
4. Translate to something a non-statistician can picture. “The treatment group’s average score was 0.73 standard deviations higher” lands better than “the effect was large.”
5. Look at the confidence interval. An interval that runs from 0.15 to 1.30 tells a very different story from 0.65 to 0.81. When the interval crosses zero, your data are compatible with no effect.
6. Check the field. Benchmarks are conventions, not physics. What counts as a meaningful gap in pharmacology, education and psychology research is not the same.
Two extra numbers often travel with Cohen D in published papers. Cohen U3 is the percentage of the comparison group that the treated group beats, so d = 0.8 puts it at about 79 percent. The probability of superiority converts the same information into a chance value, roughly 0.78 here. Both are restatements of the same number, not extra evidence.
Common Cohen D Value Ranges
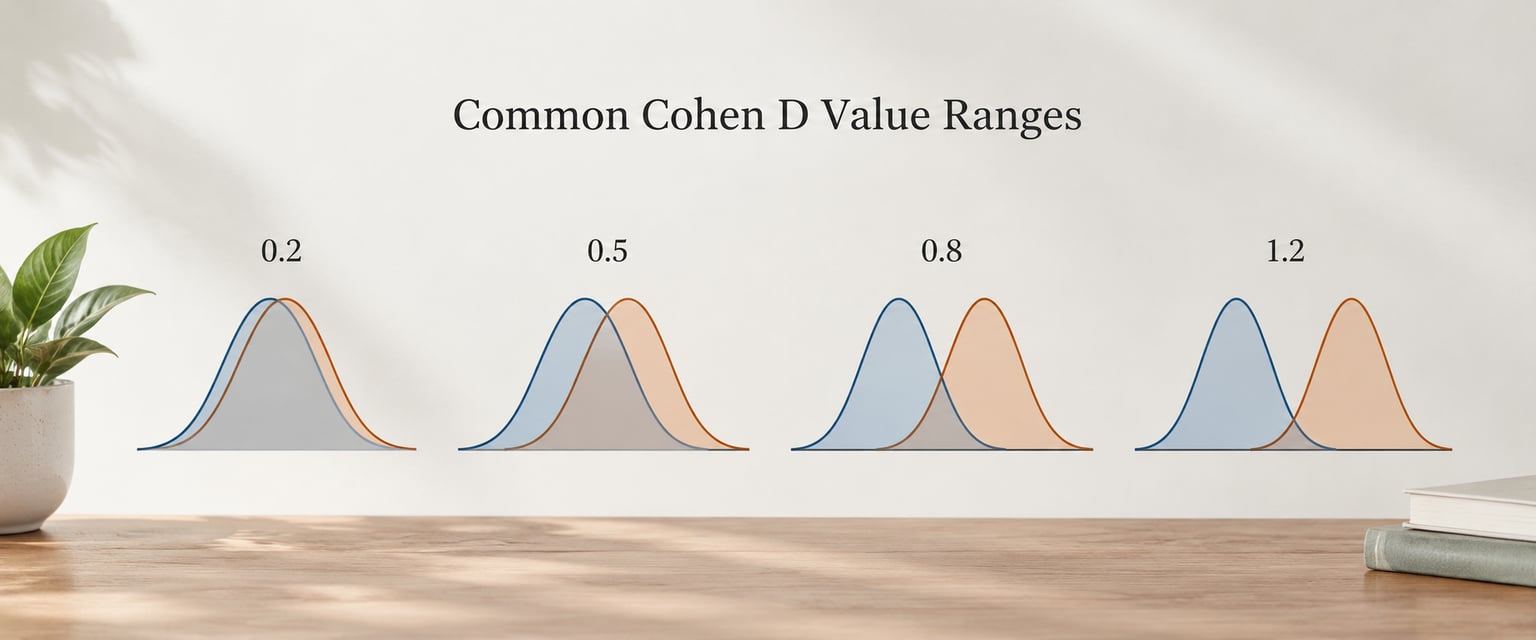
These are the ranges almost every introductory text uses. They describe how much two distributions overlap when both are drawn as normal curves.
| Cohen D | Label | Distribution overlap | Cohen U3 | Example conclusion |
|---|---|---|---|---|
| −1.20 | Large, negative | 9% | 11% | Group B outscored group A by a large margin |
| −0.50 | Medium, negative | 38% | 31% | Group B scored moderately higher |
| −0.20 | Small, negative | 61% | 42% | Group B was slightly ahead |
| 0.00 | No difference | 73% | 50% | No observed difference between the groups |
| 0.20 | Small | 61% | 58% | A small but detectable advantage for group A |
| 0.50 | Medium | 38% | 69% | Group A showed a moderate improvement |
| 0.80 | Large | 17% | 79% | Group A performed substantially better |
| 1.20 | Very large | 9% | 88% | Group A clearly outperformed the comparison group |
Two cautions about reading this table. The overlap figures assume two normal distributions with equal variance; real data rarely fit that perfectly. And a value of 0.42 is not “almost medium” in any rigorous sense, it is simply a smaller effect than 0.58, and you should describe the size of the difference rather than name it.
Positive and Negative Cohen D Values
A negative Cohen D is not an error, and it is never negative in magnitude, only in direction. It appears whenever the first group in the formula has the lower mean.
In an independent samples test where you put the treatment group in slot one and the control group in slot two, a student seminar group scoring below the control group produces a negative d. Flip the order of the groups and the number becomes positive with the same size.
The paired case behaves differently in wording but the same way in arithmetic. For a pretest and posttest design, d is usually computed as (posttest mean − pretest mean) divided by a pooled or pretest standard deviation. A gain yields a positive value; scores that dropped produce a negative one, which simply reports a decline.
The trap is contradictory prose. A result of d = −0.40 is not a “small negative improvement.” Say instead that the comparison group scored 0.40 standard deviations higher, and name which group that is. I have seen this mistake survive into published drafts more than once, usually because the author wrote the sentence before checking which column held the control group.
How to Interpret Cohen D Values in Common Tests
Where you get Cohen D depends on the test, and software rarely hands it to you directly.
Independent samples t-test. When you have two unrelated groups, compute d from the two means and the pooled standard deviation. If you only have the output, recover it from the t statistic: d = 2t / sqrt(df). SPSS does not print Cohen D for a t-test, so this conversion or a manual calculation is the normal route.
Paired samples t-test. For repeated measures, calculate the mean of the difference scores and divide by the standard deviation of those differences. Dividing by a pooled between-groups standard deviation here would badly overstate the effect, because it ignores that the same people answered both times.
One-way ANOVA. A single d does not describe a three-group comparison, which is why eta squared or partial eta squared usually appears instead. You can still report d values by naming the comparison explicitly, for example the treatment group against the control group, with the other groups left out of that particular statement.
Regression. When the predictor is continuous or binary, Cohen D is the same standardized coefficient read as a group difference. For predictors with three or more levels, eta squared family measures apply instead.
Small samples. Cohen D is biased upward with small samples. Hedges g applies a correction factor and is the better estimate, and many journals prefer it below roughly 20 participants per group. In practice the two differ by a few hundredths when samples are moderate.
Cohen D Values and Statistical Significance
The two answer different questions, and treating them as substitutes is the most common error in student writing.
| Situation | p-value | Cohen D | What to write |
|---|---|---|---|
| Large effect, n = 12 per group | > .05 | 1.10 | Large effect but not statistically significant at n = 24; the study lacked power |
| Small effect, n = 400 per group | < .001 | 0.10 | Statistically significant but practically small |
| Medium effect, n = 60 per group | .002 | 0.48 | Both significant and substantively meaningful |
That first row is the one that confuses people. A study of 24 participants can produce a Cohen D of 1.10 that fails to reach significance purely because the standard error around the estimate is enormous. That is exactly the result a small study is expected to give, and it says more about sample size than about the intervention.
The second row is just as common in large survey studies, where hundreds of participants turn a trivial 0.10 gap into a very small p-value. If you report only the p-value there, a reader has no idea whether the gap is worth acting on.
Report both, every time. In education, psychology and social science, practical importance is often judged against the cost of delivering the intervention, and that calculation is invisible to both statistics.
How to Report Cohen D Values in Your Research
APA style expects the statistic, its confidence interval where one is available, the sample size, and a short interpretation in words rather than a label.
For an independent samples t-test: “The treatment group (M = 78.4, SD = 11.2, n = 25) scored higher than the control group (M = 70.1, SD = 10.6, n = 25), Cohen’s d = 0.73, 95% CI [0.17, 1.29], a large effect.”
For a paired samples t-test: “Scores increased from pretest (M = 62.0, SD = 9.4) to posttest (M = 70.5, SD = 8.1), Cohen’s d = 0.61, 95% CI [0.24, 0.98].”
For a one-way ANOVA, report the omnibus effect first, then a d for the specific contrast you care about: “A significant effect of condition was found, F(2, 87) = 6.42, p = .002, partial eta squared = .13. Post hoc comparison of the seminar group against the control group gave Cohen’s d = 0.68.”
Three details catch people out. Use 95 percent confidence intervals unless your field asks otherwise, state which standard deviation you used as the divisor, and say which group came first if the value is negative. I would also name the software and version, since different packages apply small-sample corrections differently.
Why Cohen D Values Can Be Misread
Each of these has shown up in student drafts I have marked, usually with a good study underneath.
Reading the sign as importance. A negative value carries no more or less meaning than a positive one. Fix: take the absolute value before applying any benchmark.
Treating 0.2, 0.5 and 0.8 as cut-offs. These come from Cohen’s laboratory experience in the 1960s, not from a mathematical law. Fix: describe the size of the gap in your own units and mention the benchmark as a comparison, not a verdict.
Ignoring the comparison group. “An effect of 0.9” means nothing until you know which groups were compared and against what baseline. Fix: name both groups in the sentence.
Mixing incompatible versions. Values computed with the control group standard deviation instead of the pooled one will not line up with other studies. Fix: pick one standardizer, state it, and stay consistent. Hedges g is not interchangeable with Cohen D at the third decimal place in small samples.
Equating significance with importance. Already covered above, and it is the single most common fault. Fix: report p and d together and interpret both.
Reporting a single point estimate. A bare 0.62 hides how uncertain it is. Fix: attach a confidence interval whenever your software produces one.
Frequently Asked Questions
What is a good Cohen D value?
A good Cohen D value is one that matches the size of difference that matters in your field and costs little to deliver. The conventional labels are 0.2 small, 0.5 medium and 0.8 large, but a 0.10 gap in a medical outcome can matter enormously while a 0.60 gap in task timing may not. Judge the number against your field benchmarks and the practical consequences, not against the labels alone.
Is a negative Cohen D value bad?
No. A negative Cohen D only tells you that the first group in the formula had the lower mean. Its size is identical to the same number written as positive, so a value of -0.62 describes the same sized gap as 0.62. Reverse the order of your groups and the sign flips. Report it by naming which group scored higher.
Is Cohen D the same as eta squared?
No, they measure different things. Cohen D expresses a difference between two group means in standard deviation units and is signed. Eta squared expresses the proportion of variance in the outcome explained by group membership, is always positive, and has no direct unit. For a two-group comparison they can be converted, but a single value is not a substitute for the other.
How do I calculate Cohen D from a t-test?
For an independent samples t-test, take the absolute t statistic, multiply it by 2, then divide by the square root of the degrees of freedom, so d = 2t divided by the square root of df. For a paired samples test, use the mean of the difference scores divided by their standard deviation instead, because the two groups are the same people. This is how to interpret Cohen D values when software does not print them.
Does a large Cohen D always mean statistical significance?
No. Significance depends on both the effect size and the sample size, so a very large effect in a small study can still produce a p-value above .05. A study of 24 participants can report d = 1.10 and fail to reach significance. That result tells you the study was underpowered, not that the effect is absent or unimportant.
Should I report a confidence interval for Cohen D?
Yes, wherever you can. A point estimate such as 0.62 says nothing about precision, while an interval such as 95% CI [0.18, 1.06] shows the range your data support and makes an interval crossing zero visible to the reader. Most guidance for reporting Cohen D values in journals and theses asks for a 95 percent interval alongside the effect size and sample size.
Conclusion
Start with three things the next time you analyse data. Compute the pooled standard deviation and the mean difference by hand once, so the number stops being mysterious. Report the value with its sign explained, its confidence interval and the sample size. Then describe the size of the gap in your own measures alongside the benchmark, and never let the p-value stand in for that description.