An APA style table in Word is built in five parts: a bold table number, an italic title in title case underneath it, the table body with horizontal rules only and no vertical lines, a note beginning with an italic Note., and a mention of the table in your text. Get that sequence right and the formatting work is done. This guide walks through how to make APA style tables in Word for statistics, including the ribbon paths and the cleanup that statistical output needs before it goes anywhere near a manuscript.
The version that matters here is APA 7th edition, the current Publication Manual. The rules below follow it, including the italic table title that replaced the label line used in APA 6.
Table of Contents
- 1What You Need
- 2How to Make APA Style Tables in Word for Statistics
- 3Step-by-Step
- 4Step 1: Plan the Table Content
- 5Step 2: Insert and Size the Table
- 6Step 3: Add the Table Number and Title
- 7Step 4: Format Column Headings and Values
- 8Step 5: Apply APA Borders and Spacing
- 9Step 6: Add Notes, Labels, and Source Information
- 10Step 7: Check the Final Table
- 11Worked Examples for Common Statistical Tests
- 12A descriptive statistics table in APA 7
- 13An ANOVA table in APA 7
- 14A multiple regression table in APA 7
- 15Common Mistakes
- 16Frequently Asked Questions
- 17Should I use vertical lines in an APA table?
- 18How do I insert a table number and title in Microsoft Word?
- 19Where should APA tables be placed in a research paper?
- 20How many decimal places should I use in an APA statistics table?
- 21Can I use a built-in Microsoft Word table style for an APA table?
- 22How do I format a statistical table when a value needs a footnote or note?
What You Need
Four things, and the first two do most of the work:
- Microsoft Word (Windows, Mac, or Word Online). The ribbon paths below are Windows-first, and I flag the Mac differences where they exist.
- Your statistical results, in whatever shape they currently take: SPSS Output Viewer, Stata output, an R console printout, or an Excel range.
- A copy of the APA 7th edition manual or your programme’s style sheet. Institutional guides sometimes override APA defaults, so the manual your department hands you wins over anything here.
- Ten to twenty minutes per table, the first time. It gets faster once the border settings become muscle memory.
Before you insert anything, set the page and the font. Margins should be 1 inch (2.54 cm) on all four sides, and the whole paper is double-spaced, including the inside of the table.
Acceptable fonts under APA 7 are Times New Roman 12 pt, Georgia 11 pt, Calibri 11 pt, and Arial 11 pt. Use the same one everywhere in the table that you use in the body text. A table pasted from SPSS usually arrives in Courier New at 9 pt, which is not on the list.
How to Make APA Style Tables in Word for Statistics
Every APA 7 table has the same five parts, in the same order, and each part has a fixed format.
| Part | Format | Position |
|---|---|---|
| Table number | Bold, Arabic numeral, no suffix letters, no colon | Above the table, on its own line |
| Table title | Italic, title case, brief, no ending period | Directly under the number |
| Table body | Horizontal rules only, three of them; no vertical lines; no shading | The table itself |
| Table note | Starts with italic Note., then general, specific, and probability notes in that order | Below the table, left aligned |
| In-text mention | Referenced by number before it appears, with enough detail to stand alone | In the body of the paper |
Numbering runs sequentially in Arabic numerals, in the order the tables are mentioned in your text. APA 7 dropped the old 3a, 3b, 3c suffix style; if two tables are related, combine them into one with spanner headings. Tables and figures number independently, so Table 3 and Figure 3 can both exist. Appendix tables get their own series: Table A1, Table A2, and so on.
Placement depends on what you’re writing. For a student paper, a thesis, or a dissertation, each table goes after the paragraph that first mentions it. For a journal manuscript, most journals now want tables embedded near their first mention rather than collected at the end, but check the submission guidelines, because this is the one rule that publishers override most often.
If your old manuscript or a downloaded template still shows the word “Rule” centred above the table, that is APA 6. In APA 7 that line is gone, and the title simply moves up.
Step-by-Step
Step 1: Plan the Table Content
Decide what goes in the table before you open Word, and write it out in a list: the statistic, the comparison groups, the sample sizes, the test or model details, and every value with its decimal places. A table built without this list ends up with three extra columns nobody will read.
If the data came out of software, clean it first. Pasting straight from the SPSS Output Viewer is the single most common way tables end up wrong:
- Copy only the cells you need, not the whole output block.
- In Word, use Home > Paste > Paste Special > Unformatted Text. This strips the Courier New styling, the fixed column widths, and most of the shading.
- Paste into a fresh table rather than keeping the pasted grid. Insert > Table, size it to your row and column count, then move the text across cell by cell.
- Delete the empty index column SPSS adds to its output tables. It numbers rows for navigation and means nothing in a manuscript.
- Set decimal places so every value in a column has the same number. M = 4.23, SD = 1.1, N = 128 is a formatting failure, not a rounding decision.
Excel is easier but brings gridlines and bold headers with it. Paste the range as unformatted text too, and expect to strip the header bolding.
Step 2: Insert and Size the Table
Go to Insert > Table and either drag across the grid or use Insert Table to type an exact column and row count. Count your planned list from Step 1, not the shape of the software output.
Click anywhere in the table and the Table Design and Layout tabs appear. Use Layout > AutoFit > AutoFit Contents first, then narrow the stub column manually so the numeric columns are not stretched across the page.
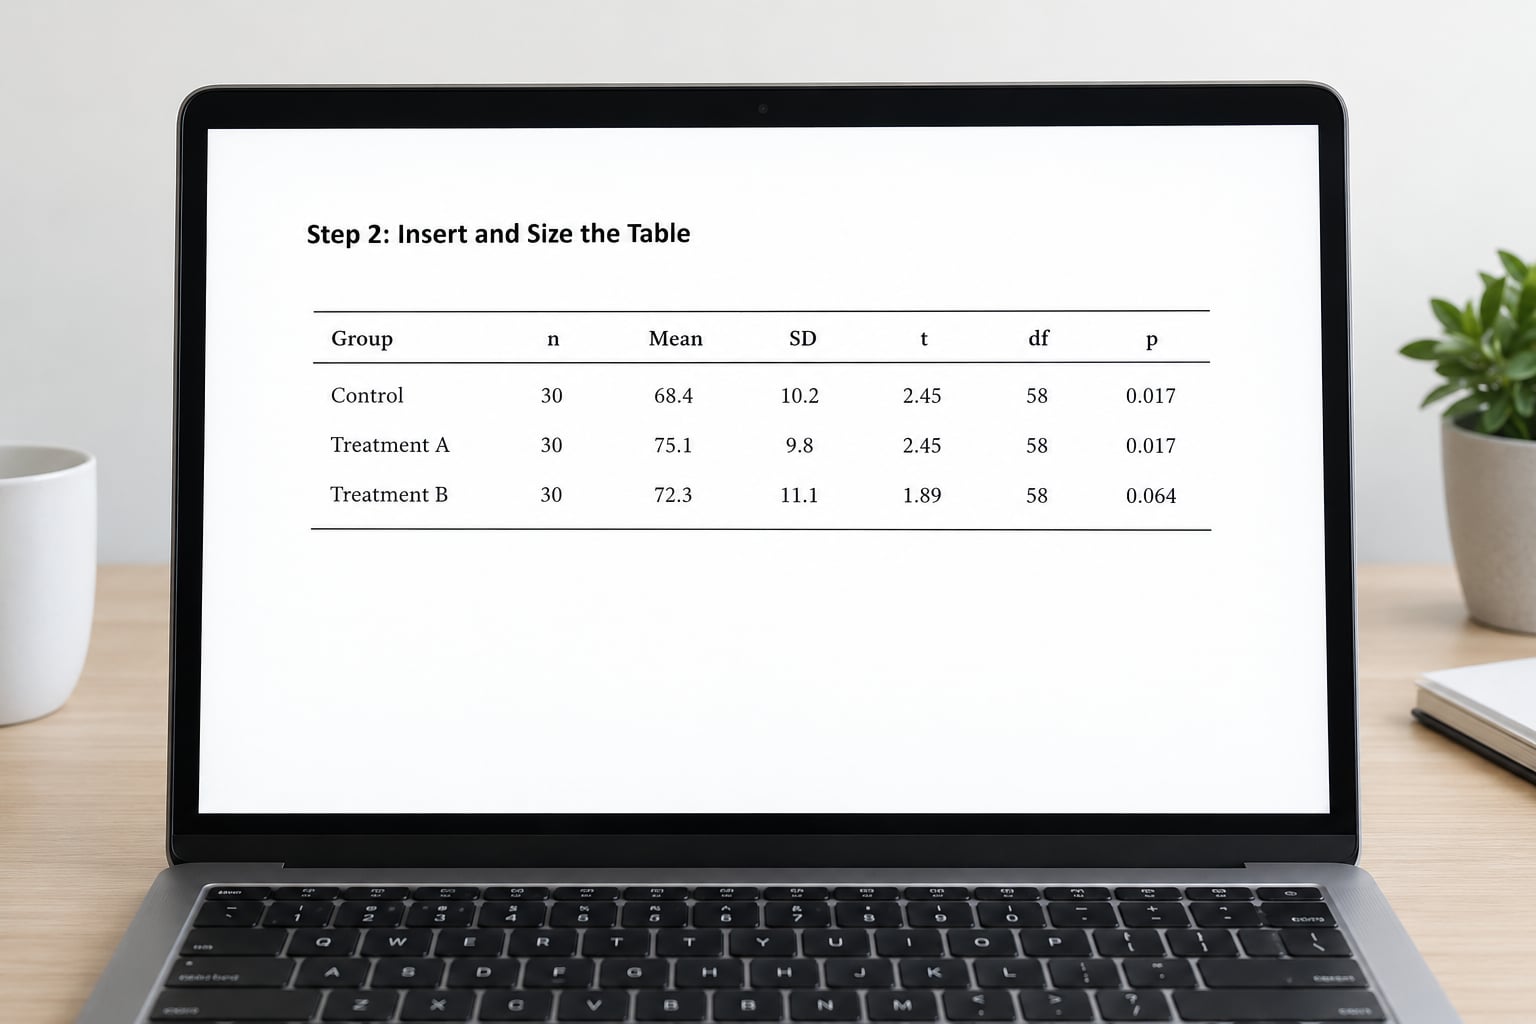
Leave the table flush with the left margin. Do not centre it, and do not indent it. Keep the whole table on one page if you can; a table split across a page break with no header repeated on the second page is the thing reviewers notice first.
Step 3: Add the Table Number and Title
Click above the table and type Table 1 in bold, with no colon and nothing after it. Press Enter, then type the title on the next line in italics with title case, such as Descriptive Statistics for Response Time by Experimental Condition.
The title should read as a sentence a reader could follow with no body text in front of it. Avoid analysis names like “Chart Showing the ANOVA Results”. If your title needs a full sentence with a period at the end, that is usually a figure caption rather than a table title.
On Mac, the bold and italic shortcuts are the same Cmd-based keys, but the menu names differ: Format > Font, and the border controls sit under the Table Design tab as well.
Step 4: Format Column Headings and Values
Type the column headings in the top row: the stub heading first, then one heading per numeric column. APA 7 permits two heading lines when you need one, with the shorter one on top. Center numeric column headings above their columns.
Left-align text in the stub column, and align numbers on the decimal. Word’s Layout > Align Text > Decimal Align does this once you select the column, and it looks far tidier than centering numbers with ragged edges.
Italicise statistical symbols in headings only: M, SD, F, t, p, N, M2, SD2. The values themselves stay roman.
Lead zeros are optional but should be consistent; most psychology programmes drop them, so p = .032 and t = 2.14. Correlation coefficients rounded to two decimals and every other statistic rounded to two or three is a defensible, consistent choice. Spell out what you chose in the note.
For a spanner heading, such as Condition spanning three columns, select the cells, right-click, and choose Merge Cells, then type the heading once in the merged cell.
Step 5: Apply APA Borders and Spacing
Select the entire table, go to Table Design > Borders > No Border. Everything disappears, including the gridlines. If grey gridlines remain, they are the non-printing Word gridlines, not borders: turn them off with Table Layout > View Gridlines.
If a table came in with grey cell shading, select the whole table and choose Table Design > Shading > No Color. Shading and background fills are not permitted in APA 7.
Now add back exactly three horizontal rules by selecting cells and using Borders > Bottom Border:
- A rule above the column-heading row, across the full table width.
- A rule below the column-heading row.
- A rule at the bottom of the last row.
To add a fourth line for a spanner heading or a footnote row, that is allowed, but keep it light. No vertical lines anywhere, inside or between cells.
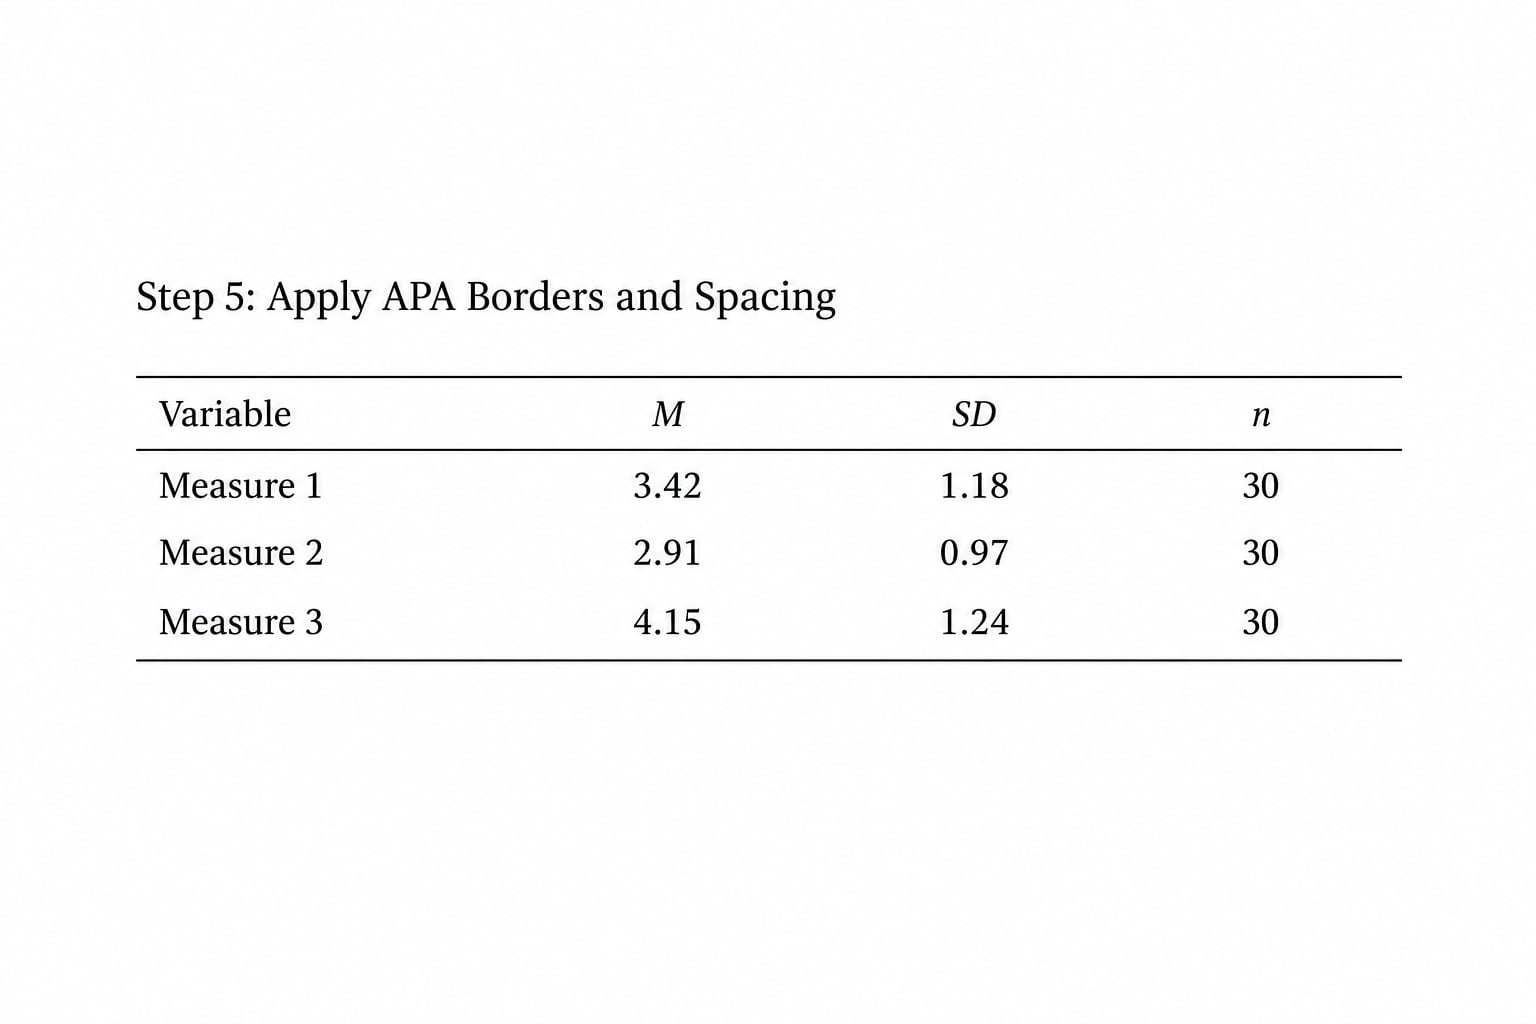
Set the paragraph spacing inside every cell to double: select the table, open the Paragraph dialog, set line spacing to Double, and set spacing before and after to 0 pt. The note beneath the table is double-spaced too.
Step 6: Add Notes, Labels, and Source Information
Press Enter below the table to create a new paragraph and type Note. in italics, followed by a non-italic space and your note text. Three kinds of note go under the table, in this order:
- General note explains the table as a whole, defines abbreviations, and states the rounding convention: M = mean; SD = standard deviation.
- Specific notes are marked with superscript letters and explain particular rows, conditions, or exceptions.
- Probability notes give the asterisk key last: *p < .05. **p < .01. ***p < .001.
For a table adapted from a published source, add a permissions line above the table number rather than in the note, and place the full citation in your reference list. Tables you built yourself from your own data still need a note, even a short one.
Step 7: Check the Final Table
Run this list before the table goes anywhere near a supervisor or a journal:
- Number is bold, Arabic, sequential, with no colon.
- Title is italic, title case, and understandable on its own.
- Only three horizontal rules; zero vertical lines; zero shading.
- Statistical symbols italic in headings, roman in the body.
- Decimal places consistent within every column.
- Note present, starting with italic Note., in general-specific-probability order.
- Every abbreviation defined in the note.
- Table mentioned in the text by number before it appears.
- Double-spaced inside and below.
- Font and size match the body of the paper.
If you produce many tables, the R package apaTables (function apa.aov.table() and friends) can generate a Word file with these conventions already applied. For a one-off table, building it by hand is faster.
Worked Examples for Common Statistical Tests
A descriptive statistics table in APA 7
A finished descriptive table, laid out the way Word would render it:
Table 1
Descriptive Statistics for Response Time by Experimental Condition
| Condition | M | SD | N |
|---|---|---|---|
| Control | 4.23 | 1.18 | 128 |
| Treated | 5.07 | 1.24 | 131 |
Note. M = mean; SD = standard deviation; N = sample size. Response time in seconds. Values are rounded to two decimal places.
An ANOVA table in APA 7
Same rules, more columns. A one-way between-groups ANOVA conventionally reports source, degrees of freedom, mean square, F, p, and an effect size.
Table 2
One-Way Between-Groups ANOVA for Response Time by Condition
| Source | df | MS | F | p | η2 |
|---|---|---|---|---|---|
| Between groups | 1 | 6.92 | 4.61 | .033 | .017 |
| Within groups | 257 | 1.50 |
Note. df = degrees of freedom; MS = mean square; p = significance level; η2 = partial eta squared.
A multiple regression table in APA 7
Regression tables report the unstandardized coefficient, its standard error, the standardized beta, the test value, and p in that order. Confidence intervals in square brackets are optional in APA 7 but common in psychology.
Table 3
Multiple Regression Predicting Response Time From Sleep Quality and Work Hours
| Predictor | B | SE B | β | t | p |
|---|---|---|---|---|---|
| Constant | 4.09 | 0.21 | 19.48 | < .001 | |
| Sleep quality | -0.41 | 0.09 | -.32 | -4.56 | < .001 |
| Work hours | 0.14 | 0.05 | .19 | 2.88 | .004 |
Note. B = unstandardized regression coefficient; SE B = standard error of the unstandardized coefficient; β = standardized regression coefficient; p = significance level. N = 259.
Common Mistakes
These are the errors that come back in comments, in rough order of how often they turn up.
Gridlines left in place. The fix is Table Design > Borders > No Border, then Table Layout > View Gridlines off, because what is left is Word’s guide grid and not a border at all.
A grey or blue cell fill that survived the paste. Select the whole table, then Table Design > Shading > No Color. Pasted output often carries its own background colour that borders alone will not remove.
Too many bold elements. APA 7 bolds only the table number and, in some styles, the column headings. Bolding the stub entries and the values makes the table shout and hides the numbers that matter.
Inconsistent decimals within a column. Pick the precision from the smallest meaningful value in that column and apply it to all of them. Use Format Painter or the number format dialog rather than retyping.
No note at all. This is the most common reason a statistical table is sent back. Even a one-line note defining M, SD, and N is required when you use abbreviations or asterisks.
The table buried inside a paragraph. A table is a block element. Break the paragraph, insert the table on its own line, and keep it flush left.
Using Word’s automatic caption tool. Insert > Caption produces “Table 1: Title” with a colon, grey text, and the title below the number. That single click breaks three APA rules, so type the number and title by hand instead.
Reporting the same numbers twice. If a figure shows the distribution and the table lists every value, most journals want the table alone. Choose one; a chart for a pattern, a table for exact values.
Frequently Asked Questions
Should I use vertical lines in an APA table?
No. APA 7th edition tables use horizontal rules only, and there are three of them: one above the column headings, one below them, and one at the bottom of the table. Select the table and choose Table Design u0026gt; Borders u0026gt; No Border, then add the three rules back individually. If grey lines still show after removing all borders, they are Word’s non-printing gridlines; switch them off with Table Layout u0026gt; View Gridlines.
How do I insert a table number and title in Microsoft Word?
Click in the paragraph directly above the table, type the number in bold with no colon, then press Enter and type the title in italics using title case. Do not use Insert u0026gt; Caption, because Word’s caption tool adds a colon, grey text, and places the title below the number. APA 7 dropped the old label line that sat between the number and the title in APA 6.
Where should APA tables be placed in a research paper?
For a thesis or dissertation, place each table immediately after the paragraph that first mentions it, and number tables in the order they appear in your text. Journal submissions vary: many now ask for tables embedded near the first mention, while others still want them collected after the references. Always check the journal’s submission guidelines, because placement is the rule publishers override most often.
How many decimal places should I use in an APA statistics table?
Whatever is consistent within each column and meaningful for the data. Two decimals for means, standard deviations, test values, and correlations, and three for p values is a common and defensible choice. APA 7 allows leading zeros to be dropped, so p = .032 rather than p = 0.032, as long as you apply that choice to every value. State the rounding convention in the general note.
Can I use a built-in Microsoft Word table style for an APA table?
You can use a table style as a starting point, but no built-in style matches APA 7 out of the box. Word’s table styles all include vertical lines, and most add shading or heavy borders. Apply a plain style, then remove every border and add back the three horizontal rules manually. Many downloadable templates are still built for APA 6 and keep the old Rule label line, so check any template before you trust it.
How do I format a statistical table when a value needs a footnote or note?
Put a superscript letter next to the value in the table body, then define it beneath the table in a specific note. The note section has a fixed order: general note first, which explains the table as a whole and defines abbreviations; then specific notes marked with superscript letters; then the probability note giving the key, such as p below .05 with one asterisk and p below .01 with two. Begin the whole block with Note. in italics.
Build one of these by hand once and the other two follow the same muscle memory. If a supervisor hands back a Word file with a grid, a missing note, and a colon after the table number, those three fixes cover most of what was flagged. Getting how to make APA style tables in Word for statistics right comes down to those five parts in order: bold number, italic title, horizontal rules only, a note underneath, and a mention in your text.