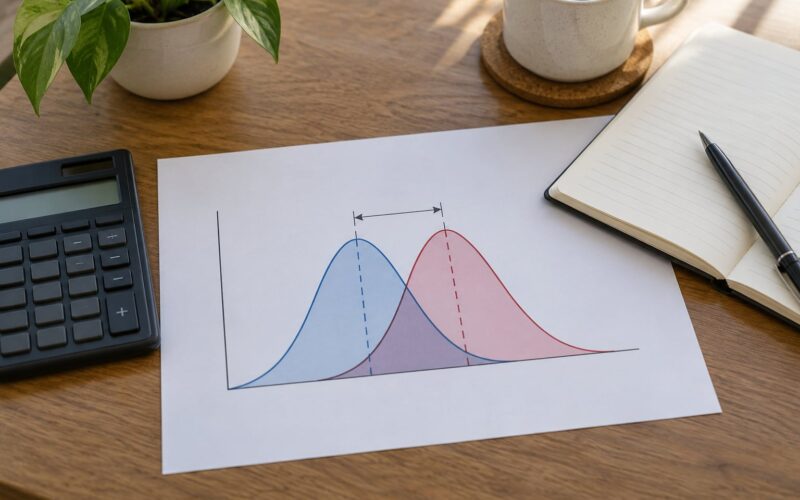
Knowing how to read a Levene test result takes about ten seconds: find the Sig. (2-tailed) value in your output and compare it with the significance level you chose before you ran the analysis. If Sig. is greater than .05, you may treat the group variances as equal and use the pooled-variance test; if Sig. is below .05, the variances differ and you switch to Welch’s correction. That is the whole decision, and it comes down to one cell in the output table.
The rest of this guide takes that ten seconds and stretches it out: what the test is actually asking, what each cell of the output table means, how to find the p-value in SPSS, Excel, R, Python, Stata, SAS, JASP and Jamovi, and how to write the result into your paper. The output tables students email in make it obvious where people get stuck, and it is almost always the same three places.
Worth saying up front so nobody panics later: a significant Levene’s test does not mean your analysis failed. It means one assumption check came back significant, which is information, not a verdict on your project.
Table of Contents
- 1What Does a Levene Test Tell You?
- 2How to Read a Levene Test Result
- 3Step 1: Confirm you are on the Levene row, not the ANOVA row
- 4Step 2: Read the F value, then move on
- 5Step 3: Read df1 and df2
- 6Step 4: Compare Sig. with the alpha level you set in advance
- 7Step 5: Cross-check against the Descriptives table
- 8Interpreting the Levene Test Statistic and P-Value
- 9Levene Test Results in SPSS, R, Stata, and SAS
- 10How to Report a Levene Test in Your Study
- 11Common Levene Test Mistakes and Interpretation Problems
- 12Frequently Asked Questions
- 13What does a significant Levene’s test mean?
- 14Is Levene’s test one-tailed or two-tailed?
- 15What if my Levene’s test p value is 0.000?
- 16Can I still run ANOVA if Levene’s test is significant?
- 17Why do SPSS and R give different Levene’s test results?
- 18What are the limitations of Levene’s test?
- 19Conclusion
What Does a Levene Test Tell You?
Levene’s test checks one assumption: whether the groups in your study have equal population variances. The technical phrase is homogeneity of variance, and you will see it spelled as homoscedasticity in textbooks and in the car package documentation for R.
The null and alternative hypotheses are simpler than they look:
- H0 (null): the population variances are equal across all groups, sigma-squared one equals sigma-squared two and so on.
- H1 (alternative): at least one population variance differs from the others.
Levene’s test works by converting every score into its absolute deviation from its own group mean, then running a one-way ANOVA on those absolute deviations. If the between-group spread of those deviations is bigger than you would expect by chance under equal variances, the variances are not equal. That is the mechanism behind the Levene Statistic, and it is why the test tolerates non-normal data better than Bartlett’s test does.
Here is what it does not tell you. It does not test whether the group means are equal; that is the job of the one-way ANOVA or the t-test that follows it. It does not tell you how much the means differ. And it does not tell you whether your data are normally distributed, which is the assumption people most often assume it covers.
The three ANOVA assumptions it belongs to are:
- Independent observations: each case belongs to only one group, and cases within a group are independent.
- Normality of residuals within each group: the distribution of scores around each group mean is roughly normal, especially for small groups.
- Homogeneity of variance: the population variance is the same in every group. Levene’s test is the check for this third one.
Why does the third assumption matter? With unequal group sizes, a standard one-way ANOVA and the pooled-variance independent-samples t-test both control the Type I error rate poorly when variances differ. You get a p-value that is too small more often than your alpha level allows. In a balanced design the whole issue largely disappears, which is why the test matters most when your group sizes are lopsided.
How to Read a Levene Test Result
Read the output top to bottom, left to right, in five steps. Most output tables put the pieces in exactly this order, so following the layout keeps you from grabbing the wrong number.
Step 1: Confirm you are on the Levene row, not the ANOVA row
Output often contains two F statistics that look identical in shape. The ANOVA table has its own F with its own p-value, and a t-test output has a t. A Levene row is identified by the words Test of Homogeneity of Variances in SPSS or hovtest = levene in the syntax window. If you cannot find the words Levene anywhere near the number, you are looking at the wrong statistic.
Step 2: Read the F value, then move on
The Levene Statistic is an F value from an F distribution. Note it down for reporting, but do not interpret it on its own. A large F is not automatically a problem and a small F is not automatically a pass, because the F you got only matters against the F critical value for your degrees of freedom and your alpha level. SPSS hides that critical value, which is why students stare at the F hoping to read something into it. There is nothing to read.
Step 3: Read df1 and df2
These are the degrees of freedom for the numerator and denominator. For k groups and a total sample size of N, df1 is k minus 1 and df2 is N minus k. Three groups of 20 give df1 = 2 and df2 = 57. You need both for the write-up, and there is no interpretation attached to them beyond identifying which F distribution applies.
Step 4: Compare Sig. with the alpha level you set in advance
This is the decision. Levene’s test is always treated as two-tailed, so SPSS labels the column Sig. (2-tailed), and there is no one-tailed version of this decision to worry about. Compare the number to your alpha level:
- Sig. greater than .05: fail to reject H0. No evidence that the variances differ, so the homogeneity assumption is acceptable and you use the pooled-variance test.
- Sig. below .05: reject H0. The variances differ, so you switch to Welch’s t-test, Welch’s ANOVA or Games-Howell, depending on your design.
Equality of Sig. and .05 exactly is vanishingly rare with real data, and if you ever hit it, treat it as non-significant, which is the convention.
Step 5: Cross-check against the Descriptives table
Find the Std. Deviation column for each group in the Descriptive Statistics table. If one group has a standard deviation roughly twice the others, and the Levene result is significant, the two pieces of evidence agree and your interpretation is safe. If Levene came back non-significant but the standard deviations are wildly different, look again: you may have read the wrong row, or a few extreme outliers are hiding inside the group with the large spread.
Interpreting the Levene Test Statistic and P-Value
Start with the p-value, not the F. The size of the F statistic alone does not determine significance, because the same F value can be significant with large df and nowhere near significant with small df. Here are two worked examples with the interpretation written out.
Example A, not significant: Levene Statistic = 1.872, df1 = 2, df2 = 57, Sig. (2-tailed) = .126. Alpha was set at .05 before the analysis. The reported p-value of .126 is greater than .05, so you fail to reject the null hypothesis. The variation in scores is not detectably different across the three groups, so the homogeneity assumption holds. Report the pooled-variance version of your t-test or ANOVA and move on.
Example B, significant: Levene Statistic = 6.412, df1 = 1, df2 = 38, Sig. (2-tailed) = .017. That p-value is below .05, so you reject the null hypothesis and conclude the variances differ between the two groups. You do not report the pooled-variance t-test from the same output. You go back and read the Equal variances not assumed row, which is Welch’s t-test, and report that instead.
Two habits make this faster for most people. First, decide your alpha level before you look at the p-value, and write it in your analysis notes. Choosing .05 because the result came out at .049 is a form of p-hacking, and setting .10 because you are nervous about the assumption check is closer to legitimate but still needs to be a prespecified decision. Some methodologists argue for .10 on pre-tests like this one, because the cost of missing unequal variances is landing on the wrong downstream test. That is a defensible position if you state it in advance; switching after seeing the number is not.
Second, write your decision down in one sentence before you move to the next table. “Sig. .017 below .05, variances unequal, use Welch” takes fifteen seconds and stops you from re-deciding every time you reopen the file at midnight.
Levene Test Results in SPSS, R, Stata, and SAS
The mathematics is identical everywhere. What changes between packages is the label on the column and where the result sits in the output, which is why people search for a Levene result and cannot find one even though they have it in front of them. The table below maps the same three numbers across the common packages.
| Software | Where the result appears | Label for the F value | Label for the p-value |
|---|---|---|---|
| SPSS | Automatically inside Independent-Samples T Test output, below the t-test table; also produced by One-Way ANOVA when you tick Homogeneity | Levene Statistic | Sig. (2-tailed) |
| R (base) | Returned by oneway.test(y ~ group, data = df, var.equal = FALSE) as a data frame | F value | Pr(>F) |
| R (car package) | car::leveneTest(y ~ group, data = df), which reports which variant ran | F value | Pr(>F) |
| R (rstatix) | rstatix::levene_test() returns a tibble labelled “Levene’s test” | statistic | p |
| Python (SciPy) | scipy.stats.levene(a, b, center = “median” or “mean”) returns a LeveneResult object | statistic | pvalue |
| Stata | test hovtest = levene, or the oneway command with the equal() option | F | Prob > F |
| SAS | Hovtest=LEVENE option in the PROC MEANS or PROC GLM step | F Value | Pr > F |
| JASP | Under Classical: ANOVA > Assumption checks, listed as Levene’s test | F | p |
| Jamovi | Independents T-Test output, in the Assumptions tab | F | p |
| Excel | No built-in Levene’s test; you compute the absolute deviations and run Data Analysis > ANOVA: Single Factor yourself | F | Computed from the ANOVA table |
One detail in that table causes more confusion than anything else on this page. SPSS reports the mean-based version of the test by default, while car::leveneTest in R uses the median as the centre by default and SciPy’s levene defaults to the median too unless you set center = "mean". The median-based version is the Brown-Forsythe test, and it is less sensitive to skewed data. The same dataset can therefore give you two different F values and two different p-values depending on which package produced them, and both are legitimate.
Compare like with like: if you report SPSS’s mean-based result, set center = "mean" in Python or center = mean in R before you decide the two disagree. The median-based default also explains the other half of the story, because it is the one many researchers trust more for skewed or outlier-heavy data.
How to Report a Levene Test in Your Study
Report the test the same way you report any other inferential statistic: name the test, give the statistic, give both degrees of freedom, give the exact p-value to three decimals, and state what you concluded. The sentence about the assumption is what earns marks, because it shows you did something with the result.
Non-significant result template:
A Levene’s test of equality of variances was not significant, F(2, 57) = 1.87, p = .126, so the assumption of homogeneity of variance was met.
Significant result template:
A Levene’s test showed that the group variances differed significantly, F(1, 38) = 6.41, p = .017. A Welch’s independent-samples t-test was therefore used in place of the equal-variance test.
Fill-in-the-blank version for a dissertation methods section:
The homogeneity of variance assumption was assessed with Levene’s test, F(df1 = __, df2 = __) = __, p = ___. Because the result was [not] significant, the [pooled-variance / Welch-corrected] version of the analysis is reported.
Where it goes matters too. The test belongs in the results or analysis section, not in a limitations discussion, and not in a methods section, since the test itself is analysis rather than design. If you ran Levene’s as a prespecified assumption check, a one-line mention that it was planned in advance is enough. If you switched tests after seeing the result, say that you did, and give both p-values if you report anything else.
Common Levene Test Mistakes and Interpretation Problems
Reading significant as bad. For most hypothesis tests a significant result is the interesting one. For an assumption check it means the assumption failed, so you change which test you report. Your study did not become invalid; you simply lost the option of the pooled-variance version. Students on statistical forums describe this moment as the one where they nearly abandoned a study that was fine, which is the opposite of what the test does.
Treating Sig. greater than .05 as proof that the variances are equal. Failing to reject the null is not the same as confirming equality. It means your data did not give you enough evidence to say the variances differ, which is a weaker statement. Write “no evidence that the variances differ” rather than “the variances are equal”.
Confusing the Levene F with the ANOVA F or the t-test F. Both are F or t-shaped numbers on nearby rows. The Levene row is always the one whose F is built from absolute deviations, and it sits in a table titled Test of Homogeneity of Variances or under a hovtest line.
Assuming normality clears everything. Normality and homogeneity are separate assumptions. Plenty of data are perfectly normal within each group and still have one group with a much larger spread. Levene’s test is the only check for the second one.
Comparing SPSS p-values to R p-values on identical data. This is the mean-based versus median-based default mismatch described above. Set the centre option explicitly in R and Python, or report which variant you used.
Reporting F without degrees of freedom. An F of 6.41 means nothing to a reader without knowing it is F(1, 38). Both df values are always required.
Switching tests silently. If you pretest and then switch to Welch, say so in the write-up. Readers who see a pooled-variance test they cannot verify against a significant Levene’s result will assume you never ran the check.
Using the F critical value table when the software already gave you the p-value. Looking up the critical F is useful for exams and for checking the software, but if you have the Sig. column, use it. Comparing your F against the critical value for your alpha and df should land on the same decision every time.
Frequently Asked Questions
What does a significant Levene’s test mean?
A significant Levene’s test means the assumption of equal population variances is not supported, so the pooled-variance assumption behind a standard one-way ANOVA or independent-samples t-test fails. It does not invalidate your study or your data. You report a variance-corrected alternative instead: Welch’s t-test for two groups, Welch’s ANOVA or Games-Howell for three or more groups.
Is Levene’s test one-tailed or two-tailed?
Levene’s test is always treated as a two-tailed test, which is why SPSS labels the column Sig. (2-tailed). There is no one-tailed version of the variance-equality decision to choose. You compare that single p-value with your preselected alpha level of .05 and make one decision: variances treated as equal, or variances treated as unequal.
What if my Levene’s test p value is 0.000?
A p value printed as .000 means the value was smaller than three decimal places, not that it is exactly zero. A p value can never be zero. Report it as p u0026lt; .001 in APA style, which is what journal guidelines expect. A very small p on a homogeneity test indicates clearly different variances, so plan on Welchu0026#039;s correction.
Can I still run ANOVA if Levene’s test is significant?
Yes, and you should. A significant Levene’s result means you switch the reporting version rather than abandoning the analysis. For two groups read the Equal variances not assumed row, which is Welch’s t-test. For three or more groups run Welch’s ANOVA in R or the Welch option in jamovi, or use Games-Howell post-hoc comparisons in SPSS.
Why do SPSS and R give different Levene’s test results?
The two packages default to different variants of the test. SPSS uses the mean-based version, while R’s car::leveneTest and SciPy’s scipy.stats.levene default to the median-based Brown-Forsythe version, which is less sensitive to skewed data. Set center to mean in those packages and the results should match your SPSS output for the same data.
What are the limitations of Levene’s test?
Levene’s test has low power in small samples, so it often fails to detect genuinely unequal variances and you proceed with a pooled-variance test that was never appropriate. It also becomes unreliable with very small groups or heavy outliers in the mean-based version. It tests variance equality only, never normality, and it is largely unnecessary in balanced designs where group sizes are close.
Conclusion
Start at the Sig. (2-tailed) cell. Check that the row above it says Levene, note the F and the two degrees of freedom for the write-up, and compare the p-value with the alpha level you chose before you looked at the data. Above .05 means the homogeneity assumption stands and you report the pooled-variance result. Below .05 means you switch to Welch’s t-test, Welch’s ANOVA or Games-Howell, and you say in your write-up that you did.
That is really the whole of how to read a Levene test result, and none of it takes more than a minute. This guide was checked against the 2026 versions of the software named in it. Menu names do shift between releases, so if your output labels differ, the numbers still mean the same thing.