Coding open-ended survey responses means turning each free-text answer into one or more labels from a written codebook, so the text can be counted, cross-tabulated and analysed statistically instead of being read one comment at a time. In SPSS you keep the original text as a string variable, add a numeric code variable beside it, and label the values so the frequency tables read in plain language. A full pass over a few hundred responses usually takes a working day, plus another hour or two to fix the categories you got wrong.
What “coding” means here is worth being precise about, because the term gets used loosely. It is not sentiment scoring and it is not summarising. It is the act of assigning a shared label to responses that mean the same thing, writing that label’s rule down before you use it, and keeping the raw wording next to the label so anyone can check your work. Do that and the open-end becomes a countable variable. Skip it and you are left with anecdotes.
Table of Contents
- 1What You Need to Code Open-Ended Survey Responses in SPSS
- 2How to Code Open-Ended Survey Responses Step by Step
- 3Step 1: Prepare and Review the Responses
- 4Step 2: Create an Initial Coding Framework
- 5Step 3: Enter the Codes for Open-Ended Survey Responses in SPSS
- 6Step 4: Check the Coding Quality
- 7Step 5: Analyze and Report the Coded Results
- 8Common Mistakes When Coding Open-Ended Responses
- 9Frequently Asked Questions
- 10Can open-ended survey responses be coded as numbers in SPSS?
- 11What if one open-ended response contains several ideas?
- 12How many categories should an open-ended response codebook have?
- 13Is it acceptable to code open-ended responses manually?
- 14How do I check whether my response coding is reliable?
- 15Should I report only the frequency of each response category?
- 16Conclusion
What You Need to Code Open-Ended Survey Responses in SPSS
Five things, and only one of them is software:
- The exported verbatim column. From Qualtrics, SurveyMonkey, Google Forms or your own database, with response IDs still attached.
- A codebook. A spreadsheet with columns for code name, value, definition, include rule, exclude rule and one example verbatim per code.
- A working copy of the raw data. Never code the only copy.
- SPSS with a string variable long enough to hold the answers. Many exports land in A255 or shorter; check before you import.
- A second pair of eyes. A colleague, a supervisor, or a second coder for a reliability subsample.
One rule matters more than the rest: keep the raw text in the dataset forever. In SPSS that means the string variable stays in the file and the code variable is added next to it, never replacing it. Any label should be traceable to the words it came from, and any quote you publish should be traceable to a response ID.
Privacy sits in the same step as cleaning, not after it. Names, team names, locations small enough to identify someone, and anything that reads like a health or disciplinary detail should be redacted in the working copy before coding starts, with the redaction rule written down. If your consent form covered verbatim use, keep it handy; if it did not, check before you quote anything.
How to Code Open-Ended Survey Responses Step by Step
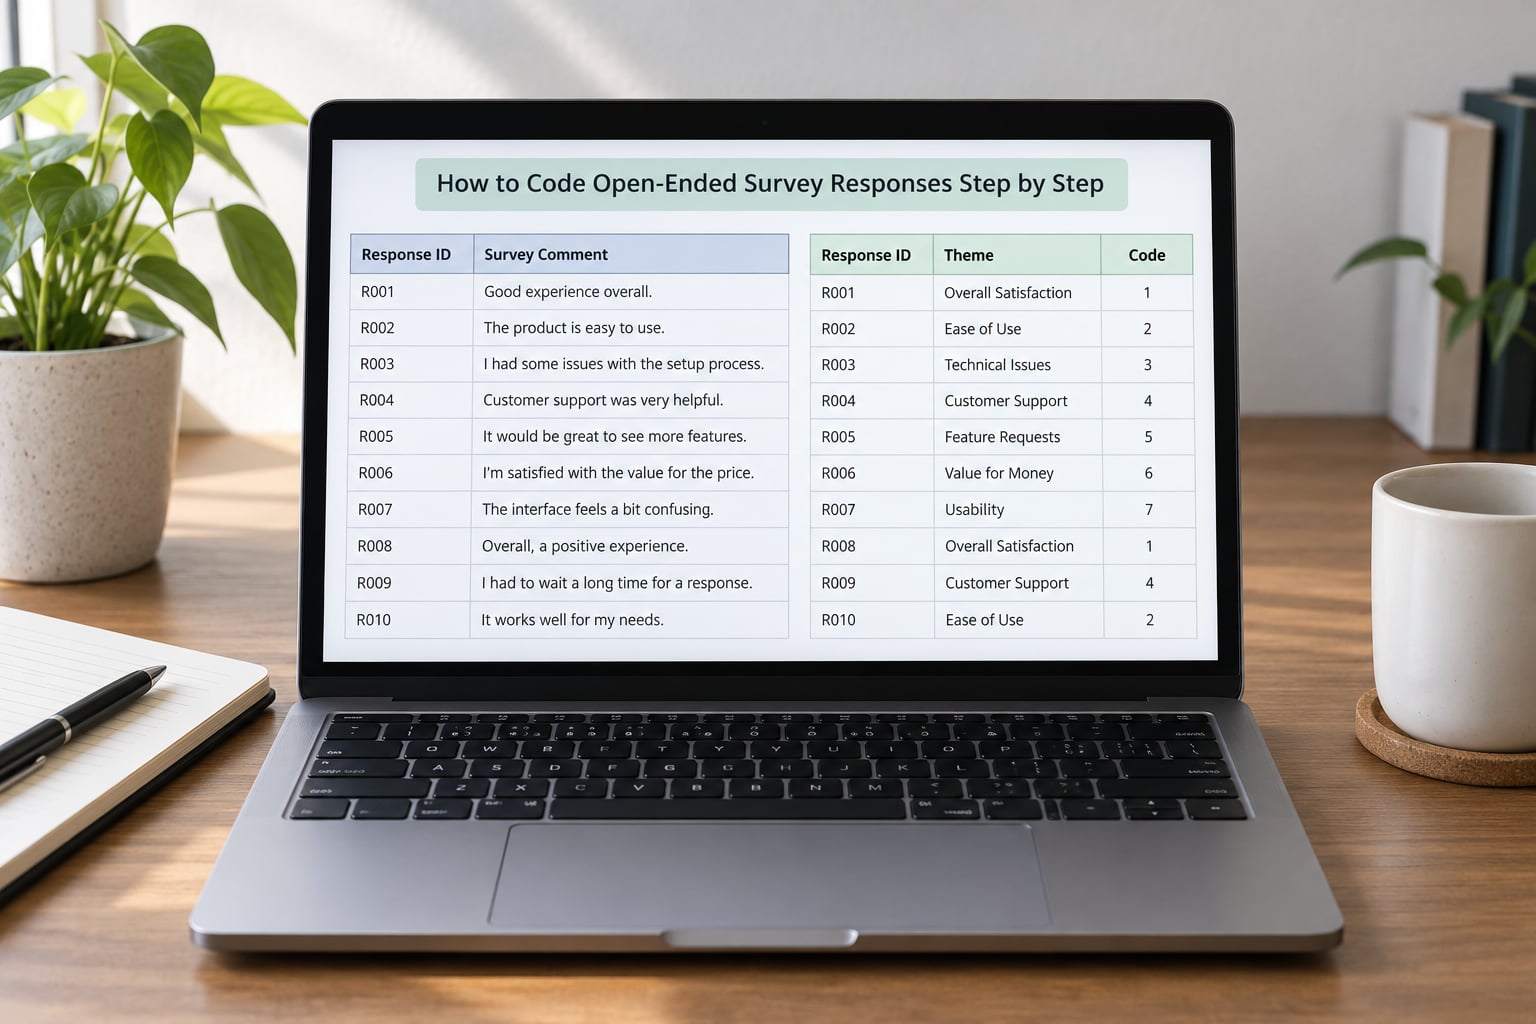
Five steps, in this order: prepare and read the responses, build the codebook, enter the codes in SPSS, check the coding, then report it. The order matters because the cheap mistakes happen at steps 1 and 2, and steps 3 to 5 just apply whatever you decided there.
Step 1: Prepare and Review the Responses
Export the open-ended column with its response ID and, if you have one, the segment fields you might later cross-tabulate against: tenure, region, score band, department. Strip any respondent name, email or free-text field that could identify a person, then import into SPSS as a string variable and set the width to at least 255 characters before you look at a single answer.
Drop empty rows. Flag responses that are blank, that are a single word with no meaning on its own (“n/a”, “none”, “no”), or that contain three ideas stacked into one paragraph. Those are not errors to hide; they are decisions you need to make explicitly, because “n/a” usually means the respondent skipped the question rather than having no opinion, and mixing the two distorts your percentages.
Then read a random 10% to 20% of the responses and write nothing down but short notes on what keeps coming back. This is the step most people skip, and it is the reason their codebook ends up with 100 codes. Reading before you define anything is what tells you which ideas are actually frequent enough to deserve their own category and which are one-off remarks that belong under a broader parent code.
Keep two rules while you read. If a response fits two themes, note it — you will decide later whether the study needs a dominant code or all applicable themes. And if a theme appears twice in the whole sample, do not give it a code yet. Small counts are still worth reading; they are just not worth a variable.
Step 2: Create an Initial Coding Framework
Turn your notes into a codebook with fixed columns. Definitions go in plain language, because the person applying the code a year from now is not you.
| Code name | Value | Definition | Include when | Exclude when | Example verbatim |
|---|---|---|---|---|---|
| Access to resources | 1 | Mentions library, database, software or equipment access | The barrier named is getting or using a resource | The complaint is about teaching quality instead | Databases crash constantly and the ones we need are not on our login |
| Tutor support | 2 | Mentions tutors, advisors or feedback turnaround | A person giving academic support is the subject | Peer study groups are named | I waited five weeks for a comment on my draft |
| Workload balance | 3 | Mentions volume of work, deadlines or assessment pace | Too much or badly timed work is named | Workload is mentioned as a reason for leaving a job | Three assignments landed in the same fortnight |
| Unclear | 9 | Blank, off-topic, or genuinely spans several themes | No single code fits defensibly | Anything you could code with a better definition | Depends who you ask really |
Two design decisions sit inside this step. The first is single versus multiple codes: one response carrying a complaint about tutors and a complaint about deadlines gets either one dominant code or two binary variables. The second is whether your codes come from theory or from the data, which changes how defensible the whole exercise is.
| Approach | Where the codes come from | Effort | Best for |
|---|---|---|---|
| Deductive | A framework, prior research or the survey design | Lower per response; higher risk of forcing | Comparing against known constructs; repeatable waves |
| Inductive | The responses themselves | Higher; requires saturation checking | Exploratory work and building a new framework |
| Hybrid | Start deductive, add inductive codes as they appear | Moderate | Most applied survey work, and most defensible |
The pooling question comes up constantly in forums, so it is worth answering directly. Responses from different questions can be combined and coded inductively, and doing it is often the fix for a survey whose open-ends feel scattered. One r/dataanalysis user coded 17 open-ended questions one at a time and ended up with 17 code sets that did not generalise to the dataset. Building one codebook across the whole instrument, then applying it everywhere, prevents that sprawl — provided the code is generic enough to travel. When a question only makes sense locally, keep a question-specific code block and mark it as such.
Step 3: Enter the Codes for Open-Ended Survey Responses in SPSS
Create the code variable in Variable View, not by typing numbers into the data grid. Set the name to something short and lowercase, such as q7_theme. Choose Numeric, 8 decimals, no missing values allowed at first. Then label the values so the output is readable without the codebook open.
VARIABLE LABELS q7_theme 'Dominant theme in Q7 open-end'.
VALUE LABELS q7_theme
    1 'Access to resources'
    2 'Tutor support'
    3 'Workload balance'
    9 'Unclear'.
EXECUTE.
Once the codes are in, work out the frequency table immediately. If a code you expected is empty, or one code has swallowed most of the sample, the definition is wrong — fix the definition and re-code rather than reporting it.
When a response can carry several themes, build one binary variable per code instead of a single category variable. This is the standard way to handle multi-label responses and it cross-tabs cleanly.
COMPUTE q7_access = ANY(q7_theme, 1).
VARIABLE LABELS q7_access 'Mentions access to study resources'.
VALUE LABELS q7_access 0 'No' 1 'Yes'.
COMPUTE q7_tutor  = ANY(q7_theme, 2).
COMPUTE q7_load   = ANY(q7_theme, 3).
EXECUTE.
If you have only a string variable and no codes yet, keyword matching will get you a starting point, but not a finished code. SPSS string functions are fine for a first pass:
STRING q7_text (A255).
COMPUTE q7_tutor = (SEARCH("tutor", q7_text) > 0) OR (SEARCH("advisor", q7_text) > 0).
EXECUTE.
Be honest about what this misses. One vendor case study on survey coding found that plain keyword and regular-expression rules agreed with human coding only about 30% of the time; the same project reported alignment above 84% once a language model sat behind a human review step. Pattern matching also cannot tell “no tutor was ever available” from “the tutor was excellent” — both contain the word. Use it to prioritise what you read, not to replace reading.
SPSS has an AutoRecode command that groups string values into bands. It is useful for cleaning inconsistent spellings of a closed question and wrong for open-ends, because it clusters on surface similarity rather than meaning. Test it on a copy before trusting it.
The same work in other tools looks like this.
In Excel, keep the verbatim in one column, put the code in the next, and use a helper column with a search formula when you want a first pass:
=ISNUMBER(SEARCH("tutor",D2))        ' helper column, 1 or 0
=COUNTIF(B:B,B2)                     ' count each code value
=COUNTIF(F:F,TRUE)/COUNTA(B:B)        ' share of coded responses
In R, a case_when pipeline over the raw text gives you the same variable:
library(dplyr)
df <- df %>%
  mutate(q7_theme = case_when(
    grepl("tutor|advisor", q7, ignore.case = TRUE) ~ 2,
    grepl("library|database|software", q7, ignore.case = TRUE) ~ 1,
    grepl("workload|deadline|assignment", q7, ignore.case = TRUE) ~ 3,
    TRUE ~ 9))
table(df$q7_theme)
In Python:
import pandas as pd
rules = {"tutor": 2, "advisor": 2, "library": 1, "deadline": 3}
def code(text):
    t = str(text).lower()
    for key, val in rules.items():
        if key in t:
            return val
    return 9
df["q7_theme"] = df["q7"].map(code)
df["q7_theme"].value_counts().sort_index()
Whichever tool you use, the column order is the same: response ID, raw text, code, binary flags, coder ID, date coded. The last two columns matter later when you check reliability.
Step 4: Check the Coding Quality
Three checks, in order of usefulness. First, frequency tables on every code variable, looking for empty codes, one dominant code, and codes with only two or three responses. Second, cross-tabulations against a segment you care about; a code that appears in one department and nowhere else is often a vocabulary problem, not a finding. Third, re-read a random 20 coded responses with the codebook in hand and ask whether each label is the one you would have chosen from scratch.
Then test agreement properly. Have a second coder independently code a subsample — 50 to 100 responses is usually enough to be useful — using the same definitions and no access to your codes. Compare row by row and report Cohen’s kappa for two coders on a categorical variable. Raw percentage agreement is misleading when one code dominates: two coders who both say “workload” 80% of the time can look excellent and still disagree on everything rare.
| Cohen’s kappa | Reading | What to do |
|---|---|---|
| Below 0.20 | Slight | Definitions are ambiguous; rewrite before continuing |
| 0.21 to 0.40 | Fair | Workable with written tie-break rules |
| 0.41 to 0.60 | Moderate | Usable, but report the value |
| 0.61 to 0.80 | Substantial | Good; disagreements are edge cases |
| Above 0.80 | Almost perfect | Check that the codes are not too coarse |
When kappa is low, do not average the two coders into a compromise and move on. Read the disagreements, and most of them are a definition problem: two topics crammed into one code, or an include rule and exclude rule that overlap. Fix the codebook, version it, and re-code the affected responses. Record the version number and date in a header row or a separate log so next year’s wave uses the same definitions.
If a machine or language model did the first pass, validate it against a hand-coded sample you produced yourself, and keep that sample labelled. That is the advice in the foundryR annotation workflow: draw the hand-coded sample before inspecting the model’s errors, and hold back a second labelled sample if you retune the prompt or the codebook. Re-run the same prompt on the same data and measure consistency, too — a method that changes its answer on Tuesday that it gave on Monday cannot support a defensible number.
Step 5: Analyze and Report the Coded Results
Report the count and the percentage for each code, with the denominator stated explicitly: all respondents, or respondents who gave a substantive answer. For the percentage, give an interval rather than a bare figure — a code held by 12 of 400 responses is somewhere around 3% but the range around that number is wide, and quoting the range keeps you honest. A binomial interval is easy to compute and needs no software.
Pair the frequencies with quotes. Four or five anonymised verbatims per major theme do more persuasive work than any table, because they show the reader the wording behind the number. Keep the response ID in your working notes so a colleague can trace any quote back to its entry in the codebook.
Then write the methods note: where the codes came from (deductive, inductive, hybrid), who coded them, how many were double-coded, what kappa was, what the “unclear” bucket contains and how big it is, and the codebook version. That paragraph is what turns a frequency table into evidence.
Common Mistakes When Coding Open-Ended Responses
Labels that are too long. A value label reading “mentions difficulty accessing library databases or software licences” wraps badly in every SPSS output table and stops people reading the table. Keep labels under about 24 characters and put the full rule in the codebook.
Categories defined by vibe. If the definition is “comments that are basically negative”, two coders will not land in the same place and you will not be able to argue the code with anyone. Define each category by what is in the text, not by how it felt.
Overwriting the raw text. Replacing the string variable with codes destroys the evidence. Keep the verbatim column permanently and make sure the export you share still contains it.
Everything unusual goes to “other”. A large other bucket usually means the reading was not finished, not that the data was strange. Sort it, read every entry, and either split it into real codes or state plainly how many responses remained uncoded and why.
Mixed units in one variable. Coding some responses as themes and others as sentiment, or scoring a three-point scale alongside eight theme codes, produces a frequency table nobody can read. Keep one dimension per variable, and put theme, sentiment and intent in separate columns.
Reporting codes with no method. A percentage with no codebook, no coder count and no reliability figure invites the question you do not want in a viva or a client review. Two sentences of method cost nothing.
Frequently Asked Questions
Can open-ended survey responses be coded as numbers in SPSS?
Yes. Create a numeric variable for the main category, label the values in Variable View, and describe each code in the codebook, such as 1 for a positive comment, 2 for neutral and 3 for negative. Keep the original text in a separate string variable so any label can be traced back to the wording it came from.
What if one open-ended response contains several ideas?
Decide whether your research question needs a dominant category or every applicable theme. For multiple themes, create separate binary variables set to 1 when the theme appears and 0 when it does not, using COMPUTE with ANY in SPSS. Count how many respondents mention each theme rather than how many responses fall in each theme, and say which denominator you used.
How many categories should an open-ended response codebook have?
There is no universal number. Create enough categories to separate the main patterns you find without splitting hairs, then check that every code holds at least a handful of responses. A code that appears twice is usually a sub-theme worth reading but not worth a variable. Merge codes that always mean the same thing, and keep a documented unclear bucket for genuinely ambiguous text.
Is it acceptable to code open-ended responses manually?
Yes, particularly for student research and exploratory analysis. Manual coding is defensible when you preserve the raw text, write the codebook before coding starts, pilot around 100 responses, revise the definitions, and double-code a subsample to report agreement. What reviewers object to is undocumented coding, not human coding itself, so keep the codebook and the coder record together.
How do I check whether my response coding is reliable?
Ask another researcher to code a sample of 50 to 100 responses independently, using the same definitions and no access to your labels. Compare the two row by row and compute Cohen’s kappa for a categorical code variable. Read the disagreements rather than only the score: most low-kappa results trace back to an overlapping include and exclude rule, which you then fix in the codebook.
Should I report only the frequency of each response category?
No. Report counts and percentages with the denominator stated, give a binomial interval around each percentage, and add several anonymised verbatim quotes that illustrate the main themes. Explain how the categories were created, who coded them, how many were double-coded and what agreement was reached. Frequencies without the method cannot be defended, and frequencies without quotes rarely persuade anyone.
Conclusion
Start with four things before you touch SPSS: keep the raw verbatim untouched, write a short codebook with definitions and examples, pilot-code about 100 responses, and check the categories against a re-read before applying them to everything. Everything after that is repetition, and repetition is where a transparent codebook pays off — it is what lets someone else rerun your coding in 2026 and get the same frequencies you published.