To label variables and values in SPSS, you work in the Variable View tab: type a description in the Label cell for the variable itself, then open the Values cell to map each coded number to a category name such as 1 = Male. Both live in your file, and every frequency table, crosstab and chart you produce afterwards uses them automatically.
The whole job takes about ten minutes for a small dataset. What trips most beginners up is that a variable label and a value label are two different things stored in two different columns, and putting them in the wrong one means SPSS quietly ignores you.
This guide covers both the click-through route in the Variable View grid and the copy-paste syntax route, then explains how to check that the labels actually show up in your output. It applies to IBM SPSS Statistics on Windows and macOS, including the current subscription release and the older v26-v29 interface, which uses the same dialog names.
Table of Contents
- 1What You Need Before Labeling in SPSS
- 2How to Label Variables and Values in SPSS: Step-by-Step
- 3Step 1: Open Variable View
- 4Step 2: How to Label Variables in the Variable View Grid
- 5Step 3: How to Add Value Labels for Coded Responses
- 6Step 3b: The Same Labels in Copy-Paste Syntax
- 7Step 4: Set Measurement Level, Save and Check the Output
- 8Common Mistakes That Break Labels in SPSS
- 9Frequently Asked Questions
- 10How do I display value labels in SPSS output?
- 11What are the rules for naming variables in SPSS?
- 12How do I change the name of a variable in SPSS?
- 13How do I label a lot of variables without typing each one?
- 14How do I declare missing values alongside value labels?
- 15Does adding a value label change my data?
- 16Conclusion
What You Need Before Labeling in SPSS
You need three things: your data file open in SPSS, a clear idea of what each numeric code means, and five quiet minutes. That third ingredient is the codebook, which is either the survey instrument you used, the export guide from Qualtrics or Google Forms, or the notes your supervisor handed you.
If you imported the data from Excel, the codes arrived without explanation. Column headers called Q3, value1 and value2 tell you nothing about what was measured, so check the original questionnaire before you type a single label.
Here is the distinction that confuses everyone. Four separate things are in play, and they are not interchangeable.
| Element | What it is | Example | Where it shows up |
|---|---|---|---|
| Variable name | The short code SPSS uses to identify a column | gender | Everywhere you refer to the variable, including syntax |
| Variable label | A description of the whole variable, up to 256 characters | Participant gender as recorded in the intake survey | Output tables, beside the variable name |
| Value label | A description attached to one code within that variable | 1 = Male | Frequency tables, crosstabs, value labels in charts |
| Numeric code | The number actually stored in the data cells | 1 | Data View only, and it never changes |
One more thing worth knowing before you start is how variable names must be formed. SPSS is strict here, and a rejected name produces a dialog rather than a helpful message.
| Rule | What it means in practice |
|---|---|
| Start with a letter | age works, 1age does not. The underscore does not count as a letter |
| Up to 64 characters | Names may be longer than people expect, so descriptive abbreviations work |
| Letters, digits, underscore, period, dollar sign, hash and at sign only | No spaces, no hyphens, no brackets, no exclamation marks |
| Cannot end with a period or underscore | score. and score_ are both refused |
| Case is flexible | Gender and gender are read as two different variables, so keep the case consistent |
| Cannot be all digits | The variable 2020 is not a valid name |
Labels are far more forgiving than names. A variable label can contain spaces, commas and full sentences, which is exactly why you use one: you keep the name short for syntax and put the meaning in the label.
How to Label Variables and Values in SPSS: Step-by-Step
Step 1: Open Variable View
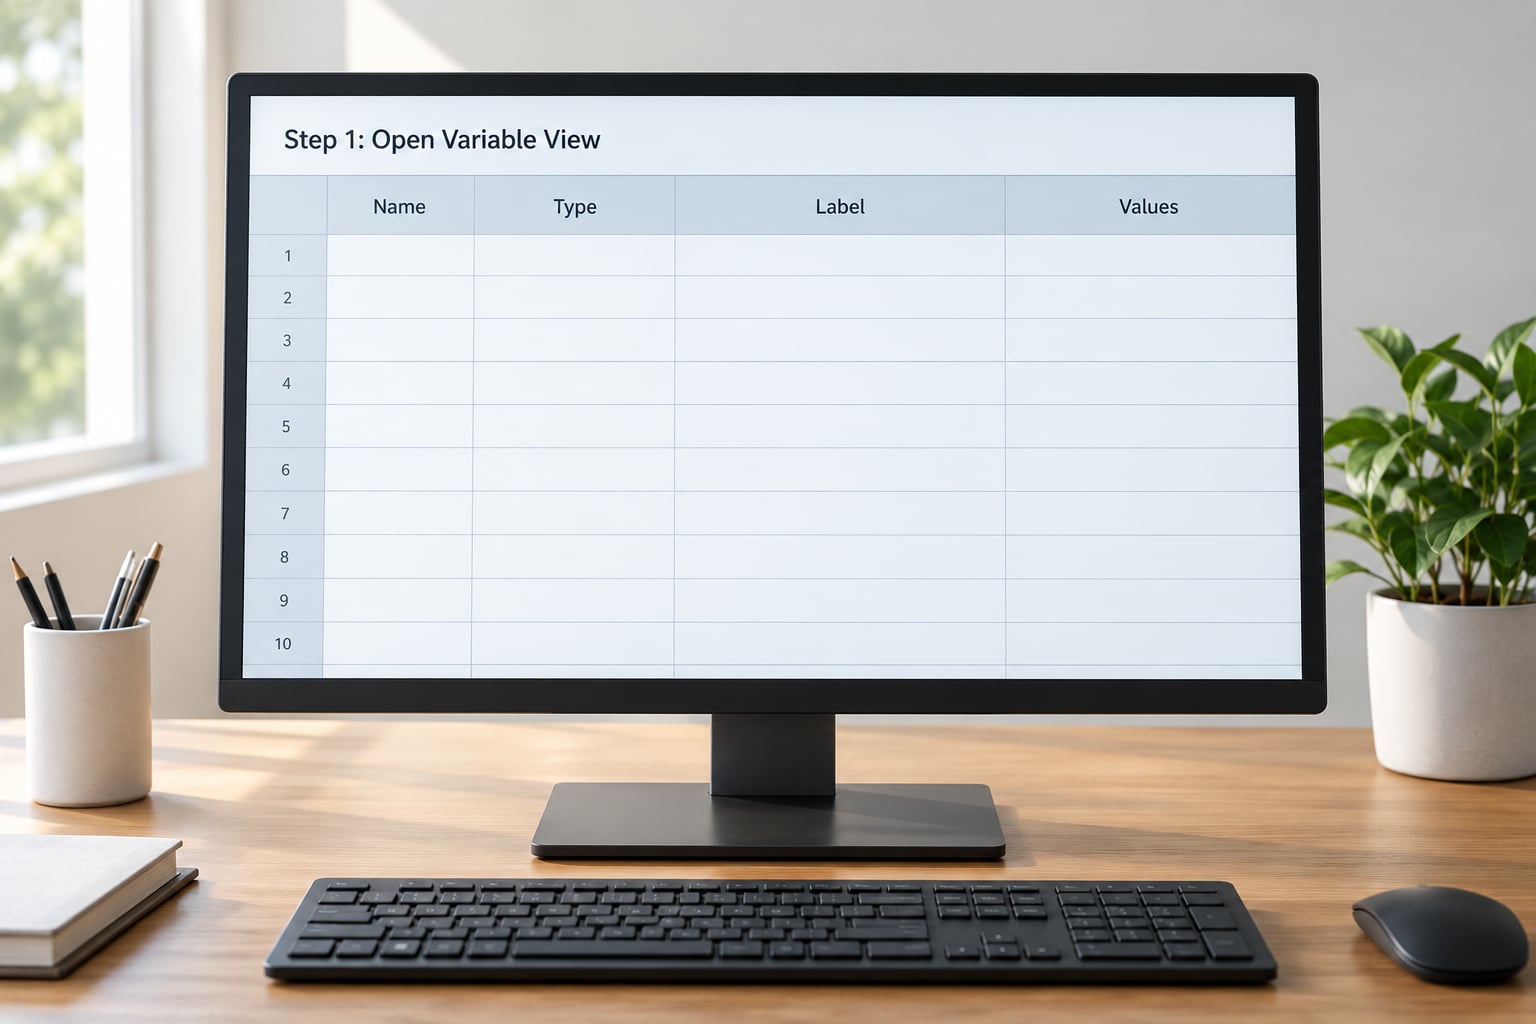
Look at the two small tabs above the data grid at the bottom left of the SPSS Data Editor. You are in Data View, which shows the actual responses. Click Variable View to see the settings for each column instead.
Each row is a variable and each column is one of its properties. The ones you need for labeling are Name, Type, Label, Values, Missing and Measure.
Label holds the description of the variable as a whole. Values holds the mappings from codes to category names, and its cell shows three dots rather than text. That three-dots cell is where the Value Labels dialog opens, and it is the single most common place beginners type something that goes nowhere.
Step 2: How to Label Variables in the Variable View Grid
Find the row for your variable using the Name column, then click once in the cell under Label. Type your description in plain words and press Enter, or click the next cell.
The variable name in the first column does not change, and no data cell changes either. You can verify this by switching back to Data View and confirming the values are still 1, 2 and 3.
Keep labels specific enough to stand alone in a results table. “Gender” is fine when the survey only asked for gender, but “Gender as recorded at intake (original categories retained)” saves a reader from guessing when the table turns up in an appendix two years later. Write the label for someone who has never seen your questionnaire.
Step 3: How to Add Value Labels for Coded Responses
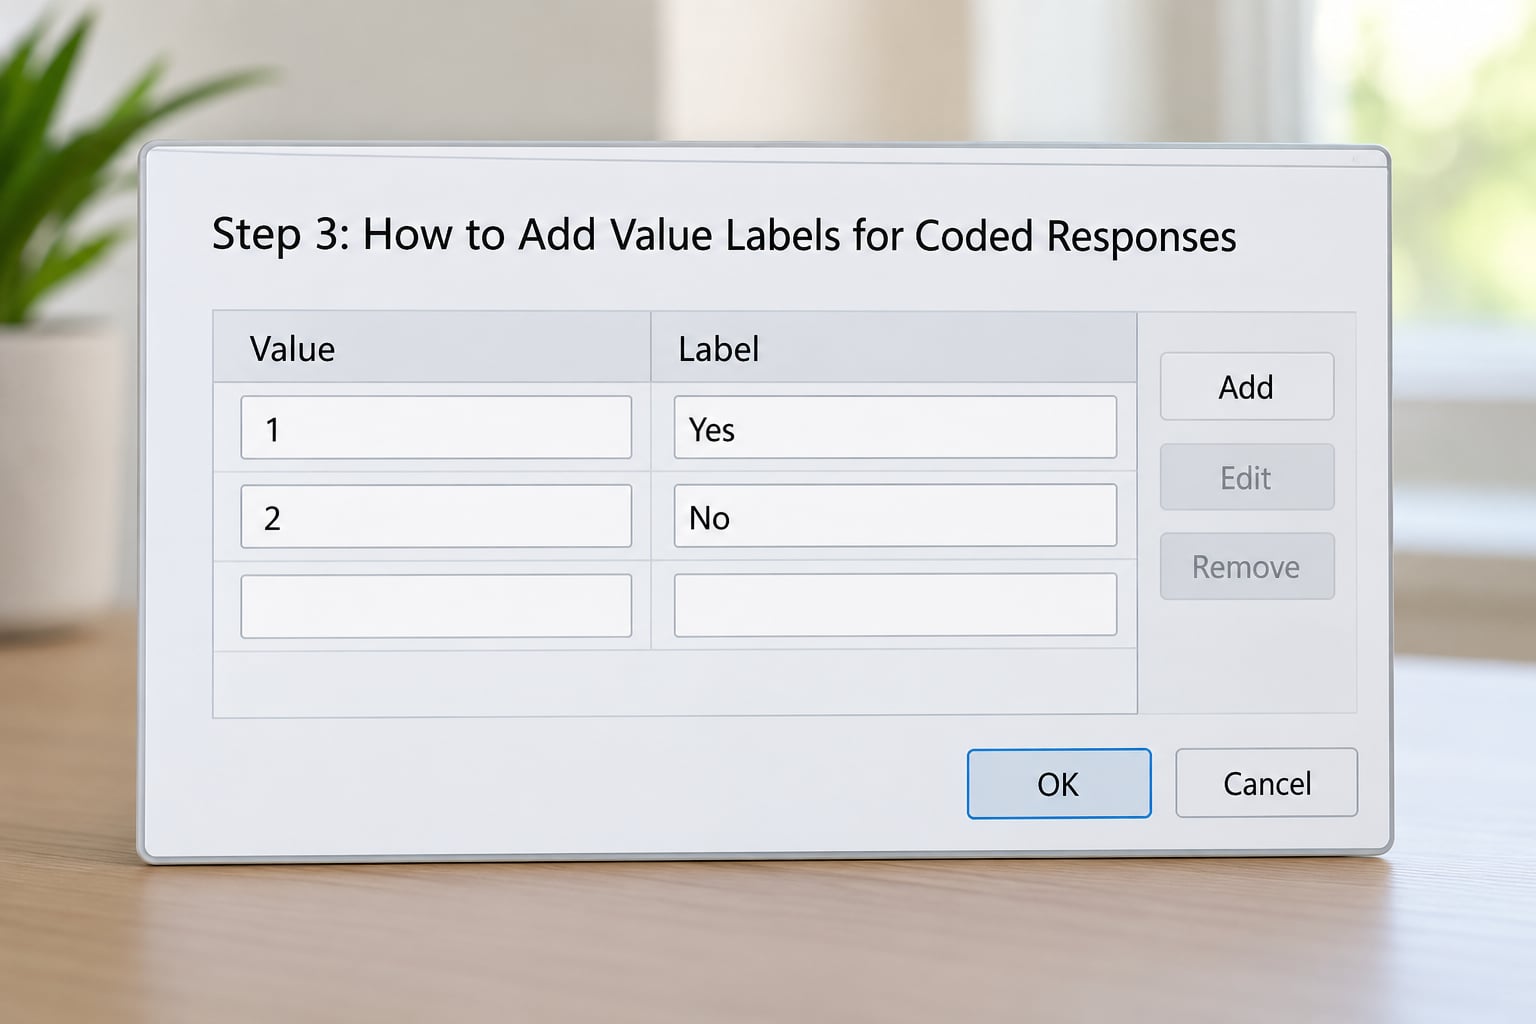
Click the cell containing three dots in the Values column for that same row. The Value Labels dialog opens with the value box on the left and the label box on the right.
Type the code exactly as it appears in your data. If gender is stored as 1 and 2, put 1 in the left box and Male in the right box, then click Add. The mapping now appears in the list at the bottom of the dialog. Repeat for the remaining codes, then click OK.
A finished set looks like this in the dialog:
1 = Male
2 = Female
3 = Prefer not to say
Category order does not have to match numeric order. You could store 1 = Male, 2 = Female and still display Female first in a table by changing the display order, but that only affects output, never the stored codes.
For a Likert item you would do the same with five codes, 1 = Strongly disagree through 5 = Strongly agree. String variables work too: if the responses are stored as Yes and No, type the word without quotation marks in the value box and SPSS matches the string exactly. A label with trailing spaces such as “No ” will not match “No”, which is a frequent source of silent failure.
To undo a mapping, reopen the dialog, select the row in the list, and click Remove. To correct one, select it, type the new label in the right box and click Change. Closing the dialog with OK saves the labels into the data file; they are stored in the file itself, not in your session, so they travel with the .sav file when you send it to a colleague.
Step 3b: The Same Labels in Copy-Paste Syntax
Syntax is faster once you have more than a handful of variables, and it is the only practical route when you want a reproducible record of what you did. Open a syntax window with File > New > Syntax, paste the commands below, and run them.
VARIABLE LABELS gender "Gender as recorded at the intake survey".
VALUE LABELS gender 1 "Male" 2 "Female" 3 "Prefer not to say".
VARIABLE LEVEL gender (NOMINAL).
Every label in quotation marks is the whole ball game. A command without the quotes either fails with an error or, more annoyingly, is skipped without one, and you get an output file that looks fine except your labels are missing.
The ADD VALUE LABELS variant adds new mappings to a variable that already has some, which is useful when a second survey wave introduces an extra category. Use plain VALUE LABELS when you want to replace the existing set entirely.
Long label sets can be written compactly with the extended form:
VALUE LABELS agree 1 "Strongly disagree" 2 "Disagree" 3 "Neither" /

    4 "Agree" 5 "Strongly agree".
One subtlety worth knowing: VALUE LABELS cannot be used to label a long string variable, where the whole response is treated as a category. That case calls for ADD VALUE LABELS instead. Most beginners never hit this, but it explains a puzzling error when an open-ended survey question refuses to label.
Step 4: Set Measurement Level, Save and Check the Output
In the Measure column, set the right level: Nominal for categories with no order such as gender, Ordinal for ordered categories such as the Likert item, and Scale for continuous measurements such as age in years. Getting this right affects which charts SPSS offers and how tests behave, and it pairs naturally with the value labels you just entered.
While you are in the grid, use the Missing column to declare codes such as 9 = Refused. SPSS then excludes them from calculations and reports them separately instead of averaging them into your results.
Save the file with File > Save. Then verify the work: run Analyze > Descriptive Statistics > Frequencies on the variable, click the Statistics button if you want percentages, and tick Values as labels in the dialog before OK.
A frequency table that reads 1 Male, 2 Female, 3 Prefer not to say tells you the mapping worked. If it still shows bare numbers, the output was produced before you added the labels and has not been regenerated, or the labels went into the Label column by mistake.
Common Mistakes That Break Labels in SPSS
Value labels typed into the Label column. If you type “1 = Male” into the Label cell, SPSS stores it as a description of the variable and your frequency table still shows 1. The fix is to clear the Label cell and put the mappings in the Values cell through the dialog.
Missing quotation marks in syntax. Labels have to be enclosed in quotes, and every command needs a full stop at the end. Omitting either one tends to produce no error message and no labels, which sends people hunting through menus for a problem that was in the syntax all along.
Spaces inside a string value. When a variable is short string, the value box takes the text without quotes, so an accidental trailing space means “No ” will not match “No”. Clear the cell and retype, or switch the variable to numeric coding, which is far more robust in analysis.
Labels that never reach the output. This one shows up constantly on the r/spss forum, where users report descriptives tables rendering raw or apparently random numbers instead of category names. In most cases the values simply have not been labelled, and in the rest the output was generated before labelling and needs rerunning. For frequency tables, tick Values as labels in the Frequencies dialog. For charts, choose Edit Charts > Data Point Labels and set the label source to Value, which displays the label rather than the raw code.
Renaming a variable after analysis. Changing a Name in Variable View breaks every syntax command, chart and table you built with the old name. Rename variables early, before running anything, and use RENAME VARIABLES in syntax if you must change them later.
Overwriting a good label. Clicking the Values cell and confirming the dialog with OK replaces the entire set rather than adding to it. Take a copy of your mapping in syntax first, and use ADD VALUE LABELS when you only mean to append.
Forgetting to save. Labels live in the file. Closing without saving throws away everything you typed, including edits made through the grid that produce no confirmation of their own.
Two habits prevent most of the above. Work in syntax whenever you are labeling more than about ten variables, because it is repeatable and reviewable. And check your work with one Frequencies table before you build anything elaborate on top of the data.
Frequently Asked Questions
How do I display value labels in SPSS output?
For frequency tables, run Analyze u0026gt; Descriptive Statistics u0026gt; Frequencies, then tick Values as labels on the Frequencies dialog before clicking OK. For a chart, open Edit Charts u0026gt; Data Point Labels and set the label source to Value instead of Frequency or Percentage. If existing output still shows bare numbers, it was generated before you added the labels, so run the analysis again rather than editing the old output.
What are the rules for naming variables in SPSS?
A variable name must start with a letter, can run up to 64 characters, and may contain only letters, digits, and the characters underscore, period, dollar sign, hash and at sign. Spaces, hyphens and brackets are not allowed. A name also cannot end with a period or underscore, and cannot consist only of digits. Variable names are case sensitive, so Gender and gender count as two different variables.
How do I change the name of a variable in SPSS?
Go to Variable View, click the Name cell of that row, type the new name and press Enter. Do this before you run any analysis, because SPSS does not update formulas, syntax, charts or saved output that reference the old name. In syntax, write RENAME VARIABLES oldname = newname. and run it before any other command that mentions the variable.
How do I label a lot of variables without typing each one?
Use syntax, and write one VARIABLE LABELS line followed by one VALUE LABELS line per variable with all codes on that line. You can generate those lines in a spreadsheet, paste them into a syntax window and run them in seconds. For datasets that arrive with labels stored in a separate Excel codebook, read the codebook file with GET DATA and apply the labels programmatically rather than by hand.
How do I declare missing values alongside value labels?
Click the cell in the Missing column of the row and choose Discrete missing values, then enter each code you want excluded, such as 9 and 99, one at a time and click Add. In syntax, write MISSING VALUES gender (9, 99). Declaring a code as missing does not remove its value label, so the category can still be shown in tables and counted in the missing column.
Does adding a value label change my data?
No. Labels are stored separately from the numbers in your data cells, and adding, editing or removing one never alters a single response. That is the reason to use labels rather than typing category names directly into the columns: your analysis keeps working on the original numeric codes while every table and chart displays readable text. Recoding values is a different operation, and that one does change your data.
Conclusion
Start in Variable View and label one variable end to end: a description in the Label cell, then its code mappings in the Values cell through the three-dots dialog. Ten minutes later you will know whether the workflow clicks, and the rest is repetition.
Check the result with a single Frequencies table run after labelling, with Values as labels ticked. Seeing category names where your numbers used to be is the confirmation that nothing has been lost.
Then remember the one rule that matters above all: labels never touch your data. The numbers stay exactly as they were entered, so every analysis you run, and every table you paste into a document, reads properly without you maintaining a separate codebook.