
Recoding in SPSS means replacing the values of a variable with new values so the data matches what your analysis needs. To learn how to recode variables in SPSS, use Transform > Recode into Different Variables, which writes the new codes into a fresh variable and leaves the original untouched; Recode into Same Variables overwrites in place, and there is no undo.
Most people should use the different-variables method first. It costs you one extra column and buys you a way back every time a mapping turns out to be wrong.
Recoding comes up whenever the data does not fit the analysis. A five-point agreement item needs to collapse into three groups for a cross-tab. An age column running from 18 to 87 needs to become bands. A column of coded responses is a string variable and will not work as a predictor until it holds numbers. A survey pack used 99 and 999 for “did not answer”, and those codes are now sitting in your frequency table looking like real opinions.
Two methods cover most of it. Recode handles category-to-category mapping, collapsing, splitting, reverse scoring and string-to-number conversion. Compute Variable handles a value calculated from a rule, expression or condition. Neither is more correct than the other; they just suit different jobs.
Table of Contents
- 1What You Need
- 2Step-by-Step
- 3How to Recode Categories With Recode into Different Variables
- 4How to Recode Categories With Compute Variable
- 5How to Recode Multiple Variables Efficiently
- 6How to Verify That the Recoding Worked
- 7Common Mistakes That Wreck Recoded Data
- 8Frequently Asked Questions
- 9What does recoding data mean in SPSS?
- 10How do I recode variables into different variables in SPSS?
- 11Why is my new recoded variable all system-missing?
- 12How do I recode string variables into numeric in SPSS?
- 13How do I reverse-code a Likert scale item in SPSS?
- 14What is the difference between recode, automatic recode and compute?
- 15Conclusion
What You Need
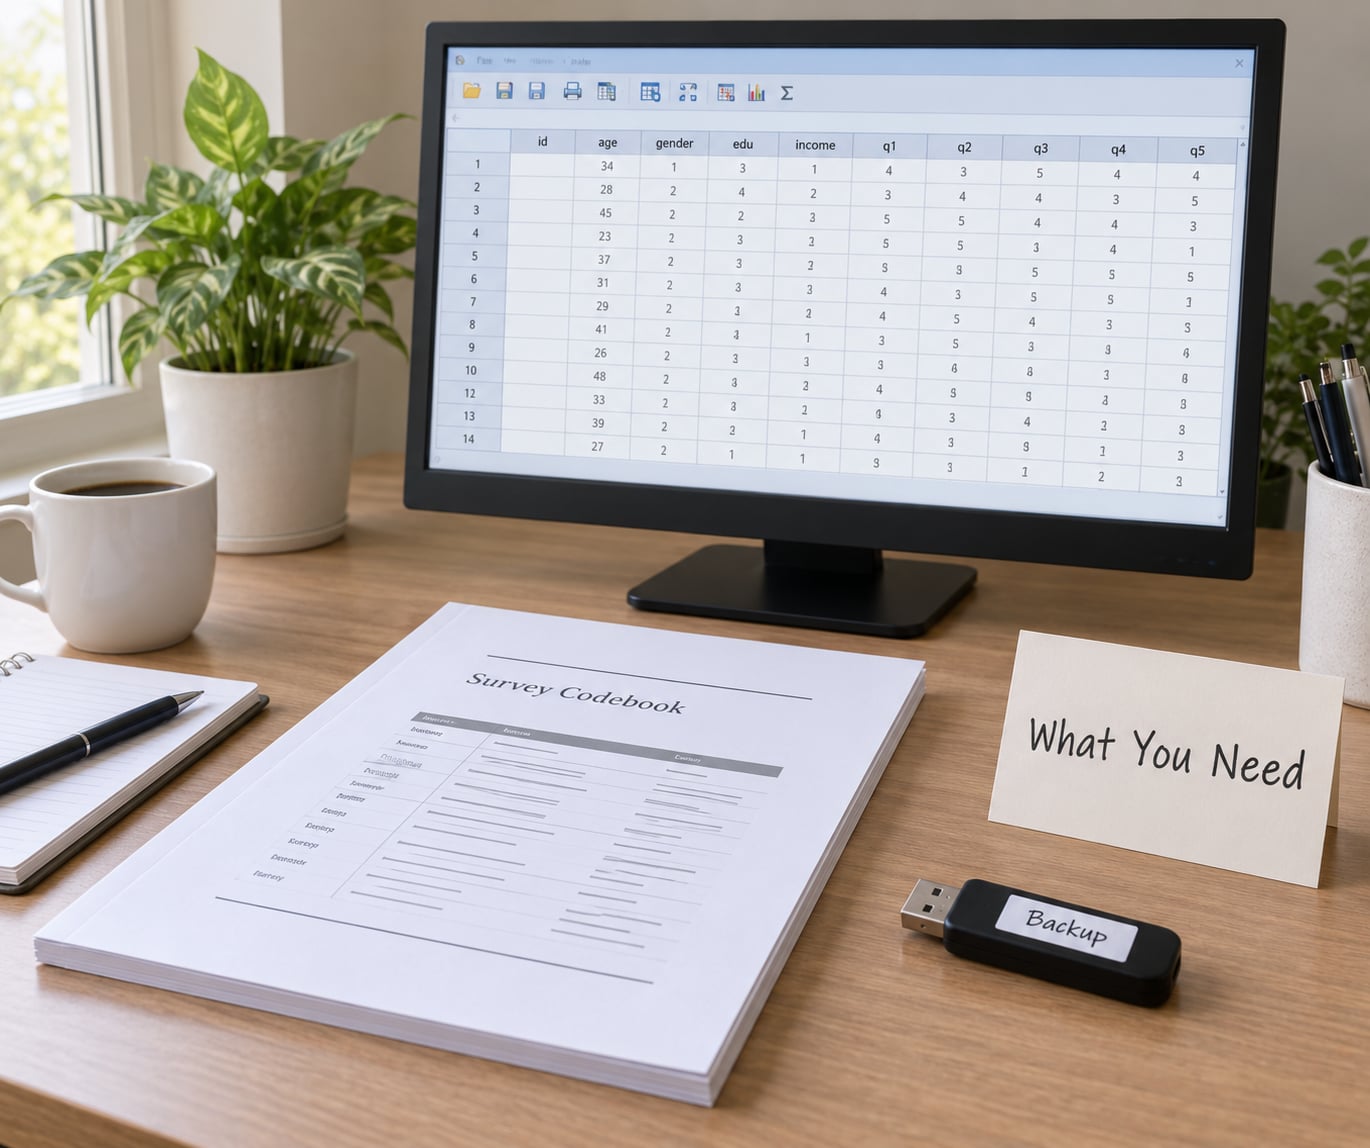
Before you open any dialog, have these four things sorted.
- A saved copy of your data file. Save the dataset, then use File > Save As to write a working copy. Recode into Same Variables changes your file the moment you click OK.
- The codebook or questionnaire. You need to know what the original numbers mean. Guessing here is how 99 ends up treated as a genuine category.
- Variable View open. Click the Variable View tab at the bottom of the window and read the Values column for your source variable. Labels there tell you which codes are real and which are placeholders.
- Syntax Editor open. Click Window > New Syntax Window. The menu route works fine, but a syntax file gives you a written record of every mapping you applied, and that record is what makes the work reproducible.
These instructions describe the desktop client, IBM SPSS Statistics for Windows and Mac, in current releases. The dialog layout and button names have been stable across recent versions; on newer Windows installs the same items sit in the ribbon under Transform rather than a menu bar, but the sequence below is identical.
Take one minute to look at the measurement level column too. A variable marked nominal or ordinal usually wants a recode. A variable marked scale is often better handled by Visual Binning or by treating it as continuous.
Step-by-Step
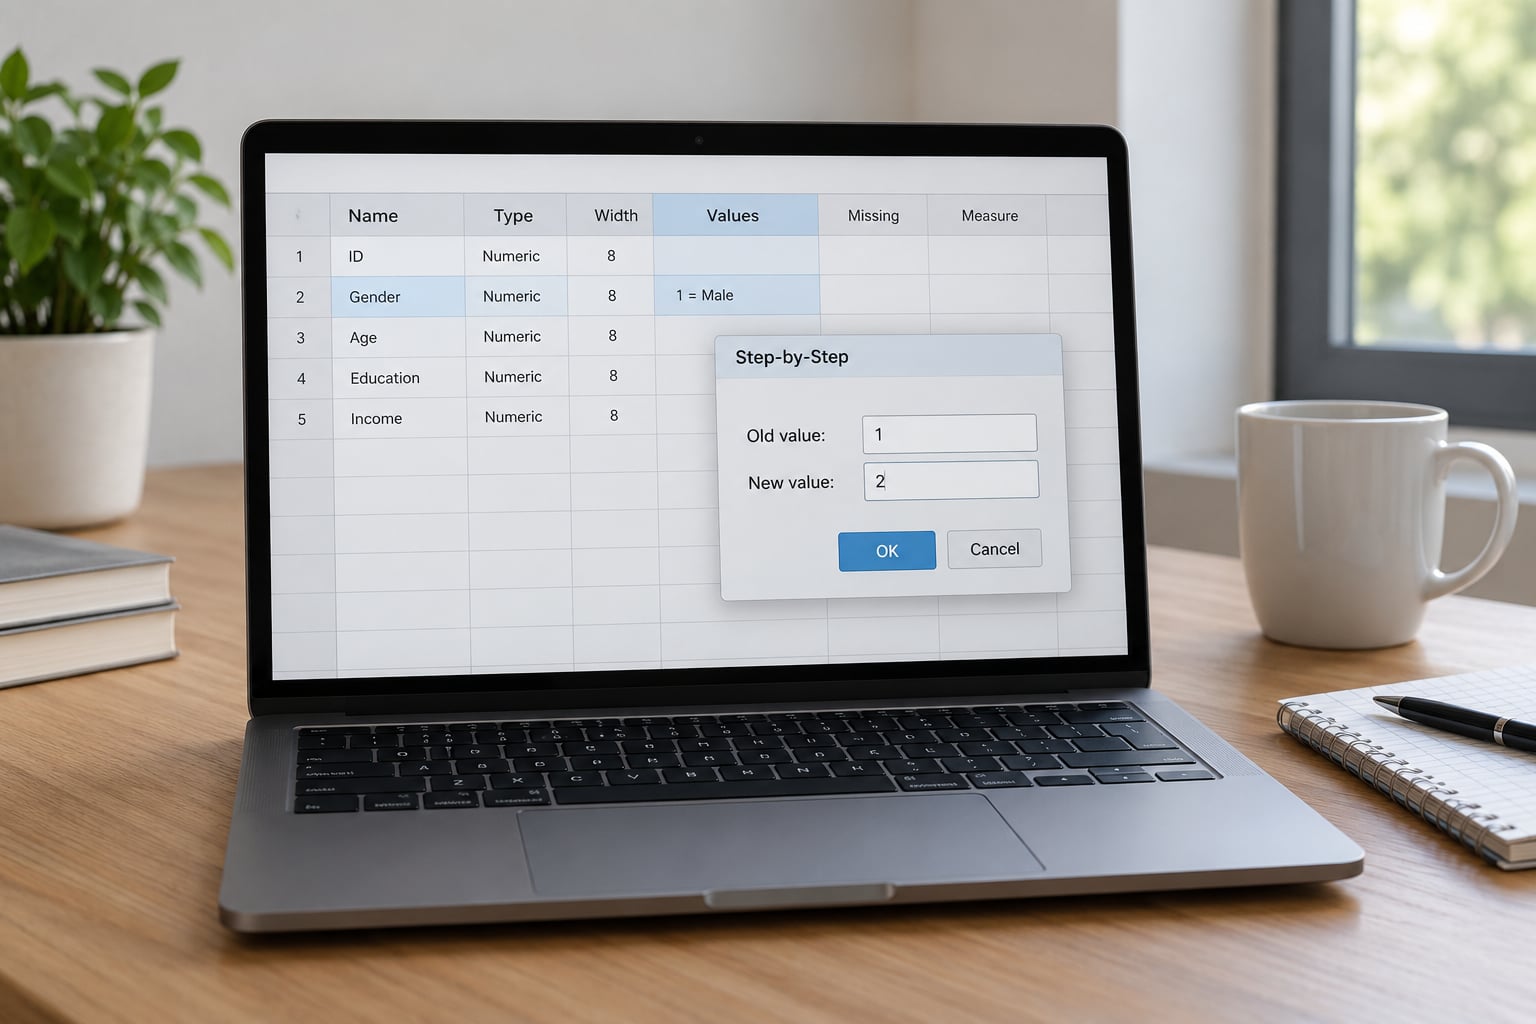
Below is the full workflow: pick the right method, inspect the value labels, create a new variable, write the mapping rules, then check the result before you analyse anything. Each section covers one stage, and each gives you a way to tell it worked.
How to Recode Categories With Recode into Different Variables
This is the safe method. SPSS creates a brand-new variable and leaves the source column exactly as it was, which means you can compare the two, run a crosstab between them, and delete the original later if you are happy.
Use it whenever you collapse categories, reverse score items, create bands, turn strings into numbers, or build dummy variables. The steps below use a worked example: a five-point Likert item called q1 where 1 is strongly disagree and 5 is strongly agree, recoded into three categories.
- Go to Transform > Recode into Different Variables.
- Drag q1 from the left-hand variable list into the box labelled Numeric Variable(s) > Output Variable, or String Variable(s) > Output Variable for text.
- Click the Name field and type a new variable name, such as q1_3cat. Keep names short; you will be typing them again in every later syntax command.
- Click Label and type a readable description, such as “Agreement, three categories”. This label travels into your output tables, so make it a caption you would be happy to publish.
- Click the Change… button. The Old and New Values dialog opens.
- In the dialog, type the old value or range on the left and the new value on the right. For the first rule, enter 1 THRU 2 on the left and 1 on the right, then click Add. The rule moves into the list at the bottom of the dialog.
- Add the remaining rules the same way: 3 to 2, then 4 THRU 5 to 3. Each rule must end up in the list before you close the dialog.
- Click Continue. Back on the main dialog, click Continue again if you want more rules for the same output variable, then OK.
- Label the new codes in Variable View: click the Values cell for q1_3cat, click Add, and enter 1 for “Disagree”, 2 for “Neither” and 3 for “Agree”. Without these labels your frequency table will just show bare numbers.
- Run Analyze > Descriptive Statistics > Frequencies and look at the result. You should see three categories with counts that add up to the number of valid responses on q1.
Rules are read left to right and the first match wins, so overlapping ranges give surprising results. If you want every value you did not list to pass through unchanged, add a final rule with ELSE = COPY. Leaving that rule out is the single most common cause of a recoded variable that comes back empty.
The equivalent syntax for the same job:
RECODE q1 (1 THRU 2 = 1) (3 = 2) (4 THRU 5 = 3) INTO q1_3cat.
VARIABLE LABELS q1_3cat 'Agreement, three categories'.
VALUE LABELS q1_3cat 1 'Disagree' 2 'Neither' 3 'Agree'.
EXECUTE.
Paste that into the Syntax Editor and press the green triangle, or Run > All. The ELSE = COPY rule is optional here because every possible value from 1 to 5 is already covered, but add it as soon as you recode a continuous variable where unknown values could exist.
How to Recode Categories With Compute Variable
Reach for Compute Variable when the new value comes from a rule rather than a lookup table. A recode maps each old value to a fixed new value. A computation produces a number from an expression, a condition, or both.
The route is Transform > Compute Variable. You get a target variable box at the top, a large numeric expression field, and an if box underneath for conditions.
A worked example: turn hours worked per week into an overtime flag.
- Open Transform > Compute Variable.
- Click Target Variable and type overtime.
- In the expression box type 0, then click IF at the bottom left of the dialog and enter hours > 40 by typing the variable name from the list, then clicking the > button and typing 40.
- Click Continue and then OK. Every case gets 0, and cases over 40 get overwritten with 1.
The syntax version is shorter and easier to check:
IF (hours > 40) overtime = 1.
EXECUTE.
Two other patterns come up often. To build several dummy variables from one categorical variable, name each target and give it its own IF line. To collapse a scale into a total score, use the mean of a range of items:
COMPUTE mean_score = MEAN(q1 TO q10).
COMPUTE n_agree = SUM(q1 TO q10).
EXECUTE.
Reverse coding is the one case where the two methods overlap, and both work. The recode version is more explicit about the mapping, so I reach for it first:
RECODE q1 (1=5) (2=4) (3=3) (4=2) (5=1) INTO q1r.
EXECUTE.
The compute version, COMPUTE q1r = 6 – q1., only works when the scale really runs 1 to 5 with no missing codes. If your scale has a 6 or 7, that shortcut quietly produces nonsense.
How to Recode Multiple Variables Efficiently
Recoding twelve questionnaire items one dialog at a time is slow and easy to get wrong halfway through. Syntax fixes this, because one command can cover a whole block.
First, check that the variables share a coding scheme. Open the Values column in Variable View and compare a few rows. If item 3 uses 1 to 5 and item 7 uses 0 to 4, a shared mapping will be wrong for one of them.
Then use the TO keyword, which takes a list of source variables on the left and a matching list of target variables on the right:
RECODE q1 q2 q3 q4 q5 q6 (1 THRU 2 = 1) (3 = 2) (4 THRU 5 = 3)
  INTO r1 r2 r3 r4 r5 r6.
EXECUTE.
Pair up the lists carefully. The fifth variable on the left feeds the fifth on the right, and SPSS will happily produce a column of system-missing values if a pair is missing or mismatched.
For a larger block where every item needs the same treatment, a loop keeps the syntax short:
LOOP I = 1 TO 10.
  RECODE q{I} (1 THRU 2 = 1) (3 = 2) (4 THRU 5 = 3) INTO r{I}.
END LOOP.
EXECUTE.
Keep a written record of the mapping. A short mapping table, a screenshot of the old-value and new-value grid, or a comment line above each command all serve. Six months later, when a supervisor asks why q7 looks different from the others, you will want the answer in front of you rather than in your memory.
One thing to watch: with syntax, new variables are appended at the end of the file rather than sitting next to their source. A command like RECODE q1 TO q12 INTO r1 r12 uses a range, and once new columns change the layout, ranges stop meaning what you assumed. List variables explicitly when it matters.
How to Verify That the Recoding Worked
Verification takes about a minute and catches nearly every mistake. Do it every time.
- Run FREQUENCIES on the original variable first. Note the total valid N and each category count. Do this before you recode, not after, so you have something to compare against.
- Run FREQUENCIES on the new variable. The counts should add up to the same total N. If the new variable has fewer cases, you dropped something, usually by forgetting ELSE = COPY or by hitting an unmapped range.
- Read the Values column of the new variable. Value labels do not travel automatically from the source variable. Without them, your output shows 1, 2, 3 and nobody can read it.
- Run a crosstab. Put the source and the recoded variable in a cross-tabulation and check the diagonal. If the mapping is correct, every case sits on a single diagonal line with nothing in the off-diagonal cells.
- Check the missing settings. System-missing appears as a dot and is excluded from every calculation. User-missing is a real stored value that you have declared with MISSING VALUES, so it shows in the value list and is treated as excluded only because you said so.
- Save the file once you are satisfied, and keep the syntax file alongside it.
Syntax for the checks:
FREQUENCIES VARIABLES=q1 q1_3cat.
CROSSTABS TABLES=q1 BY q1_3cat.
MISSING VALUES q1_3cat (9).
If you want to strip the original data of placeholders, do it as an explicit step rather than folding it into the recode, so you can see the effect in the output.
Common Mistakes That Wreck Recoded Data
The new variable comes back all system-missing. Almost always a missing ELSE = COPY rule. Every value you did not list has nowhere to go, so SPSS assigns system-missing. Add the rule and rerun.
You recoded into the same variable and cannot get the data back. Recode into Same Variables overwrites the column immediately, and SPSS has no undo for it. This is the reason to work on a saved copy. If it already happened, close without saving and reopen the file.
String values refuse to match. String recoding is case sensitive, so ‘Male’ does not match ‘male’, and short strings arrive padded with trailing spaces. Wrapping the old value in parentheses with a space before the closing bracket works around the padding: (‘Male’ = 1). For case, convert first with STRING(UPPER(q2),A10) or handle it during data entry.
You recoded a string or date variable straight into numbers. You cannot recode a string variable into a numeric one without converting it first. The top question in r/spss is exactly this, and the answer is the ALTER TYPE command:
ALTER TYPE STRING(A4) age (A5).
RECODE age ('18'='18') ('19'='19') INTO agenew.
EXECUTE.
For dates, the same idea converts a date variable into a day number so you can band it by range:
ALTER TYPE date(f.0) startdate (DATE10).
RECODE startdate (LO THRU 20200101 = 1) (THRU 20201231 = 2) INTO period.
EXECUTE.
99 and 999 show up as real categories. Those are user-missing codes someone entered, not blanks. Declare them with MISSING VALUES so frequency tables exclude them, or recode them to system-missing deliberately.
The labels look wrong or have vanished. Value labels belong to a variable, not to a value, so a new variable starts with none. Add them in Variable View or with VALUE LABELS.
You assumed every category got recoded. Open the Old and New Values dialog after the fact and count your rules. Three rules for a six-point scale leaves three categories sitting as system-missing.
Automatic Recode sorted your categories alphabetically. Transform > Automatic Recode is handy for long string lists, but it orders results A to Z, so categories end up in an order that rarely means anything. Use a manual recode when the order matters.
One habit worth keeping: never overwrite the source. Recode into a new variable, check it with FREQUENCIES and a crosstab, and only delete the old column once you are satisfied.
Frequently Asked Questions
What does recoding data mean in SPSS?
Recoding means replacing the values of a variable with new values so they fit your analysis. You map each existing value or range to a new one: collapsing five Likert responses into three groups, turning an age number into a band, or reversing an item so high scores mean the opposite. The new values can overwrite the original column or go into a separate variable.
How do I recode variables into different variables in SPSS?
Go to Transform, then Recode into Different Variables. Move your source variable into the Output Variable box, give it a name and a label, then click Change to open Old and New Values. Enter each old value or range with its new value and click Add. Click Continue twice and OK. Finally, add value labels in Variable View and check the result with Frequencies.
Why is my new recoded variable all system-missing?
The usual cause is a missing ELSE = COPY rule, so every value you did not list has nowhere to go and gets system-missing. Other causes include a case-sensitive string mismatch, like ‘Male’ against ‘male’, an unmapped range, or an ALTER TYPE step that failed because the source variable was still a string. Reopen Old and New Values and count your rules against the original categories.
How do I recode string variables into numeric in SPSS?
Convert first, then recode. Use ALTER TYPE to change the storage type, for example ALTER TYPE STRING(A4) age (A5), then recode the string values into numbers. Recoding a string directly into a numeric target does not work because SPSS cannot map text to numbers on its own. Watch for case sensitivity and for short strings padded with trailing spaces.
How do I reverse-code a Likert scale item in SPSS?
Map each value to its mirror image. On a five-point item, RECODE q1 (1=5) (2=4) (3=3) (4=2) (5=1) INTO q1r creates a reversed copy, which you then add to a total or mean score with COMPUTE. The shortcut COMPUTE q1r = 6 – q1 works only when the scale runs exactly 1 to 5 with no missing codes.
What is the difference between recode, automatic recode and compute?
Recode maps existing values to new ones and is your default choice. Automatic Recode does the same for long string lists but sorts results alphabetically, which rarely matches a meaningful order. Compute Variable builds a value from an expression or a condition instead of a lookup, so it suits totals, indices and flags. Visual Binning is for grouping a continuous variable into narrow intervals.
Conclusion
Start by reading the Values column in Variable View so you know exactly which codes are real. Save a copy of the file, recode into a new variable rather than over the original, write down every old-value to new-value mapping, and add an ELSE = COPY rule if any value is unaccounted for. Then run FREQUENCIES on both variables and a crosstab between them before you analyse anything.
Once you have done that a few times, work mostly in the syntax editor. It is faster than clicking through dialogs, and the syntax file doubles as the documentation of every transformation you applied.