
To reverse score items in SPSS, subtract each response from one more than the highest value on your scale. On a 1-to-5 Likert scale that is 6 minus the response, on a 1-to-7 scale it is 8 minus the response, and you run it through Transform > Recode into Different Variables, which writes the flipped scores into a new column and leaves your original data alone.
Negatively worded items run the opposite direction to the rest of a questionnaire. Someone who agrees with “I worry about things that might go wrong” ticks a low number if low means agree, while the positive items on the same scale get high numbers. Add those together and the scale score is noise. Reverse scoring flips every response so high always means more of the construct, and then summation, means and Cronbach’s alpha actually work.
It takes about five minutes per item once you know the scale range. The fiddly part is not the arithmetic, it is knowing which items your scale actually lists as reverse-keyed.
Table of Contents
- 1What You Need
- 2Step-by-Step: How to Reverse Score Items in SPSS
- 3Compute the Reverse-Score Formula
- 4Use Transform > Recode into Different Variables
- 5Check That the Reverse-Scored Variable Is Correct
- 6Common Mistakes and Fixes
- 7Frequently Asked Questions
- 8What is the formula for reverse scoring items in SPSS?
- 9Can I reverse score multiple Likert items in SPSS at the same time?
- 10Should I reverse score items using Transform u0026gt; Recode or Compute Variable?
- 11How do I handle missing values when reverse scoring in SPSS?
- 12How do I check that reverse-scored SPSS items are correct?
- 13Can I calculate a total or mean score after reverse scoring items in SPSS?
- 14Conclusion
What You Need
Three things, and one habit worth forming.
- The true minimum and maximum of your scale. Not the anchors people type into the questionnaire, the actual numeric values stored in the data. A 1-to-5 item is 6 minus the score. A 0-to-10 item is 11 minus the score.
- The documented reverse-keyed item list. Take it from the scale manual, the validation paper, or the published scoring key. Researchers working from the International Personality Item Pool representation of the Big Five, for example, reverse items 6, 21 and 31 on Extraversion, 2, 12, 27 and 37 on Agreeableness, 8, 18, 23 and 43 on Conscientiousness, and 9, 24 and 34 on Neuroticism.
- A fresh variable for each reversed item. Work in SPSS versions where Transform > Recode into Different Variables is available. PSPP has the same menu path and near-identical dialogs.
- A habit of not overwriting originals. Keep Q1 and Q2 in your file, add Q1R and Q2R beside them. If your supervisor asks why alpha changed, you will want both versions available.
One more check before you touch anything: confirm the direction of your value labels. Imported datasets sometimes code 1 as strongly agree and sometimes as strongly disagree, and if you guess wrong the reverse sends your whole scale the wrong way. Open Data View, click the column header, and read the actual values.
If your responses arrived as text rather than numbers, sort that out first. The steps below assume numeric variables, and a string column will not compute.
Step-by-Step: How to Reverse Score Items in SPSS
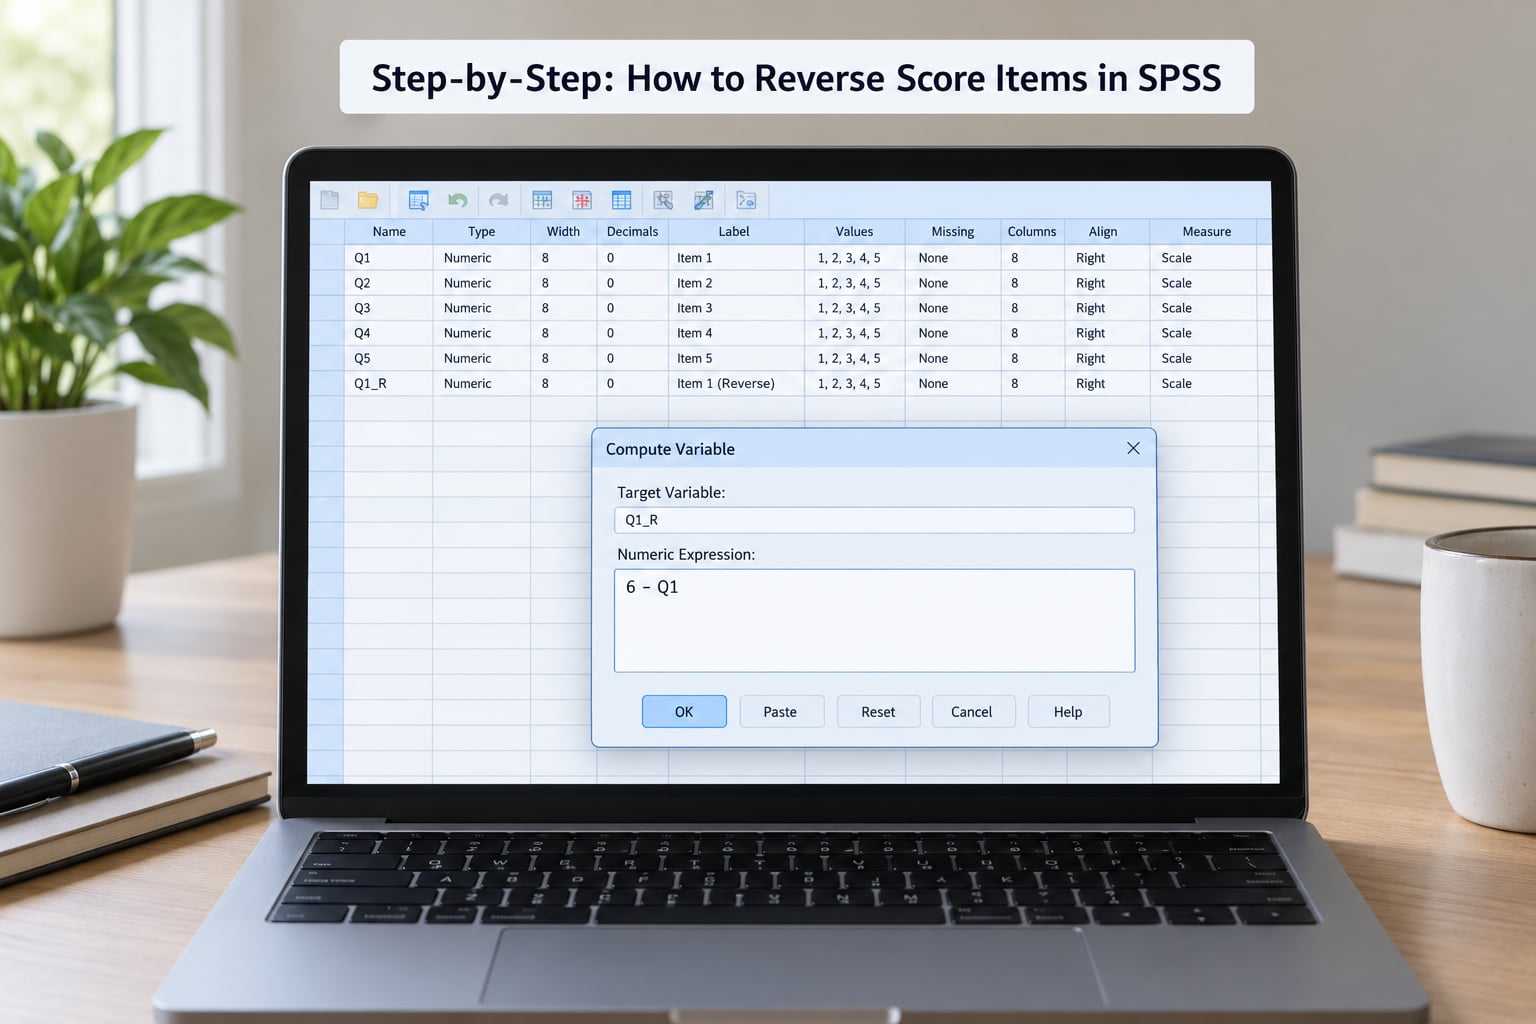
Compute the Reverse-Score Formula
The rule is one plus the highest possible value, minus the response. Everything else is a variation on that.
| Scale | Reverse formula | Example using a response of 2 |
|---|---|---|
| 1 to 4 | 5 − x | 3 |
| 1 to 5 | 6 − x | 4 |
| 1 to 7 | 8 − x | 6 |
| 0 to 10 | 11 − x | 9 |
Here is what a 1-to-5 item looks like after reversing. The midpoint stays put, which is the quickest sanity check you can do.
| Original response | Reversed on a 1-to-5 scale | Reversed on a 1-to-7 scale |
|---|---|---|
| 1 | 5 | 7 |
| 2 | 4 | 6 |
| 3 | 3 | 3 |
| 4 | 2 | 4 |
| 5 | 1 | 5 |
If you like working in the Syntax window, this is the whole job for one item on a 1-to-5 scale. Paste it into File > New > Syntax, then Run > All.
COMPUTE Q1R = 6 - Q1.
VARIABLE LABELS Q1R 'Q1 reversed'.
EXECUTE.
COMPUTE keeps system-missing values missing on its own, so a skipped item stays skipped rather than turning into a number.
Use Transform > Recode into Different Variables
The menu method is slower but it shows you exactly what happened to every value, and it is the route most people should take the first time.
- Go to Transform > Recode into Different Variables.
- Drag Q1 from the left-hand list into the Input Variable box and click the arrow so it sits there. If several items share one scale, drag Q1, Q6 and Q21 across together.
- Drag an empty cell from the Variable View list into Output Variable and type the new name, something like Q1R.
- Click Add. The Old and New Values dialog opens.
- Enter 1 in the Old Value box and 5 in the New Value box, then choose Add. Repeat for 2 into 4, 3 into 3, 4 into 2 and 5 into 1.
- Click Continue, then OK. SPSS asks about missing values. Say yes if you want system-missing cases handled automatically, or no to deal with them yourself.
- Repeat for each reverse-keyed item you dragged across.
For a 1-to-7 scale, map 1 to 7, 2 to 6, 3 to 5, 4 to 4, 5 to 3, 6 to 2 and 7 to 1.
The paste-ready syntax equivalent, which you can also run straight from the Syntax window, looks like this for three reverse-keyed items on a 1-to-5 scale.
RECODE Q6 (1=5) (2=4) (3=3) (4=2) (5=1) INTO Q6R.
RECODE Q21 (1=5) (2=4) (3=3) (4=2) (5=1) INTO Q21R.
RECODE Q31 (1=5) (2=4) (3=3) (4=2) (5=1) INTO Q31R.
VARIABLE LABELS Q6R 'Q6 reversed'.
VARIABLE LABELS Q21R 'Q21 reversed'.
VARIABLE LABELS Q31R 'Q31 reversed'.
VALUE LABELS Q6R 1 'Strongly disagree' 2 'Disagree' 3 'Neither' 4 'Agree' 5 'Strongly agree'.
VALUE LABELS Q21R 1 'Strongly disagree' 2 'Disagree' 3 'Neither' 4 'Agree' 5 'Strongly agree'.
VALUE LABELS Q31R 1 'Strongly disagree' 2 'Disagree' 3 'Neither' 4 'Agree' 5 'Strongly agree'.
VARIABLE LEVEL Q6R (SCALE).
VARIABLE LEVEL Q21R (SCALE).
VARIABLE LEVEL Q31R (SCALE).
EXECUTE.
Notice the VALUE LABELS lines. This is the gotcha that catches almost everyone: a recoded variable arrives with numbers and no words. The original Q6 still reads Strongly agree at 5, while Q6R sits there as a bare 1 with nothing attached. Add the labels back, and match them to the reversed direction, so 5 means strongly agree on Q6R only if 5 was strongly disagree on Q6.
If you prefer a loop when you have a long list of items, the same thing without repeating yourself is a DO IF loop over the item numbers.
DO IF (NUMBER($Q, 'LOWEST')) .
COMPUTE idx = $Q .
END IF.
LOOP x = 6 TO 44 .
IF (ANY(idx, 6, 21, 31)) Q6R = 6 - Q6.
IF (ANY(idx, 8, 18, 23, 43)) Q8R = 6 - Q8.
END LOOP.
EXECUTE.
For most people that is more trouble than it is worth. Listing each RECODE line plainly takes a minute and is easier to check later.
Check That the Reverse-Scored Variable Is Correct
Do not skip this. A reversed variable that is subtly wrong is worse than no reversed variable, because it feeds bad numbers into everything downstream.
- Run Analyze > Descriptive Statistics > Frequencies and tick Q1 and Q1R together.
- Compare the Valid and Missing counts. They should match exactly. If Q1R has fewer cases, a RECODE line did not run or you typed the input name wrong.
- Look at the value labels printed next to each code in the Frequencies table. This is where the missing labels from earlier show up as bare numbers.
- Check the minimum and maximum. Q1R should reach the same low and high values as Q1, just with opposite meaning.
- Run Analyze > Scale > Reliability Analysis, move in all the items including the reversed ones, and read alpha. It should rise, or at minimum the item-total correlations for the reverse-keyed items should turn positive.
If alpha is still low after correct reverse scoring, run through this order before touching the data again. First, confirm you reversed exactly the items the scoring key lists and nothing more. A common recommendation from researchers working with validated personality instruments is to reverse only what the manual flags, not items that personally sound backwards to you. Second, check the direction of your value labels, since a reversed scale on the wrong side inverts every item. Third, look at each item’s alpha if Statistics was ticked in the Reliability dialog, and see whether any item is behaving oddly for reasons unrelated to wording.
Finally, build the composite score once the items are clean.
COMPUTE Extraversion = MEAN(Q1, Q2, Q3, Q4, Q5, Q6R, Q21R, Q31R).
COMPUTE Extraversion_sum = SUM(Q1, Q2, Q3, Q4, Q5, Q6R, Q21R, Q31R).
EXECUTE.
MEAN() averages only the items each person actually answered, which is usually what you want with survey data. SUM() treats a missing item as a lower score, so use it only when you have already screened for missingness.
Common Mistakes and Fixes
Each of these shows up repeatedly in forums and course forums alike.
Using the wrong scale range. Someone coding a 0-to-4 item types 5 minus the score, which turns a 0 into a 5 and pushes it above the scale maximum. Read the true minimum, not the number of categories minus one. A 0-to-4 scale is 5 minus x, a 1-to-5 scale is 6 minus x.
Reversing items that were never reverse-keyed. It is tempting to flip any item you dislike the wording of. That is not reverse scoring, it is rewriting the instrument, and it distorts the reliability you are trying to measure. Follow the published key.
Reversing only half of them. The usual cause is a spreadsheet of item numbers where one row got missed. Build a column of every reverse-keyed item first, then work down it, then check the count against your list before running reliability.
Forgetting that value labels do not carry over. RECODE creates a new variable that starts with numbers only. Add VALUE LABELS lines, or relabel through the Value Labels button in Variable View, and confirm the direction matches the reversed coding.
Leaving missing values unhandled. Values you do not list in a RECODE command are carried across unchanged, so a 9 meaning refused or refused-to-answer stays a 9 and then gets averaged into your total. Map those codes explicitly with something like (9=SYSMIS), and check the Missing column in Frequencies afterwards.
Overwriting the original variable. Never recode into the same variable when a new one exists. Recode into Same Variables rewrites your data, and there is no undo. SPSS has no built-in reverse-items button in the Reliability dialog either, so the recode is always a separate step.
Confusing reverse coding with re-labelling. Changing a value label so that 1 reads strongly agree is not reverse scoring. It changes the words printed in your output while the underlying numbers stay exactly where they were, and any analysis you run afterwards is unchanged.
Assuming the menu path is identical everywhere. The Transform menu has been stable for years, but dialog wording differs slightly between IBM SPSS Statistics releases, and PSPP reworded a few labels. If a field is missing, the arithmetic still holds.
Working in another tool? The logic is identical: in Stata it is gen Q1R = 6 - Q1, in R it is df$Q1R <- 6 - df$Q1, and in Excel a formula like =6-Q1 filled down the column does the job. Stata and R users moving an SPSS project across usually need the value labels rebuilt too.
Frequently Asked Questions
What is the formula for reverse scoring items in SPSS?
Reverse scoring subtracts each response from one more than the highest value on your scale, so the formula is (maximum + 1) minus the original response. A 1-to-5 Likert item is 6 minus Q1, a 1-to-7 item is 8 minus Q1, and a 0-to-10 item is 11 minus Q1. In SPSS you enter it with COMPUTE Q1R = 6 – Q1 or map each value in Recode into Different Variables.
Can I reverse score multiple Likert items in SPSS at the same time?
Yes. Open Transform u0026gt; Recode into Different Variables, drag several variables sharing the same scale into the Input Variable box, and add one Output Variable for each of them, naming them Q1R, Q6R and so on. In syntax, write one RECODE line per item and end the block with EXECUTE. Always reverse items that share a scale range together, since one formula covers all of them.
Should I reverse score items using Transform u0026gt; Recode or Compute Variable?
Use Compute Variable when all your items share one scale, because 6 minus Q1 handles missing values cleanly and takes seconds to set up. Use Transform u0026gt; Recode into Different Variables when items use different ranges, when you want to see each old value mapped to its new value, or when you need to move specific codes such as 9 to system-missing. Both routes produce identical results if you set them up correctly.
How do I handle missing values when reverse scoring in SPSS?
COMPUTE handles them automatically, because 6 minus a missing case returns system-missing. RECODE copies any value you do not list straight across, so out-of-range codes like 9 stay 9 and get counted as real responses. Map them explicitly with (9=SYSMIS) inside the RECODE command, then confirm the case counts in Analyze u0026gt; Descriptive Statistics u0026gt; Frequencies before computing totals.
How do I check that reverse-scored SPSS items are correct?
Run Analyze u0026gt; Descriptive Statistics u0026gt; Frequencies on the original and reversed variables together. The valid and missing counts should match, and the minimum and maximum should reach the same endpoints. Re-read the value labels printed beside each code, since recoding strips them. Finally run Analyze u0026gt; Scale u0026gt; Reliability Analysis with all items and confirm alpha improved and item-total correlations are positive.
Can I calculate a total or mean score after reverse scoring items in SPSS?
Yes, and the reversed variables simply take the place of the originals in the formula. Use COMPUTE Total = SUM(Q1, Q2, Q3, Q6R, Q21R) for a sum score, or COMPUTE Mean = MEAN(Q1, Q2, Q3, Q6R, Q21R) for a mean that averages only the items each person answered. Include the original variables for positively worded items and the R versions for reverse-keyed ones.
Conclusion
Start by confirming the minimum and maximum on your scale and the exact list of reverse-keyed items from the scoring manual. Then run one item as a test: COMPUTE Q1R = 6 – Q1, check it in Frequencies, and once that looks right do the rest.
Keep your original variables. Reach for Compute Variable when every item shares a scale, and for Transform > Recode into Different Variables when the ranges differ or you need control over specific codes. Either way, add the value labels back and re-run reliability before you build any totals.