
If you have a dichotomous outcome — yes/no, pass/fail, male/female — and want to know whether the observed proportion differs from a value someone claims, the binomial test is your procedure. In SPSS it takes about two minutes: open the Binomial dialog, drop in your variable, type the proportion you are testing against, and read the Exact Sig. column. No test statistic is produced, only an exact p-value.
This guide walks through the whole path: what your data has to look like, the menu clicks, the copy-paste syntax, how to read every column of the output, and how to write the result up. It works in IBM SPSS Statistics 26 through the current release; the dialog has not moved in any of them.
Table of Contents
- 1What You Need
- 2Your outcome must have exactly two categories
- 3You need a test proportion decided in advance
- 4Your data has to be in case-by-case form
- 5The four assumptions, in short
- 6Step-by-Step: How to Run a Binomial Test in SPSS
- 7Step 1: Check what is actually in the variable
- 8Step 2: Open the Binomial dialog
- 9Step 3: Move your variable across
- 10Step 4: Set the Test Proportion
- 11Step 5: Tick the optional boxes
- 12Step 6: Run it and read the output table
- 13How to Run a Binomial Test in SPSS Using Syntax
- 14The category-order gotcha
- 15If you only have a summary table
- 16Common Mistakes
- 17Frequently Asked Questions
- 18When should I use a binomial test in SPSS?
- 19What is the difference between exact and asymptotic binomial results?
- 20How do I choose the number of successes in SPSS?
- 21What does a significant binomial test mean?
- 22Can I use a binomial test when the expected proportion is not 0.50?
- 23How do I report a binomial test in APA style?
- 24Conclusion: What to Do First
What You Need
Three things have to be true before you open the dialog, and SPSS will not warn you when they are not.
Your outcome must have exactly two categories
The variable holds a dichotomous variable — one where each case falls into exactly one of two groups. Male/female, pass/fail, symptoms present/absent, clicked/did not click. If you have three or more categories, SPSS still runs the test, but the result is not the one you think it is, because the test proportion gets applied to the first category in the file and everything else collapses into “the rest”.
You need a test proportion decided in advance
The test proportion is the null value you are comparing against: .50 for a coin-flip question, or .20 if a previous study reported a 20% prevalence rate. Write it down before you look at your data. Choosing it after seeing the observed proportion is the single most common way this test gets misused.
Your data has to be in case-by-case form
One row per participant, with the outcome coded 1 and 2, or 0 and 1, or Yes and No. Labels are fine; the codes are what matter. If all you have is a summary table — “12 yes, 8 no” — you need the WEIGHT CASES route further down, which is a two-line fix.
The four assumptions, in short
- Binary — two categories, every case counted in one of them.
- Independent — one person’s answer does not change another’s.
- n fixed — you decide how many observations you will observe before you start.
- Same probability — every case carries the same chance of success under the null.
The normality assumption everyone worries about does not apply here. That is why the binomial test is the better call than a one-proportion z test whenever your sample is small — it needs no approximation of a sampling distribution.
Step-by-Step: How to Run a Binomial Test in SPSS
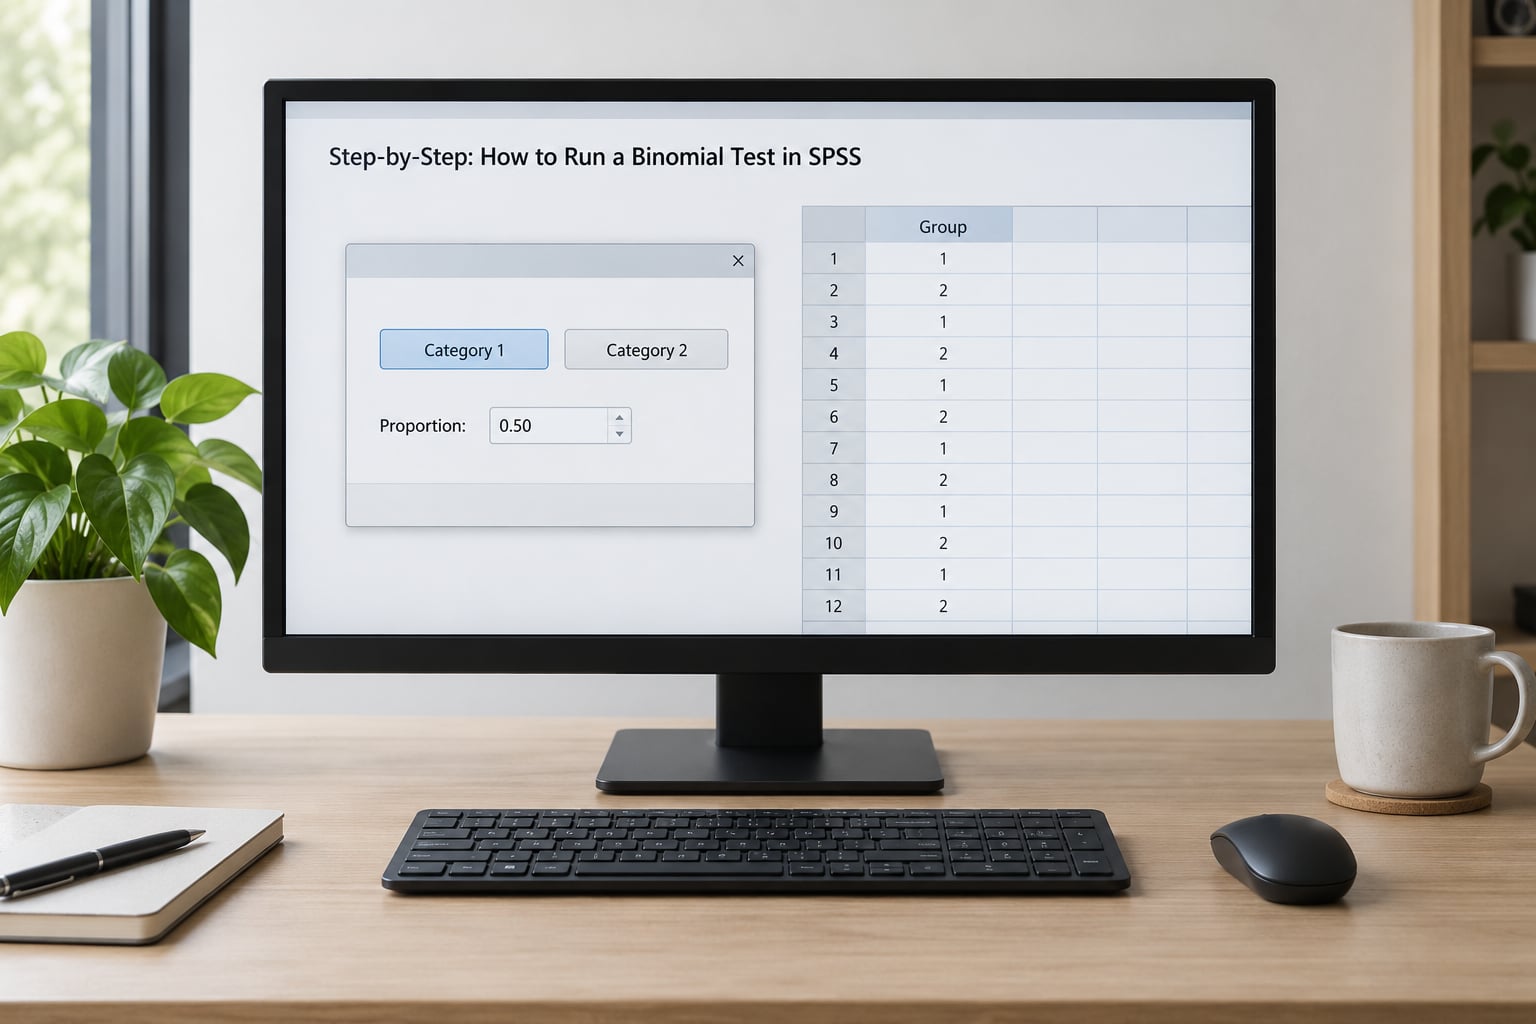
Step 1: Check what is actually in the variable
Run a frequency table first. Go to Analyze > Descriptive Statistics > Frequencies, move your variable in, click Statistics, tick Display frequency tables, then OK. You are checking for three things: exactly two categories, no stray values hiding outside them, and a total that matches the sample size you expect.
Step 2: Open the Binomial dialog
Go to Analyze > Nonparametric Tests > Legacy Dialogs > Binomial. The Binomial test lives in the Legacy Dialogs submenu in every modern SPSS release — the newer “Nonparametric Tests” home screen does not include it, which is why so many people tell each other the test has disappeared. It has not.
Step 3: Move your variable across
Select your outcome variable in the left-hand list and click the arrow into the Test Variable box. One variable only. The dialog is a single-sample procedure; there is nowhere to put a second group.
Step 4: Set the Test Proportion
Type your hypothesized proportion into the Test Proportion box. It defaults to .5. Change it to .20 and SPSS tests against 20%, not 50%.
Step 5: Tick the optional boxes
Tick Descriptive to get the mean, standard deviation, minimum, maximum and nonmissing N. Tick Quartiles only if you want percentiles. To get the confidence interval for the observed proportion, right-click anywhere in the output window, choose Output Settings, and tick Confidence intervals — that is a global output option, not a checkbox in this dialog.
Step 6: Run it and read the output table
Click OK. The Output Viewer produces a Binomial Test table. Every column means something specific:
| Column | What it means | How to use it |
|---|---|---|
| Category | The two codes as stored in your file | Check which one the test proportion was applied to |
| Observed Proportion | Successes divided by nonmissing N | Your real rate, e.g. .467 |
| Test Proportion | The null value you typed in | The claim you are testing |
| Exact Sig. (1-tailed) | P(observed or more extreme, one direction) | Use only for a directional hypothesis |
| Exact Sig. (2-tailed) | Probability in both directions | The value you report for a non-directional question |
| Confidence interval lower/upper | Exact (Clopper-Pearson) bounds for the observed proportion | Turn on via Output Settings |
The Exact Sig. value is the probability of getting your result — or something further from the test proportion — if the test proportion were true. It is not the probability that the null hypothesis is true. That distinction matters when you write it up.
How to Run a Binomial Test in SPSS Using Syntax
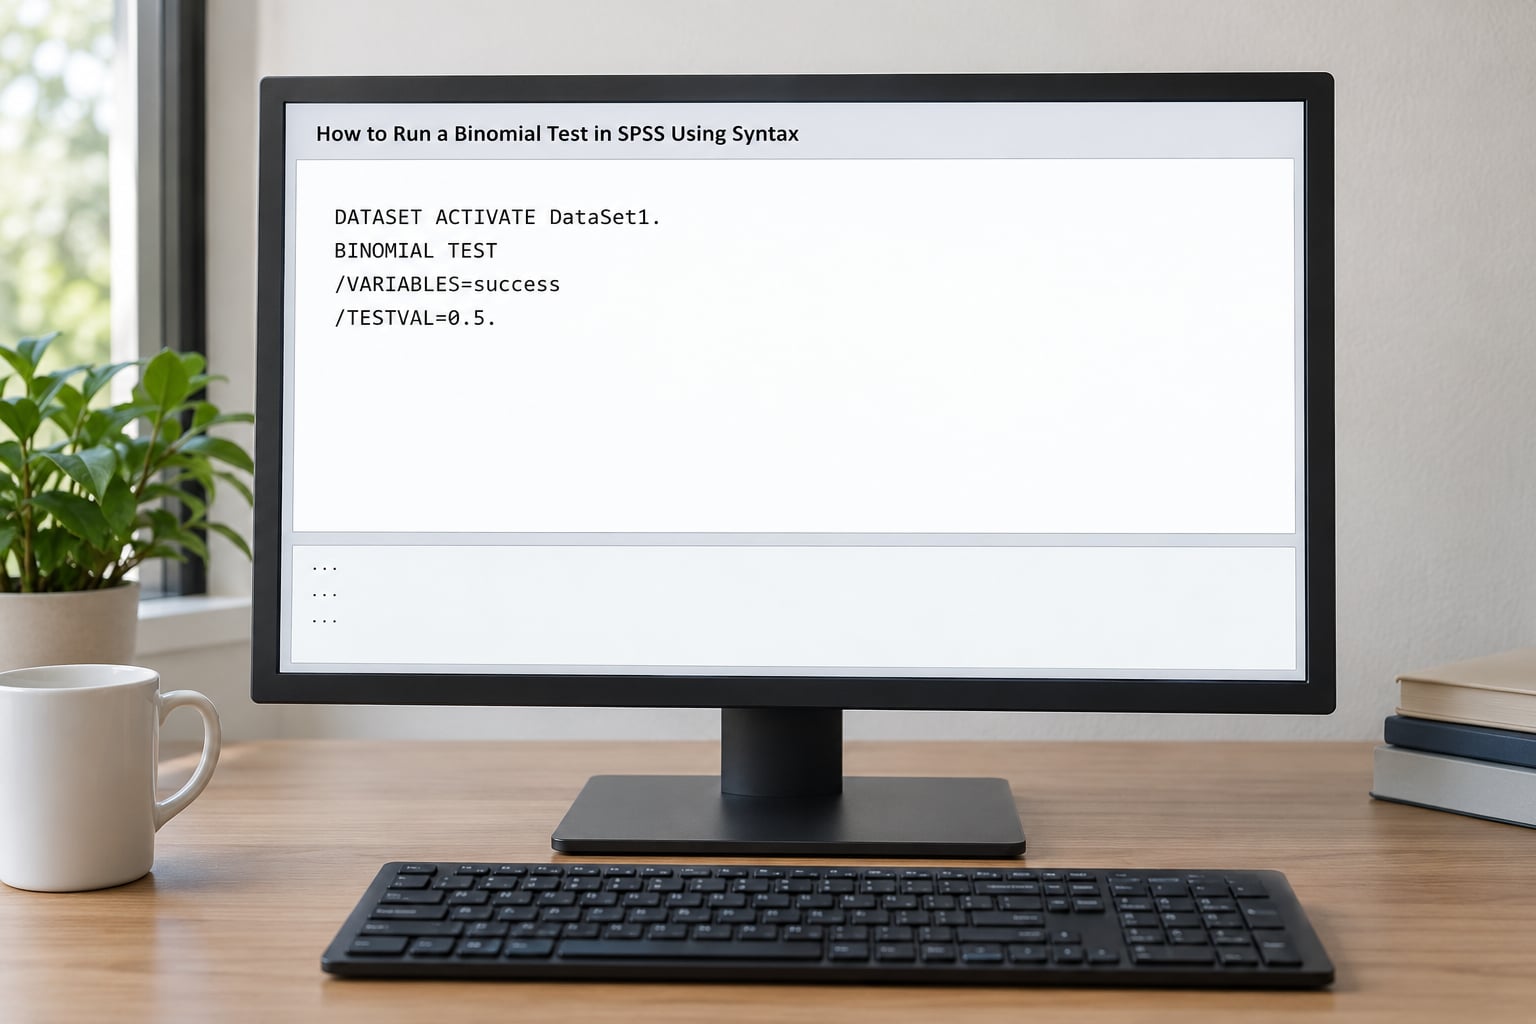
The menu path is fine, but syntax is faster once you have done it twice and it is the only route for summary data. Open a syntax window with File > New > Syntax, paste this, and run it:
NPAR TESTS
  /BINOMIAL (.50) = outcome
  /MISSING ANALYSIS.
Replace .50 with your test proportion and outcome with your variable name. The Paste button inside the Binomial dialog writes this block for you, with the values already filled in, so you can learn the syntax by letting SPSS write it.
The category-order gotcha
The test proportion applies to the first category in your data file, not to the category you were thinking about. If your 1s and 2s were entered in mixed order, SPSS may attach your .50 to the wrong group and you will get a p-value for a test you never intended. Sort the file first and the problem disappears:
SORT CASES BY outcome.
NPAR TESTS
  /BINOMIAL (.50) = outcome
  /MISSING ANALYSIS.
Sorting is cheap and it makes the output table’s Category column line up with your coding notes. I do it every time.
If you only have a summary table
When your data is counts rather than cases, weight the rows by their frequency:
DATA LIST LIST /outcome (A1) count (F3.0).
BEGIN DATA
1 12
2 8
END DATA.
WEIGHT BY count.
NPAR TESTS /BINOMIAL (.50) = outcome /MISSING ANALYSIS.
WEIGHT OFF.
Turning the weight off afterwards matters. Leave it on and every other procedure in the session silently reads 20 cases instead of your real sample.
Common Mistakes
| Symptom | Cause | Fix |
|---|---|---|
| Two-tailed Sig. column is blank | SPSS reports a valid 2-tailed exact value only when the test proportion is .50 | Report the 1-tailed value and state the direction of your hypothesis in the write-up |
| Result flips when you change .50 to .20 | Test proportion attached to the wrong category | Add SORT CASES BY before the test |
| Category shows three or more rows | Variable is not dichotomous | Recode into two groups first, and decide where the borderline cases go before you do it |
| Total is smaller than N | Missing values, or blanks coded as system-missing by accident | Check the data in Variable View, then use /MISSING ANALYSIS |
| Output has no confidence interval | Interval is an output setting, not a dialog checkbox | Right-click the Output Viewer > Output Settings > Confidence intervals |
| Weighted counts after a WEIGHT CASES run | Weight left switched on | WEIGHT OFF before the next procedure |
| Comparing two groups of proportions | A one-sample binomial test cannot compare groups | Use a chi-square test of independence or a 2-proportion z test; for paired responses use McNemar’s test |
That last row comes up more than you would think. “Binomial-binomial data” — two groups, two outcomes, a cohort comparison — is not this test. The binomial test handles exactly one proportion. Comparing a malnourished cohort to a well-nourished one needs a chi-square or Fisher’s exact test, and if each woman was measured twice you need McNemar’s. Using the binomial test here produces a confident answer to a question nobody asked.
One more reporting habit: state the test proportion and the direction in the sentence before the p-value. A reader should never have to infer whether .006 was one-tailed or two.
Frequently Asked Questions
When should I use a binomial test in SPSS?
Use it when you have one dichotomous outcome, one fixed sample size, and a hypothesized proportion to compare against, such as 50% or a rate from earlier work. It is an exact test, so it works well with small samples where a one-proportion z test or chi-square approximation would be unreliable. If you have two groups to compare, this is the wrong procedure.
What is the difference between exact and asymptotic binomial results?
An exact result is computed straight from the binomial distribution, so it is valid at any sample size and is what SPSS reports for the Binomial test. An asymptotic result uses a normal approximation to the sampling distribution, which is faster but needs a decent sample size to be trustworthy. With small n, always go with the exact value SPSS gives you.
How do I choose the number of successes in SPSS?
You do not choose it directly. SPSS treats the first category in your data file as the success and applies the Test Proportion value to it. If that is not the group you meant, run SORT CASES BY your variable before the test so the coding order is deterministic. Confirm which row in the output Category column carries the Test Proportion value.
What does a significant binomial test mean?
It means the observed proportion differs from your test proportion by more than chance would usually explain, at your alpha level, typically .05. It does not tell you the direction, how large the difference is, or how important it is. Report the observed proportion, the test proportion, the exact p-value, and the confidence interval so the reader can see the size of the difference.
Can I use a binomial test when the expected proportion is not 0.50?
Yes, and you should. Change the Test Proportion box to your value, for example .20, or write (.20) instead of (.50) in the NPAR TESTS syntax. SPSS then tests whether the observed proportion differs from 20%. Note that a two-tailed exact significance is only reported when the test proportion is .50, so with other values report the one-tailed value with the direction stated.
How do I report a binomial test in APA style?
Name the test, give the counts, both proportions, and the exact p-value: A binomial test showed that 12 of 20 cases (60%) preferred option A, which did not differ significantly from the hypothesized 50% proportion, exact Sig. (2-tailed) = 1.000. Add the confidence interval in the same sentence if you turned it on in Output Settings.
Conclusion: What to Do First
Run FREQUENCIES on your outcome to confirm two clean categories, then open Analyze > Nonparametric Tests > Legacy Dialogs > Binomial, set your test proportion, and read Exact Sig. If the 2-tailed column is blank, your test proportion was not .50. Before you submit anything, confirm you are testing one proportion and not two groups, because that is the mistake the software will happily let you make.