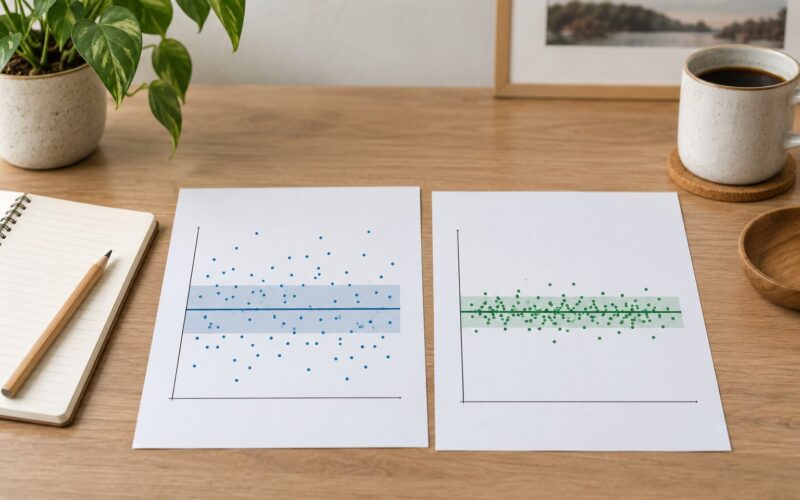
An unsupported hypothesis is a valid research finding, not a failed study. When your p-value sits above your alpha level, you fail to reject the null hypothesis, and the honest next step is to verify that the test actually examined your prediction, check the assumptions and effect size, then report what the data showed.
The wording students get wrong first is “disproved.” Failing to reject the null does not prove your hypothesis false. It means the evidence in your sample was not strong enough to rule out the no-effect explanation, and saying “wrong” overstates what any single test can show.
Three things decide what happens next: whether you tested the hypothesis you wrote down, whether the test was appropriate for the data, and whether the effect was too small or the sample too small to detect. Get those straight before you touch a single sentence of the discussion chapter.
This guide walks through that process in six steps, then gives you report-ready model sentences. It takes about an hour to work through properly, and it is much faster than the three days people usually lose re-running tests hoping the p-value drops.
Table of Contents
- 1What You Need
- 2Step-by-Step: What to Do When Your Hypothesis Is Not Supported
- 3Step 1: Confirm That the Hypothesis Was Actually Tested
- 4Step 2: Check the Statistical Evidence Carefully
- 5Step 3: Investigate Data Quality and Analysis Choices
- 6Step 4: Decide Whether the Result Is Genuine or Unexplained
- 7Step 5: Revise the Interpretation, Not the Evidence
- 8Step 6: Report the Finding Transparently
- 9Common Mistakes
- 10Frequently Asked Questions
- 11Does an unsupported hypothesis mean my study failed?
- 12Should I change my hypothesis after seeing the results?
- 13What do I write in the conclusion when the hypothesis is not supported?
- 14How do I report a non-significant result?
- 15When should I ask my supervisor or a statistician for help?
- 16Conclusion
What You Need

Gather these before you change anything in your analysis. Rushing to re-run tests is what turns an honest null result into a fishing expedition.
- Your research question and hypothesis as written. Pull the exact sentence from your proposal or protocol, not the version you remember approving.
- Your analysis plan. The one you submitted, preregistered, or wrote in your methods section before you looked at the output.
- The raw and processed data. Including the codebook, exclusion rules and a list of any cases you removed.
- The full statistical output. Not just the p-value: the test statistic, degrees of freedom, confidence interval and effect size.
- Your supervisor or methods guidance. Course requirements often state the alpha level and expected reporting format before you choose them.
None of this is new work. It is the same material you used to run the test in the first place, pulled back into one place so you can compare it against the output line by line.
Step-by-Step: What to Do When Your Hypothesis Is Not Supported
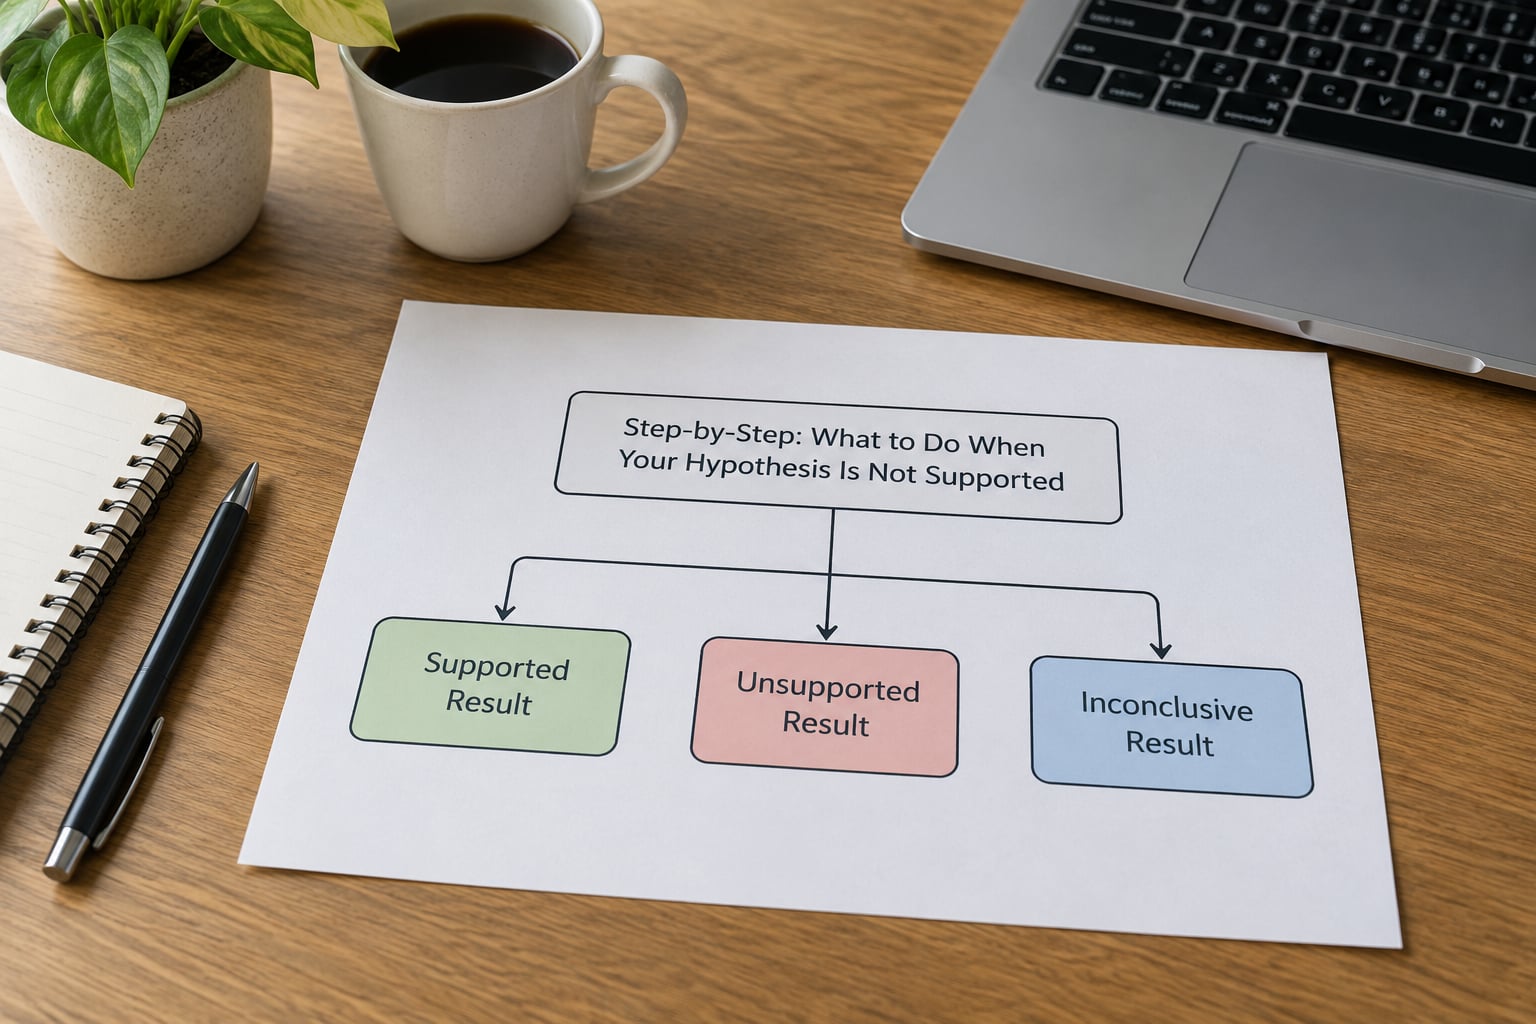
Work through the steps in order. Skipping to Step 5 is how students end up rewriting their hypothesis to match the data, which is the one move that turns a normal finding into misconduct.
Step 1: Confirm That the Hypothesis Was Actually Tested
Most unexpected results come from a gap between what you predicted and what you measured. Put your written hypothesis next to your analysis plan and check them item by item.
- Does the variable you tested match the construct you wrote about, or did you substitute something easier to measure?
- Did the test you ran match the design you planned?
- Was the alpha level set in advance at .05, .01, or whatever your course specified?
- Did the effect point in the direction you predicted?
- Is the test statistic, p-value and confidence interval actually reported in your output?
Direction matters more than most students expect. If you predicted a negative relationship and found a statistically significant positive one, the null is rejected but your directional hypothesis is still not supported. That is a genuinely interesting result and it needs different wording than a plain null.
The three outcomes are not interchangeable, so decide which one you are looking at before you write anything.
| Outcome | What the data showed | How to phrase it |
|---|---|---|
| Supported | Effect in the predicted direction, p below alpha | The hypothesis was supported. |
| Not supported | Effect in the predicted direction, p above alpha | The hypothesis was not supported. Evidence was insufficient. |
| Opposite direction, significant | Effect reversed, p below alpha | The null was rejected; the predicted direction was not confirmed. |
| Inconclusive | Effect near zero, wide interval, low power | No conclusion is drawn; the test could not detect the effect. |
That table is the single most useful thing to keep beside you while writing. Most confusing results are one of these four rows wearing the wrong label.
Step 2: Check the Statistical Evidence Carefully
A p-value above .05 tells you the result did not clear your threshold. It does not tell you the effect was zero, and it never tells you the theory is dead.
Three numbers carry the weight here.
The effect size. For an independent t-test, look at the mean difference and Cohen’s d. For a correlation, look at r. For a chi-square, look at Cramér’s V or the phi coefficient. A p-value of .06 with a d of 0.70 is a very different finding from .06 with a d of 0.04, and reporting only the p-value hides that completely.
The confidence interval. A 95% interval of -0.10 to 0.42 tells you the true effect could be small in either direction. That is an uninformative result about a real, unknown quantity, which is worth writing down in those terms.
Statistical power. With a small sample, a real effect can simply go unseen. If your study had 80% power to detect an effect of the size you expected, a non-significant result is informative. At 40% power, it is close to uninterpretable, and saying so is the more honest position.
Practical significance can survive a non-significant p-value too. A 2% reduction in readmission with a confidence interval of 0.5% to 3.5% is worth discussing even at p = .08, especially if it costs almost nothing. Report it, flag the uncertainty, and label it as a direction for future work rather than a finding.
Step 3: Investigate Data Quality and Analysis Choices
Run through this checklist before accepting the result. It takes twenty minutes and catches a surprising share of genuinely broken analyses.
- Missing values. Were incomplete cases dropped silently, or handled in a way your methods section does not describe?
- Coding errors. Check reverse-scored items and any category that was labelled wrongly in the codebook.
- Outliers. Look for data entry errors first, then decide on a documented rule rather than deleting whatever is inconvenient.
- Scale reliability. Compute Cronbach’s alpha or omega. An alpha below .70 means the items probably are not measuring one thing.
- Independence. Repeated measures from the same participant or clustered classrooms violate the independence assumption in most tests.
- Normality and homogeneity. Check the residuals, not just the raw scores, especially for t-tests and ANOVA.
- Sample size. Compare achieved n against the n your power calculation asked for.
- Model specification. If you ran a regression, check multicollinearity and whether you included the control variables you planned.
- Test choice. Did you use a parametric test on clearly ordinal or heavily skewed data?
If you find a genuine error, fix it, rerun the analysis, and document both the original and the corrected analysis in your write-up. Reporting the correction openly costs you nothing; hiding it costs your credibility.
Step 4: Decide Whether the Result Is Genuine or Unexplained
After the checks above, the result falls into one of four buckets.
A credible contradiction. Assumptions hold, the test was appropriate, power was adequate, and the effect is near zero. The literature genuinely needs updating, and that is a legitimate contribution.
An underpowered test. Your n was too small to detect the effect you predicted. Say so, and treat the study as a pilot that justifies a larger one.
A flawed design or measurement. A broken scale, a confounded manipulation, an uncontrolled room, or a construct measured by a poor proxy. This is a design lesson, not a theory lesson.
Inconclusive. The interval spans zero widely, power is low, and nothing can be concluded either way. This needs cautious wording and a specific next step, not a conclusion.
Write down which bucket you are in before you write a sentence about it. Most student write-ups fail because the conclusion implies bucket one while the numbers describe bucket four.
Step 5: Revise the Interpretation, Not the Evidence
What you can change here is your explanation, not your data. Three sections need work: how you explain the result against prior literature, your limitations paragraph, and your conclusion.
Compare against studies that contradict you and say plainly that they contradict you. Leaving the conflicting literature out of the discussion is the most common weakness reviewers flag, and it reads as either laziness or a search for allies.
Expand the limitations section into a real section rather than a single apologetic sentence. Name the power problem, the sample restriction, the measurement limits, and any confounds, then connect each one to the specific result it affects.
Propose concrete future research rather than a vague call for “more research.” A larger sample in a different population, a qualitative follow-up on why the effect did not appear, or a preregistered replication each count as a direction.
Never change your hypothesis to match the data after seeing the results. If the honest finding is that effect B was stronger than effect A, report that as the finding. Rewriting the prediction is how a legitimate null result becomes a fabricated one.
Step 6: Report the Finding Transparently
Report in a fixed order so a reader can follow the logic: what you tested, what the test returned, what the effect looks like, what decision follows, what it means, and what you cannot conclude.
Fill these in for your own study. The bracketed parts are the numbers you already have in your output file.
Results section. “An independent-samples t-test was conducted to compare [variable A] between [group 1] and [group 2]. The [group 1] mean (M = [x], SD = [y]) did not differ significantly from the [group 2] mean (M = [a], SD = [b]), t([df]) = [value], p = [value], d = [value]. The 95% confidence interval for the mean difference was [low] to [high].”
Discussion, opening. “The hypothesis that [predicted relationship] was not supported. [State the effect and interval.] The data therefore did not provide sufficient evidence for the predicted relationship in this sample.”
Discussion, hedging your interpretation. “This result should be interpreted with caution for three reasons. First, [power / sample / design limitation]. Second, [measurement or confound]. Third, the confidence interval [includes values consistent with a small effect / spans zero], so the absence of statistical significance does not establish the absence of an effect.”
Discussion, literature. “This finding is consistent with [author, year], who also found no significant association between [variables], but contrasts with [author, year], who reported [effect] in a sample of [population]. A plausible explanation is [difference in population, measure or design].”
Conclusion. “The study tested whether [hypothesis]. The hypothesis was not supported: [brief result]. [Optional:] These findings contribute evidence that [broader point] and highlight the need for [specific future work].”
Keep hedging verbs where the evidence is genuinely uncertain: suggests, indicates, may be consistent with, warrants further investigation. A confident sentence about a null result reads as overclaiming, and reviewers notice.
Common Mistakes
These are the errors that follow an unsupported hypothesis most often. Each one is recoverable; what makes them costly is repeating them in the final draft.
| Do not | Do instead |
|---|---|
| Conclude from the p-value alone | Report the effect size and confidence interval alongside it |
| Rewrite the hypothesis after seeing results | Keep the hypothesis as written and report the finding honestly |
| Switch to a one-tailed test to halve the p-value | Use the two-tailed test you planned, or justify a one-tailed design in advance |
| Delete cases until the test turns significant | Apply exclusion rules stated in your methods and report how many were removed |
| Drop the non-significant result from the write-up | Report every planned analysis, significant or not |
| Write that the hypothesis was proven wrong | Write that the hypothesis was not supported by the evidence |
| Claim there is no effect | State that the study found insufficient evidence for an effect |
| Keep testing variations until one is significant | Fix the analysis plan, or preregister a second study with new data |
That last row is the one worth dwelling on. Running test after test until something crosses .05 is fishing for significance, and it inflates the false positive rate far above 5%. If you genuinely suspect an effect is there, the answer is a new preregistered study on new data, not a wider search through the old data.
One more practical note: an A/B test with no measurable lift is a normal outcome too. Pre-registering the metric and sample size before launch keeps that decision honest, and the sunk cost of the build does not count as evidence.
Frequently Asked Questions
Does an unsupported hypothesis mean my study failed?
No. A hypothesis that is not supported is still a valid research finding. Your test simply did not produce strong enough evidence to rule out the no-effect explanation. Committees judge the quality of your design, analysis and reporting, not whether the numbers came out the way you hoped. Studies that contradict prior work are often the most publishable ones in the literature.
Should I change my hypothesis after seeing the results?
No. Your hypothesis describes what you predicted before the data arrived, and changing it afterwards removes the only thing that makes the test meaningful. If you want to explore a different prediction, treat it as a new question: analyse it as exploratory, label it as such, and preregister the next confirmatory study. Report both the original prediction and whatever the data actually showed.
What do I write in the conclusion when the hypothesis is not supported?
State the hypothesis, restate the result plainly, and explain what the evidence does and does not establish. Say that the hypothesis was not supported rather than wrong or disproved, then name the main limitation that shaped the result, such as low power or a narrow sample. Close with a specific direction for future research, not a general call for more studies.
How do I report a non-significant result?
Report it the same way you would report a significant one: name the test, report the statistic, degrees of freedom, p-value, effect size and confidence interval. Then state the decision explicitly, that you failed to reject the null hypothesis. Add one sentence on practical significance if the effect, though not statistically significant, might still matter in practice. Never omit a planned analysis because it came out flat.
When should I ask my supervisor or a statistician for help?
Ask early rather than late, ideally before you rewrite anything. Go to your supervisor if the result contradicts a prior study you are building on, if your study was preregistered, or if a committee deadline is close. A methods tutor or statistician is worth booking when the test assumptions look violated, when you suspect a coding or data entry error, or when you are tempted to try a different analysis to chase significance.
Conclusion
Start by verifying the analysis: compare the hypothesis you wrote against what the test actually examined, then check the assumptions, the effect size and the power behind it. Classify the result honestly as a credible contradiction, an underpowered test, a flawed design or an inconclusive outcome, and report it with the effect size and confidence interval attached.
Only after that does replication or a new study come into the picture. Write what the evidence supports, name what it cannot settle, and the rest of your project gets easier rather than harder.