To describe descriptive statistics in a results section, state each variable’s centre and its spread in the same sentence, usually the mean (M) or median paired with the standard deviation (SD and n), using words in the sentence and italic symbols in parentheses. You report what the numbers are and leave what they mean for the discussion section. It takes about an hour for a typical thesis results chapter once you have the output in front of you.
The hard part is rarely the analysis. It is the translation. Most students open SPSS or Stata, stare at a row labelled Std. Deviation, and have no idea which of those twelve columns belongs in a sentence and which belongs in a table. This guide walks the whole route: from what to gather before you write, through the order of the results section, to the sentences themselves.
One rule shapes everything that follows. The results section reports; the discussion section interprets. A descriptive statistic is a measurement of your data. The moment you write “participants found the task easy,” you have left reporting and started arguing.
Table of Contents
- 1What You Need
- 2Step-by-Step
- 3Start With the Sample and Variable
- 4Report the Distribution of a Categorical Variable
- 5Report the Distribution of a Continuous Variable
- 6Describe Relevant Group Differences
- 7Connect the Prose to Tables and Figures
- 8Use Careful Interpretation
- 9Common Mistakes
- 10Frequently Asked Questions
- 11How do you describe descriptive statistics?
- 12How do I report descriptive statistics in APA style?
- 13How can the findings of descriptive statistics be displayed?
- 14How many descriptive statistics should I report?
- 15Should I report the mean and standard deviation, or the median?
- 16Can I put all my descriptive statistics in a table and skip the text?
- 17Conclusion
What You Need
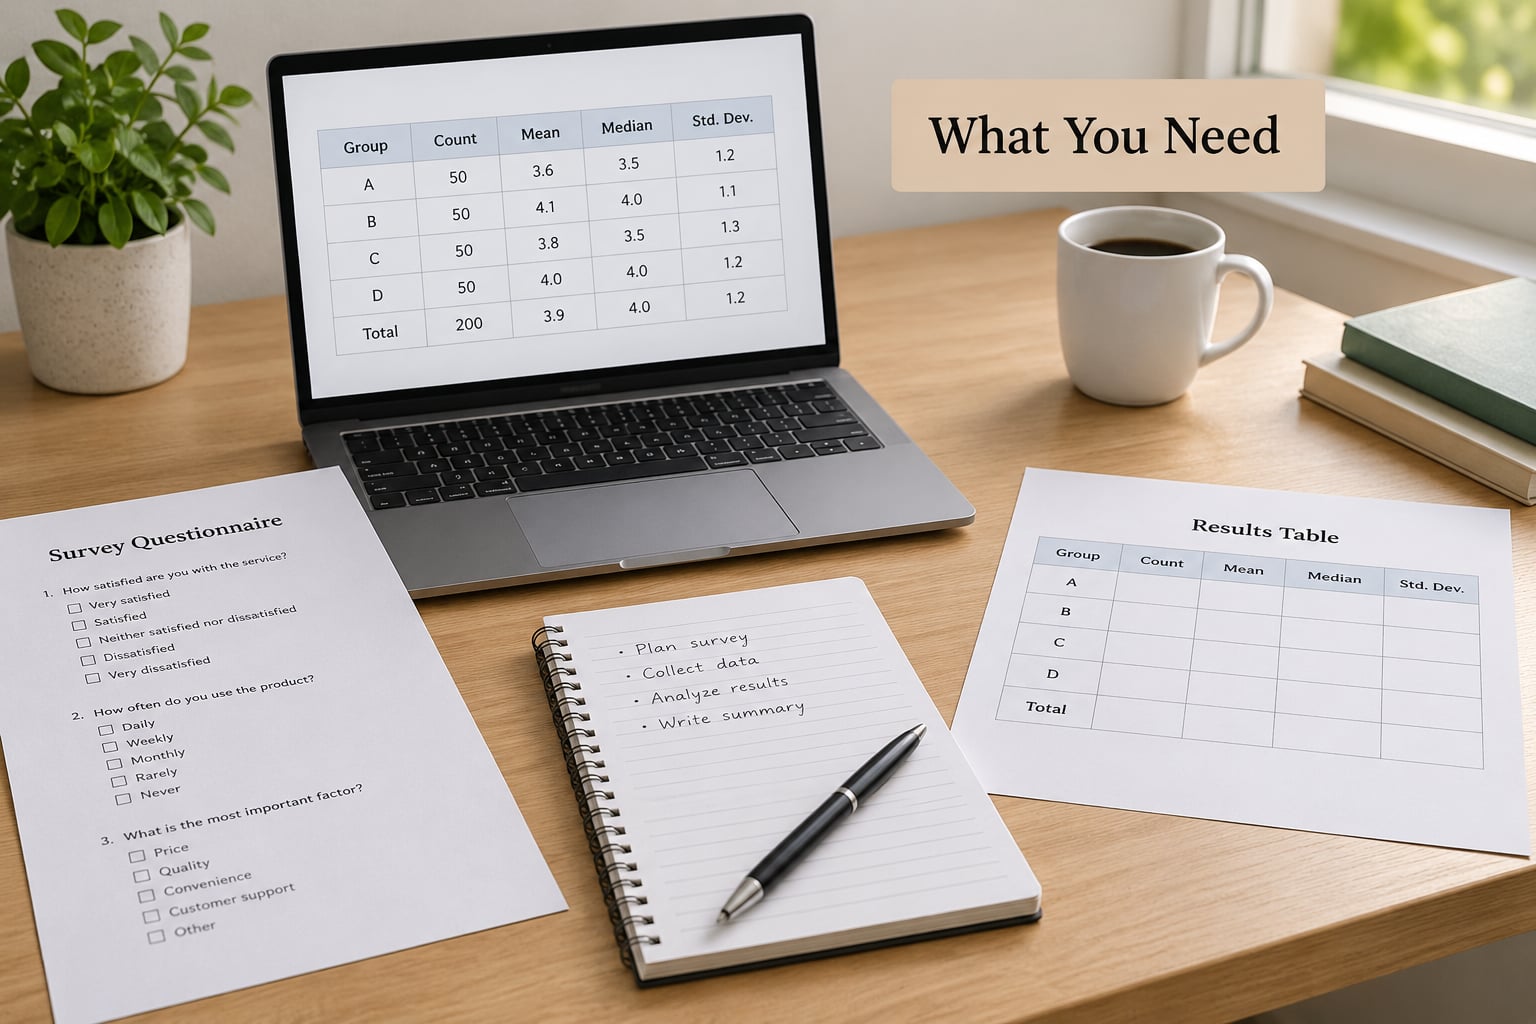
Gather five things before you type a sentence. The first is your variable list: every variable you plan to describe, with the label you will actually use in the text. The second is the descriptive-statistics output itself, not a screenshot of it. The third is any table or figure you have built. The fourth is your research question, which decides what counts as relevant. The fifth is your style guide, usually APA unless your department says otherwise.
Which measures you need follows from how each variable was measured. Getting this wrong is the most common reason a supervisor sends a paragraph back.
- Nominal or categorical variables (gender, programme, response category) need frequencies and percentages. A mean is meaningless for them.
- Ordinal variables (a 1-to-5 satisfaction scale, a ranked list) need the median and, usually, the interquartile range.
- Continuous variables (age, reaction time, a composite score) that are roughly symmetric need the mean and standard deviation.
- Grouped or banded variables (income brackets, age bands) need frequencies and percentages, or a median if the bands are ordered.
Use the actual output your software produced rather than numbers you remember from an earlier run. If your study used survey weights, run the weighted descriptives and say so, because weighted and unweighted percentages for the same question can differ by several points and reviewers do check.
Step-by-Step
Start With the Sample and Variable
Open the results section by telling the reader who the data came from. Give the analysed sample size, note any subgroup sizes, and name the variables in the order you will report them. Keep valid responses distinct from the total sample whenever they differ, because that difference is where markers look first.
A workable model sentence: “Of the 260 questionnaires distributed, 214 returned complete responses and were analysed. The final sample (n = 214) included 131 women (61.2%) and 83 men (38.8%), with ages ranging from 18 to 34 years (M = 21.4, SD = 2.9). Four participants had left the demographic items blank, so those percentages are based on n = 210 rather than the full sample.”
That last clause is the whole trick. When a denominator changes, say which one you used, in the same sentence, and move on.
Report the Distribution of a Categorical Variable
For categorical variables, report the frequency and percentage for each category, then name the largest group. Do not call the difference between categories meaningful or significant; a descriptive gap is just a gap until a test backs it up.
Example: “Of the 214 participants, 132 (61.7%) used the service monthly, 71 (33.2%) used it occasionally, and 11 (5.1%) had never used it. Monthly use was therefore the most common response.”
Keep the categories mutually exclusive and let the percentages total 100. If rounding leaves you at 99.8, leave it; nobody marks you down for arithmetic that rounding caused.
Report the Distribution of a Continuous Variable
Use the mean and standard deviation when the distribution is roughly symmetric and the scale is genuinely continuous. Use the median and interquartile range when it is skewed, when there are outliers, or when the items are ordinal.
Example: “Sleep duration before the exam averaged 6.4 hours (M = 6.42, SD = 1.18), with values ranging from 3 to 9 hours.” Adding the range costs four words and tells the reader the spread was real rather than a single outlier dragging the mean.
Neutral reporting is the goal. “Most participants slept between five and seven hours” describes the shape without arguing about it. “Participants slept too little” is a discussion sentence wearing a results-section costume.
One distinction worth learning early: report the standard deviation, not the standard error, in a descriptive paragraph. The standard deviation describes how spread out your observed scores are. The standard error estimates how precise the mean is, so it belongs beside the inferential test, not beside the data.
Describe Relevant Group Differences
When you compare groups descriptively, give each group’s statistics and let the reader see the gap rather than announcing it. Use parallel construction, which means describing every group the same way, in the same order, with the same words.
Example: “Participants in the seminar condition (M = 23.40, SD = 9.33) scored higher than those in the control condition (M = 20.87, SD = 8.45).” The non-parallel version, “the seminar group scored 23.40 while the mean for controls was 20.87,” forces the reader to track which set of numbers goes with which group.
Call the comparison descriptive until a test exists. “A two-sample t-test was then conducted on these scores” is the bridge; without it, a two-point difference sits in the paragraph as a fact with no test attached, and a reviewer will ask what it means.
Connect the Prose to Tables and Figures
Reference the table or figure by number, summarise the pattern it shows, and stop. Repeating every cell in the prose is the most common way a results section bloats to twice its necessary length.
“As shown in Table 1, anxiety scores were highest among first-year students and lowest among postgraduates across all three conditions.” Then move to the test. The reader now knows where to look.
A short checklist before you finalise the table: number and title above it, units in the column headings, decimal places consistent across every cell, percentages labelled as percentages, and a note beneath defining M, SD and n. Never paste an SPSS or Stata output table straight into a manuscript; rebuild it with only the columns your argument needs.
Use Careful Interpretation
Reporting is factual description. Interpretation asks what the pattern means, whether it matters in practice, and what it might mean beyond this sample. That belongs in the discussion section, and it is where your argument should live.
In the results section you may note a notable pattern without interpreting it: “Completion rates were lowest for the longest survey version (42%), which contained 61 items.” In the discussion you explain it: a long instrument plausibly increased dropout, and the drop is worth weighing against the added measurement value.
Watch three specific traps. Causal verbs belong elsewhere, because a descriptive comparison cannot establish cause. Statistical significance does not belong here either, because you have not run a test yet. And “significant” is not a synonym for “large”; a substantial descriptive difference can be entirely unremarkable statistically, and writing “significantly higher” before reporting the test is a small lie that reviewers catch.
If you want a set of fill-in-the-blank sentences rather than examples, these are the ones most students need.
- Single continuous variable: “Scores on the [variable] were [level] (M = [value], SD = [value]), ranging from [min] to [max] (n = [n]).”
- Two independent groups: “Participants in the [group A] condition (M = [value], SD = [value]) scored [higher or lower] than those in the [group B] condition (M = [value], SD = [value]).”
- Pre and post: “Mean scores increased from [value] (SD = [value]) at pre-test to [value] (SD = [value]) at post-test.”
- Three or more groups: “Mean scores were [value] for [group 1], [value] for [group 2] and [value] for [group 3]. Full statistics are reported in Table [n].”
- Correlation: “The two measures were positively correlated, r = [value], n = [n].”
- Frequencies: “Of the [n] respondents, [count] ([percentage]%) selected [category], [count] ([percentage]%) selected [category], and [count] ([percentage]%) selected [category].”
- Ordinal or skewed: “The median rating was [value] (IQR = [lower] to [upper]), n = [n].”
- Demographics: “The sample of [n] participants included [count] ([percentage]%) [category] and [count] ([percentage]%) [category], with a mean age of [value] years (SD = [value]).”
- Table reference: “Descriptive statistics for all conditions are presented in Table [n].”
Common Mistakes

Most marks lost on descriptive sections come from a short list of repeat offences. Each of these has a quick fix.
- Reporting without interpreting, in the wrong section. “These results show the intervention worked” is a discussion claim. Report the means and SDs, and let the reader meet the numbers first.
- Reading every cell aloud. When the values sit in a table, describe the pattern. Naming each figure in the prose is how a two-page section becomes a six-page one.
- Reporting means for skewed or ordinal data. A handful of extreme scores will drag a mean away from anything most participants experienced. Use the median and the interquartile range, and say why.
- Percentages that do not add to 100. Usually rounding. Either adjust to one decimal place or leave it; do not silently alter a count.
- Conflating the valid N with the total N. If 12 cases are missing on one item, state which denominator the percentage uses.
- Inconsistent decimals. Two places for every descriptive statistic in the same report, or three places throughout if you prefer. Never mix, and never report a mean of 23.4 next to an SD of 9.33.
- Causal language in the results. “Improved because of the training” claims a mechanism the descriptive data cannot show.
- Reporting the standard error as spread. SE is precision, not variability, and quoting it alone understates how much your scores actually varied.
- Describing methods instead of results. The software name and the alpha level belong in the methods section, or in a single opening note if your guide asks for it.
On formatting, the APA Publication Manual (7th edition, 2020) is explicit in sections 4.31 to 4.34. Present statistics as numerals, not words. Use two decimal places consistently. Use a point as the decimal separator. Italicise the statistical symbols: M, SD, Mdn, n, p, r, F, t. Drop the leading zero for values between 0 and 1 (p = .032) but keep it above 1 (t(58) = 2.41). Report the exact p value rather than a threshold, and round it up at the second decimal rather than down, so a computed .051 is written .06. Write out measurement units and non-statistical abbreviations in the sentence. These same rules cover tables and figures in sections 5.20 to 5.30.
If you would rather find the numbers in the software than in a screenshot, four commands cover most work. In SPSS, use Analyze > Descriptive Statistics > Frequencies and tick Mean, Median, Mode, Std. Deviation, Minimum and Maximum in the Statistics box. In Stata, summarize varlist gives mean, SD, min and max in one row per variable, and tabstat varlist, statistics(mean sd min max) gives the same for groups created with by(). In R, summary() prints minimum, first quartile, median, mean, third quartile and maximum, while psych::describe() adds skewness, kurtosis and missing counts in one tidy frame. In Excel, Data > Data Analysis > Descriptive Statistics with Summary Statistics ticked returns the same set of columns, and its “Standard Error” column is not the SD.
Frequently Asked Questions
How do you describe descriptive statistics?
Name the variable, then give its centre and its spread in one sentence, plus the sample size. For continuous, roughly symmetric data that means the mean, standard deviation and n; for skewed or ordinal data, the median and interquartile range; for categorical data, frequencies and percentages. Keep the description factual and leave meaning and causation to the discussion section.
How do I report descriptive statistics in APA style?
In APA style, statistical results appear as numerals rounded to two decimal places, with a point as the decimal separator. Italicise symbols such as M, SD, n and p, omit the leading zero for values between 0 and 1, keep it for values above 1, and report the exact p-value instead of a threshold. Write the word in the sentence and the symbol in parentheses.
How can the findings of descriptive statistics be displayed?
Four ways work. In narrative text, when you have one or two statistics. Parenthetically, for compact comparisons such as M = 23.40, SD = 9.33. In an APA-style table, once you have three or more variables or groups. Or in a figure, such as a bar graph with error bars, a line graph showing change over time, or a scatterplot with a fitted line.
How many descriptive statistics should I report?
At minimum, report n, the mean and the standard deviation for each variable your argument depends on. Add the median for skewed or ordinal data, the mode for categorical variables, and the range or minimum and maximum when the extremes matter. Anything that does not support your argument does not belong in the results section, however easy it was to compute.
Should I report the mean and standard deviation, or the median?
Report the mean and standard deviation when the distribution is roughly symmetric and the scale is meaningfully continuous. Report the median and interquartile range when the data are skewed, when outliers are present, or when the scale is ordinal. If you report both, say why, so the reader knows the choice was deliberate rather than accidental.
Can I put all my descriptive statistics in a table and skip the text?
You can, but not without any prose. Build the table in APA format, then write a short paragraph that names the key statistics and describes the main trends, referencing the table by number. Do not repeat every value from the table in the text, and never paste a software output table straight into your manuscript.
Conclusion
Start with the variable you most need to describe. Decide whether it is categorical, ordinal or continuous, choose the matching summary measures, write one sentence that gives the centre, the spread and the sample size, and point the reader at the table or figure holding the full set. Then stop. Accurate descriptive reporting is what makes the inferential statistics that follow readable, and a marker can tell within one paragraph whether you understood your own data.