If you are weighing SPSS, Stata and R for dissertation analysis, the short answer is that SPSS suits menu-driven beginners doing standard survey work, Stata suits economics and panel-data projects, and R suits anyone who wants full control and a fully reproducible workflow. There is no single best package; the deciding factors are your discipline, your supervisor’s habits, your deadline, and how your university licenses software.
All three run the same core tests you were taught at undergraduate level. The difference is how you ask for them: SPSS through menu dialogs, Stata through menus or typed commands, and R entirely through typed code. That single difference shapes your learning time, the cost of your licence, the way your tables arrive formatted, and how easily an examiner can follow your work six months later when you are asked to explain a result.
The versions this comparison refers to are IBM SPSS Statistics v30 and later, Stata 18 or 19, and R 4.x with a current RStudio release. Pricing changes several times a year, so check the vendor pages rather than trusting a number written down months ago.
Table of Contents
- 1SPSS vs Stata vs R for Dissertation Analysis at a Glance
- 2Which Software Has the Easiest Learning Curve?
- 3Which Is Better for Statistical Tests and Research Methods?
- 4Where SPSS is strongest
- 5Where Stata is strongest
- 6Where R is strongest
- 7SPSS vs Stata vs R for Data Cleaning and Data Management
- 8Which Software Is Best for Reproducible Dissertation Analysis?
- 9SPSS, Stata, or R: Cost, Access, and Student Support
- 10Which Software Produces the Best Dissertation Outputs?
- 11Which Should You Choose?
- 12Your supervisor’s preference outranks every technical advantage
- 13What to do with a syntax file or do-file your supervisor sent you
- 14What to do if you started in the wrong package
- 15What to write in your methodology chapter
- 16Frequently Asked Questions
- 17Which is better for data analysis, SPSS or Stata?
- 18Is R still used for dissertations?
- 19How long does it take to learn R for a dissertation?
- 20Do universities accept R for a dissertation?
- 21What are the free alternatives to SPSS for dissertation analysis?
- 22My supervisor sent me a syntax or do-file. What should I do with it?
- 23Conclusion
SPSS vs Stata vs R for Dissertation Analysis at a Glance
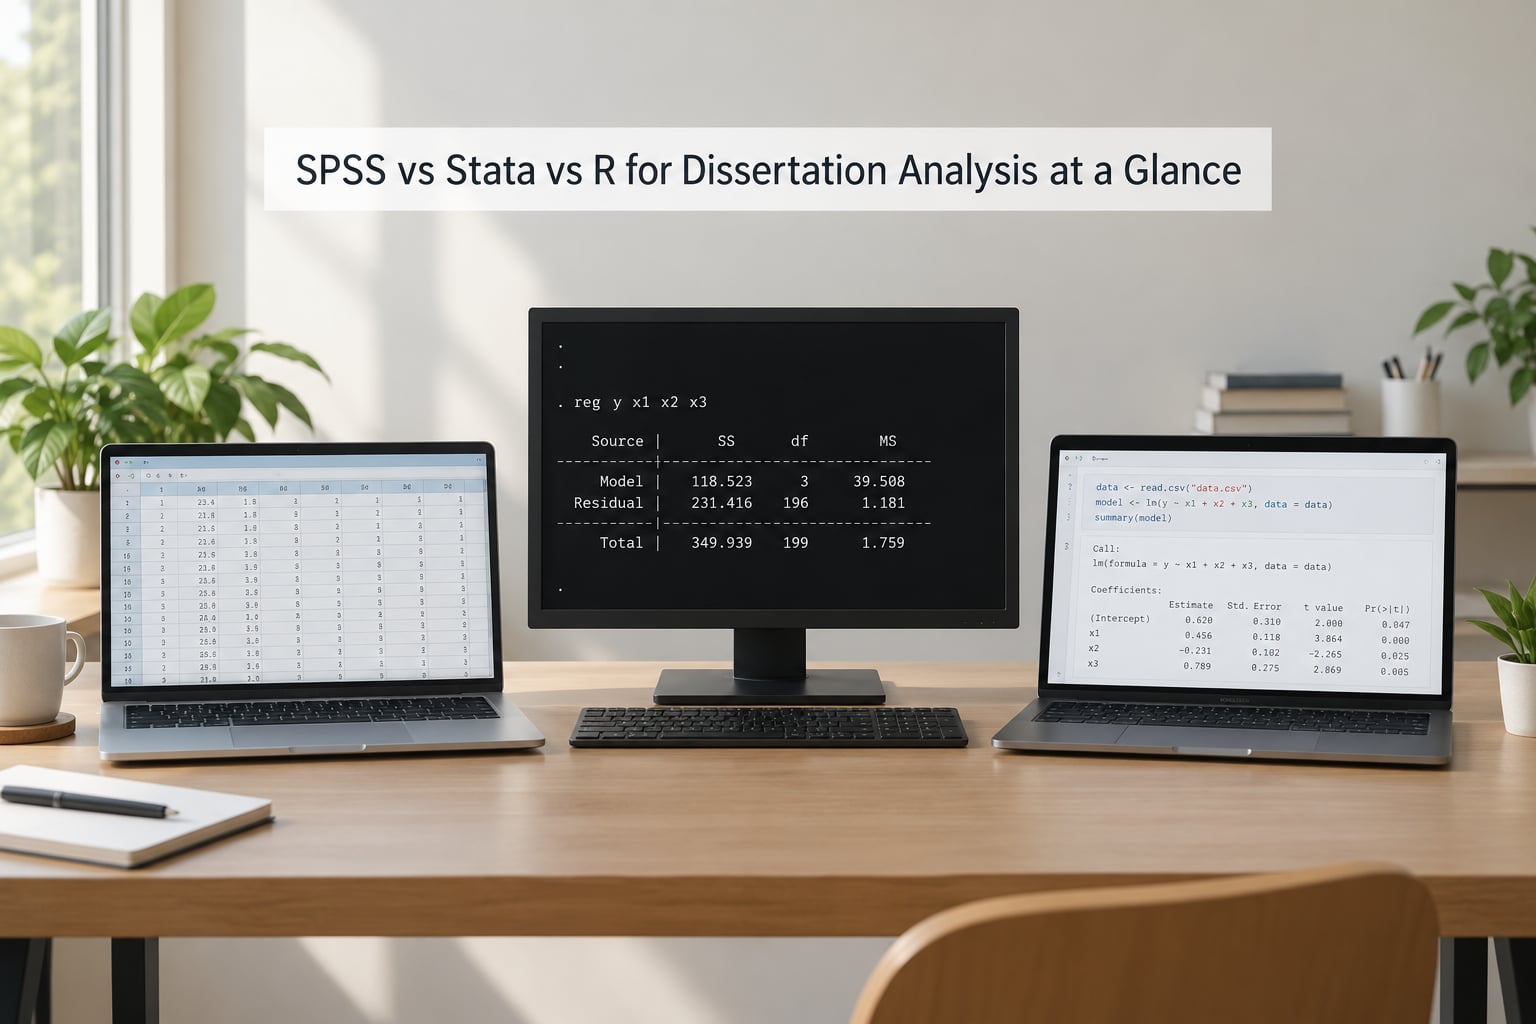
The table below is the fastest way to see where the three packages diverge. Read the row that matches your weakest requirement, because that row usually decides the choice faster than any general ranking.
| Criterion | SPSS | Stata | R |
|---|---|---|---|
| Licence model | Commercial, paid subscription or university site licence | Commercial, annual subscription with student rates | Free and open source |
| How you invoke an analysis | Menu dialogs, with optional syntax | Menu dialogs or typed commands | Typed code only |
| Time to run your first correct analysis | An afternoon | A weekend | One to two weeks |
| Time to run a polished dissertation chapter | A week or two | A week or two | Several weeks |
| Data editor | Spreadsheet-style grid | Grid and list editors | Scripted; editing done in code or a viewer |
| t-test, ANOVA, chi-square, regression | Built in, menu-ready | Built in | Built in through packages |
| Survey weighting and complex samples | Strong, mature dialogs | Strong through the svy prefix | Capable, more setup required |
| Mediation and moderation | PROCESS macro, plus Amos for SEM | User-written commands and packages | mediation, lavaan and related packages |
| Structural equation modelling | Separate Amos licence needed | Community-written commands | lavaan is the reference implementation |
| Multilevel and mixed-effects models | MixedModels add-on | Built-in mixed and multilevel commands | lme4 and nlme |
| Panel and longitudinal data | Possible but manual | Core strength, xtset drives it | plenty of packages, more assembly work |
| Survival analysis | Basic coverage | Comprehensive commands | survival package is mature |
| Machine learning and custom methods | Limited, needs Python or extensions | Limited, needs user-written commands | Vast ecosystem, tidymodels included |
| Charts and publication graphics | Usable, rarely impressive | Clean, with a strong graph combine command | ggplot2 produces journal-grade figures |
| Reproducibility | Only if you save syntax | Strong, do-files are the normal habit | Strongest, scripts rerun end to end |
| Export to Word or LaTeX | Manual copy and paste, clunky | esttab and stargazer handle it | gt, stargazer, knitr and RMarkdown handle it |
| Best fit | Taught master’s, nursing, education, psychology | Economics, finance, public health, policy | Any quantitative PhD, data science, mixed methods |
Two rows carry more weight than the rest. Reproducibility is the one examiners have started asking about, and best fit is the one that decides how much help you get when something breaks at two in the morning six weeks before submission.
Which Software Has the Easiest Learning Curve?
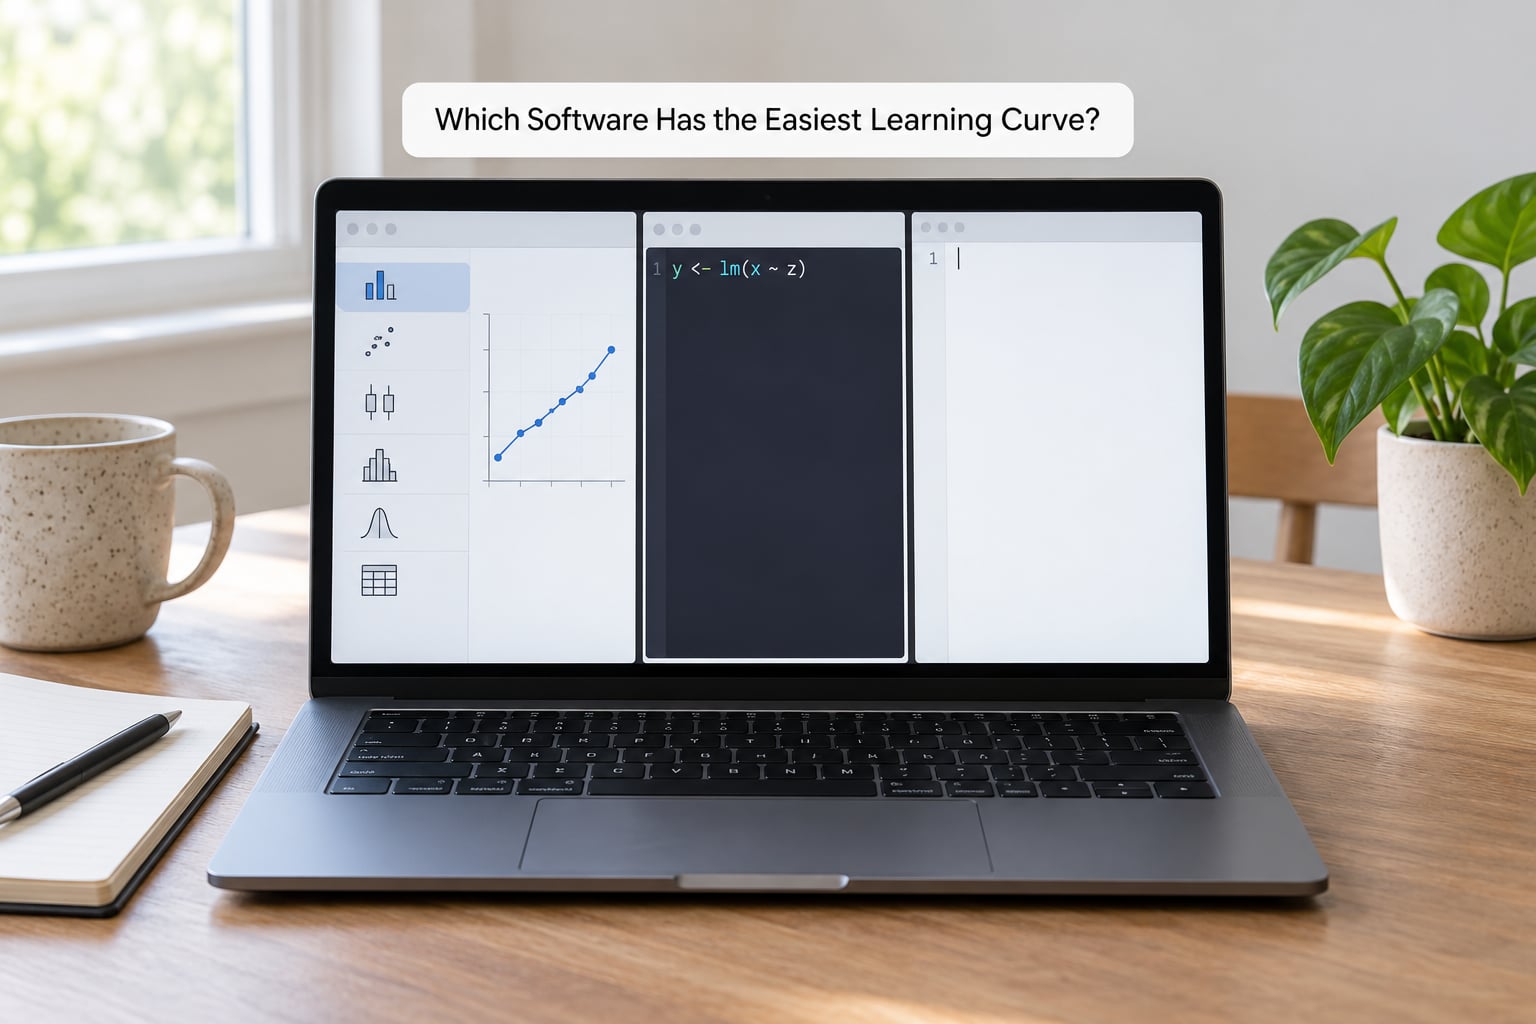
SPSS has the easiest learning curve, because every analysis is a dialog box with plain-language options and a live preview of the output. You can complete a t-test, a one-way ANOVA and a multiple regression without writing a line of code, which is why it dominates taught master’s programmes in psychology, nursing, education and social work.
Stata sits in the middle. The GUI does most of the work early on, but the moment you need a survey design, a fixed-effects panel model or a custom estimator, you are typing commands into the Results window. Those commands are short and readable, and the manual is genuinely excellent, so many students find Stata easier than expected after the first week.
R has the steepest curve, and calling it anything else would be dishonest. You are not learning a program, you are learning a programming language, and the first fortnight is spent on vectors, data frames and the pipe operator rather than on statistics. In a r/PhD thread on the topic, the recurring worry was not whether R is more powerful but whether there is enough runway before the analysis deadline to learn it.
A more useful way to think about the learning curve is as a timeline budget rather than a difficulty rating.
- SPSS: one afternoon to your first analysis, two to three weeks to your first clean chapter.
- Stata: a weekend to your first analysis, two to four weeks to a polished results chapter including do-files and marginal effects.
- R: one to two weeks to your first analysis, six to eight weeks to produce publication-quality output with tidyverse habits in place.
Those figures are planning estimates, not guarantees. They assume roughly five hours of focused work a week, and they assume you are copying working syntax rather than typing it from memory. Anyone who has written out a lm() call by hand will tell you the first week is slower and the sixth week is much faster.
One detail matters more than the curve itself: whether you can save what you did. In SPSS, the analysis lives in a dialog unless you deliberately open the Syntax window and paste the commands. Students routinely lose a week re-running analyses they cannot reproduce because they never switched that window on.
Which Is Better for Statistical Tests and Research Methods?
For the classical tests taught in research methods modules, the three packages are interchangeable, and any examiner who rejects a valid t-test because it came from a different program is being unreasonable. The divergence starts with survey designs and complex models, where each package has a clear home ground.
Where SPSS is strongest
SPSS handles questionnaire data exceptionally well. Complex sample designs with strata, clusters and weights are a few dialog clicks, and the subpopulation analysis for comparing subgroups is built in. Factor analysis, reliability analysis and Cronbach’s alpha are all in the Analyze menu with sensible defaults, and the PROCESS macro handles Hayes’s mediation and moderation templates without leaving the package.
Where Stata is strongest
Stata was built for econometrics. Once you run xtset on panel data, fixed effects, random effects, dynamic panel estimators, instrumental variables and clustered standard errors are a few characters of typing, and the svy prefix makes complex survey estimation consistent across every command. It is also the tool most supervisors in economics and public health already read fluently.
Where R is strongest
R wins on method availability and custom work. Anything with an active research community has an R package, usually within months of a method appearing in a journal, and structural equation modelling through lavaan is the reference implementation many other tools are validated against. Machine learning, text analysis, Bayesian models and bespoke resampling schemes are all reachable with a few lines.
A practical note on small samples. R’s breadth is a liability when you have 40 participants and a supervisor who cannot debug your code. The method exists, but the diagnostics take longer to interpret than the analysis itself, and SPSS’s simpler assumptions checking is a genuine help in that situation.
SPSS vs Stata vs R for Data Cleaning and Data Management
Cleaning the data takes longer than running the analysis, and this is where package differences bite hardest in the final three weeks of a dissertation.
SPSS gives you a grid that behaves like a spreadsheet, which is intuitive if your data came from a questionnaire tool. Recoding ranges, computing new variables and handling reverse-scored items are all visual, and missing values can be declared per variable. Filtering works by case selection, and merging files is straightforward but click-heavy once you have more than a handful of sources.
Stata’s data editor is tighter than SPSS’s and its missing-value handling is more precise, including separate codes for missing, inapplicable and not asked. The append, merge and reshape commands are scriptable, so cleaning a monthly survey that arrives as twelve separate files is one loop rather than twelve manual merges.
R is the most awkward for exploration and the strongest once the cleaning is written down. Reading a CSV is one line, but every recode is code, and you will spend real time debugging a factor level that turned into a character because one row had a stray space. Once the script works, though, re-running it on next wave’s data is a single command, and that is exactly what a longitudinal project needs.
On very large files, Stata and SPSS hold more rows comfortably out of the box, while R holds everything in memory and benefits from columnar formats. For most dissertations with a few thousand rows, this is not a deciding factor.
Which Software Is Best for Reproducible Dissertation Analysis?
R is the most reproducible of the three, Stata is a close second by default, and SPSS is the weakest unless you change how you work in the first week.
Reproducibility in a dissertation means that anyone, including you in a panic eight months before submission, can start from the raw data file and produce the exact tables in Chapter 4. That requires your analysis to exist as text rather than as clicks.
In Stata, that text is the do-file, and using one is standard practice rather than a virtue signal. In R, it is the script, and RStudio projects make it natural to keep code, data and output together. In SPSS, you paste the generated syntax from each dialog into the Syntax Editor and save it as a .sps file, which almost nobody does until something goes wrong.
Version control is where R separates itself. A Git repository attached to an RStudio project gives you a dated history of every analysis, so you can prove that the change from Model 2 to Model 3 happened in week 14 and see exactly what altered. Stata do-files can live in a repository too, but the tooling is less automatic. SPSS syntax files can be versioned, but the data handling steps that live only in dialog settings still will not be captured.
Reproduce your own results before submission. Run every script from scratch on a clean copy of the data and check that the numbers match your chapter. If they do not, you have found a real problem while there is still time to fix it.
SPSS, Stata, or R: Cost, Access, and Student Support
R is free. SPSS and Stata are commercial products with licensed pricing that changes frequently, so treat any figure you find in an older guide as unreliable and check the vendor page directly.
Before you consider buying anything, check what your university already provides. Many institutions hold site licences for SPSS and Stata that cover enrolled students through the library or IT service desk, and postgraduate researchers frequently have access that undergraduates do not. A single afternoon emailing your library can remove the cost question from your decision entirely.
| Access route | What it gives you | Best for |
|---|---|---|
| University site licence | Full SPSS or Stata on university machines | Any student, always check this first |
| Student or personal licence | Discounted commercial terms from the vendor | Students whose department has no seat |
| R and RStudio | The complete language and a free desktop editor | Anyone, on any machine, no conditions |
| PSPP | Free clone of SPSS with a similar menu | Students who want SPSS workflows at no cost |
| JASP and jamovi | Free packages with SPSS-style menus and Bayesian options | Students starting from a menu-driven background |
| Posit Cloud | Hosted R environment that runs in a browser | Students with an old or locked-down laptop |
Student support beyond documentation varies. SPSS ships with a detailed built-in help system and IBM runs a user community. StataCorp publishes full online manuals for every command, which many students regard as the clearest statistical documentation in existence. R documentation is the most scattered, with excellent package vignettes sitting next to a famously unhelpful error-message tradition, but the RStudio support pages and community forums fill most of the gaps.
If your university does not license either commercial package and your supervisor insists on one, ask whether the department’s research software budget can cover a student licence. That request is routine and far more likely to succeed than students expect.
Which Software Produces the Best Dissertation Outputs?
R produces the best output by a wide margin, Stata produces the most efficient output, and SPSS produces the fastest acceptable output for a simple descriptive chapter.
SPSS output is genuinely useful when you want tables in APA format without trying. Tick the APA output option and it supplies confidence intervals, effect sizes, degrees of freedom and the right italic formatting. The problem appears when you need something unusual, such as a marginal effects table or a custom model summary, because you end up editing the output by hand before it goes into Word.
Stata is comfortable with formatted output through esttab and stargazer, and the graph combine command makes multi-panel figures quick to assemble. Results paste into Word in a way that survives editing, and LaTeX export is routine. Most economics dissertations end up with tables that look like the published literature, largely because of that tooling.
R with ggplot2 is what most journals now expect for figures, because the grammar system makes consistent, publication-quality graphics achievable without a designer’s eye. For tables, gt and stargazer produce clean output, and RMarkdown or Quarto goes further by generating tables, figures and the surrounding text from one script, which removes a whole class of copy-and-paste errors.
On diagnostics, all three handle residual plots, normality checks and heteroskedasticity tests. R and Stata make it easier to build custom diagnostic panels; SPSS provides the standard set and leaves the rest to add-ons.
Do not underestimate the final formatting hour. Whichever package you pick, build your tables in the target format and check your thesis template before generating outputs, not after.
Which Should You Choose?
Choose SPSS if you are a taught master’s student with no programming background, a standard questionnaire design and a supervisor who uses SPSS. Choose Stata if you are in economics, finance, public health or policy, or if your data is panel or survey data with a complex design. Choose R if you want complete control, plan to publish, need custom methods, or expect your supervisor to value a reproducible script.
| Discipline | Most common choice | Why |
|---|---|---|
| Psychology | SPSS, moving to R | PROCESS macro and Amos for SEM; R for psychometrics packages |
| Nursing and education | SPSS | Standard taught methods modules and supervisor familiarity |
| Economics | Stata | Panel and econometric estimators plus LaTeX output |
| Business and marketing | SPSS | Survey-heavy designs and coursework familiarity |
| Public health and epidemiology | Stata or R | Survey weights, survival analysis and epidemiology packages |
| Sociology and political science | R | Weighting, text analysis and publication-grade graphics |
| Computer science and data science | R | Shared tooling with the field and a large package ecosystem |
| Quantitative social science PhD | R | Reproducibility expectations and custom estimators |
Your supervisor’s preference outranks every technical advantage
This is the point that most comparison articles bury, and it is the one that decides real dissertations. On Reddit threads comparing these packages for doctoral work, supervisor preference comes up again and again as the factor students say actually settled their choice. If your supervisor will review your do-file, your syntax, or your results tables on a given evening, use the software they can read.
Ask them directly and early. A one-line email asking which package the department expects for this type of analysis saves weeks. If your supervisor has no preference, take the package used most often in your department, because that is also the package your second marker is most likely to read.
What to do with a syntax file or do-file your supervisor sent you
This comes up constantly and nobody explains it. Do not rewrite it. Open it, run it line by line, and change one thing at a time until you understand each command. Start with the header comments, which usually name the data file and the variables involved. Change your data path, run the whole file from top to bottom without errors, and only then start editing. You are not analysing the data yet, you are learning their pipeline, which will save you a week later.
What to do if you started in the wrong package
Switching costs far less than students fear, as long as you switch early. You rarely need to redo the analysis, only the tool. Export your cleaned dataset as CSV from whichever package you used, read that file into the new one, and rerun the models; the arithmetic does not change. Keep the original output as a cross-check so you can confirm the new package reproduces your old numbers.
The one case where switching is expensive is when your supervisor or examiner expects a specific format or a specific package name in the methodology chapter. In practice, a switch in the first two months is invisible, and a switch in the final fortnight creates avoidable work.
Two situations do not justify switching. The first is when you are making progress and only feel tempted because someone else’s project looks slicker. The second is when your supervisor asked for a specific package and you are choosing to disagree on preference grounds rather than on technical grounds.
What to write in your methodology chapter
State the package and its version, the name of any add-ons or community packages, and the fact that analysis was scripted. In APA 7 style you reference the software itself: IBM Corporation for SPSS, StataCorp for Stata, and R Core Team for R, together with any packages used. Include the version number, because that is what makes the analysis reproducible in five years.
A typical methods paragraph reads like this: “Analyses were conducted in Stata 18, with standard errors clustered at the district level. All models were estimated from a single do-file retained with the submitted materials.” That sentence covers the version, the estimator and the reproducibility claim in about thirty words.
Frequently Asked Questions
Which is better for data analysis, SPSS or Stata?
SPSS is better for standard questionnaire and survey analysis, menu-driven exploration and taught master’s projects. Stata is better for econometrics, panel and longitudinal data, complex survey designs and any project where your supervisor already reads Stata syntax. Neither is better in general. The deciding factor is usually the discipline convention and what your supervisor will be able to review, not a technical advantage.
Is R still used for dissertations?
Yes, and its use is growing rather than shrinking. R 4.x is the current release line, with new versions every few months and thousands of community packages covering everything from mixed-effects models to text analysis. Journals increasingly ask for the analysis code behind published results, and R scripts satisfy that request more directly than any other package.
How long does it take to learn R for a dissertation?
Budget one to two weeks to your first correct analysis and six to eight weeks to produce publication-quality output, at roughly five focused hours a week. Copy working code rather than typing it, and learn data frames and the pipe operator before anything statistical. If your deadline is under two months and you have no programming background, SPSS or Stata are the safer choice for this cycle.
Do universities accept R for a dissertation?
Almost always yes, because no credible institution rejects a valid analysis over the tool used. Check your department’s research methods guidance and ask your supervisor directly. The practical protections are simple: keep your scripts, list package versions in the methods chapter, and produce a results chapter with enough surrounding description that a non-R reader can follow your reasoning.
What are the free alternatives to SPSS for dissertation analysis?
PSPP gives you a SPSS-like menu at no cost, and JASP and jamovi are free packages with familiar interfaces and Bayesian options built in. Posit Cloud gives you hosted R and Python in a browser if your laptop is too old to install them. All four handle standard descriptive statistics, t-tests, ANOVA, chi-square and regression well enough for a dissertation chapter.
My supervisor sent me a syntax or do-file. What should I do with it?
Do not rewrite it. Open the file, read the header comments, point it at your own data, and run it from top to bottom until it completes without errors. Then change one line at a time so you understand what each command does. This is how you learn their analysis pipeline, and it usually saves a week of trial and error later.
Conclusion
SPSS, Stata and R all run the tests your dissertation needs, so pick the one your discipline and your supervisor already use. SPSS if you want menus and speed, Stata if your data is panel, survey or economic, R if you want full control, publication-quality graphics and a script that reruns end to end.
Start by doing three things this week: ask your supervisor which package they want reviewed, check whether your university already licenses SPSS or Stata, and write down the exact tests your design requires. Those three answers settle the spss vs stata vs r for dissertation analysis question faster than any feature comparison, and they take an afternoon rather than a fortnight.