Short answer to when to use ANCOVA instead of ANOVA: use it when a continuous covariate, usually a pre-test or baseline score, explains part of the variation in your outcome and you want to compare adjusted rather than raw group means. If your groups started out level and no outside variable muddies the picture, plain ANOVA is the right and simpler answer.
If you have landed here because someone told you not to ask about the difference, take heart: the gap between these two tests is genuinely small. Both are the same general linear model, and a regular on r/AskStatistics put it plainly, ANCOVA has a continuous covariate and ANOVA has only categorical ones, so both are really just linear regression underneath.
What actually matters is whether your design gives you a defensible covariate. That is the whole decision. Below is the rule, the table, the assumptions, the reporting templates, and the cases where ANCOVA is the wrong tool.
Table of Contents
- 1When to Use ANCOVA Instead of ANOVA at a Glance
- 2When to use ANOVA
- 3When to use ANCOVA
- 4ANOVA vs ANCOVA: What Is the Core Difference?
- 5What Research Question Does Each Test Answer?
- 6When a Covariable Is Needed
- 7When to use ANCOVA instead of ANOVA: three exceptions to the rule
- 8ANCOVA vs change scores vs repeated-measures ANOVA
- 9ANCOVA Assumptions and Requirements
- 10Linearity between the covariate and the outcome
- 11Homogeneity of regression slopes
- 12No important post-treatment variables as covariates
- 13Running it in SPSS and R
- 14Choosing Between ANOVA and ANCOVA
- 15How to Report the Results
- 16Which Should You Choose?
- 17Frequently Asked Questions
- 18Can I use ANCOVA instead of ANOVA for pre-test and post-test data?
- 19Is ANCOVA always better than ANOVA because it controls a variable?
- 20What variables can be used as covariates in ANCOVA?
- 21Do I need a significant covariate before using ANCOVA?
- 22How do I report an ANCOVA result in a research paper?
- 23What should I do if ANCOVA assumptions are violated?
When to Use ANCOVA Instead of ANOVA at a Glance
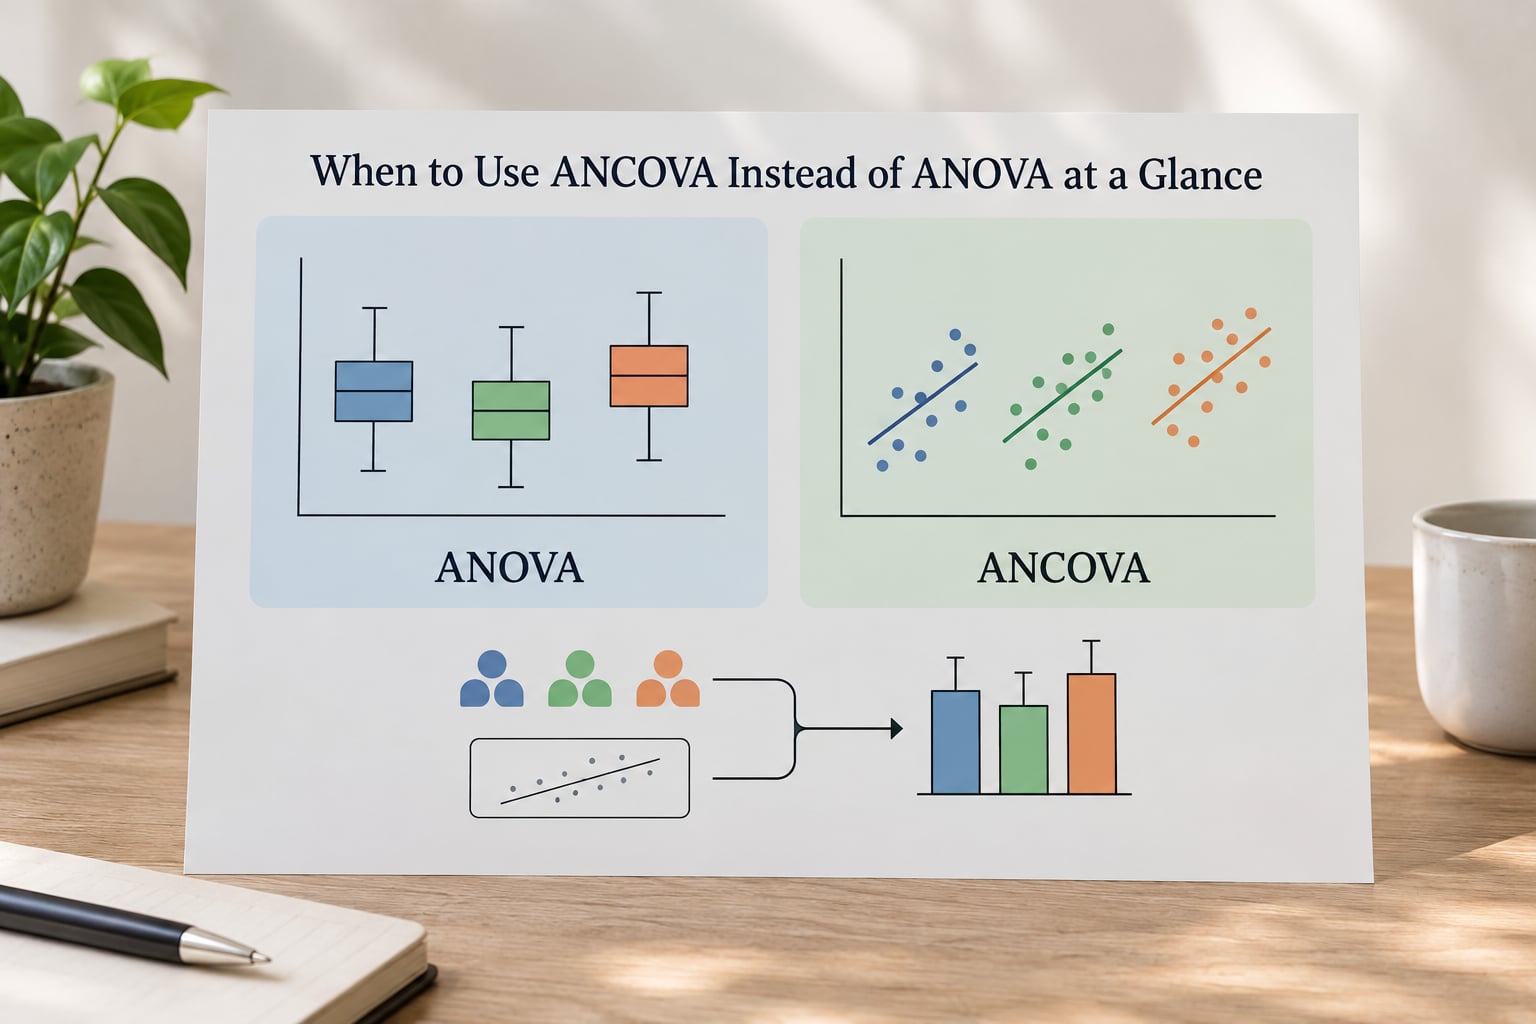
The direct rule: ANCOVA is appropriate when a continuous variable needs to be controlled before you compare group means. Everything else follows from whether that sentence is true of your study.
| Criterion | ANOVA | ANCOVA | Why it matters |
|---|---|---|---|
| Research question | Do the groups differ on the outcome? | Do the groups differ once we hold starting points constant? | The question you write in your methods chapter must match the test you run |
| Covariates | None | One or more continuous variables | Determines whether the extra complexity is justified |
| Statistical control | None beyond randomisation | Covariate effect removed from the error term | Control is the entire reason for choosing ANCOVA |
| Means compared | Raw group means | Adjusted or estimated marginal means | Reporting raw means from an ANCOVA is a classic student mistake |
| Extra assumptions | Normality of residuals, homogeneity of variance, independence | Those three plus linearity, homogeneity of regression slopes, and no post-treatment covariates | More ways for the analysis to go wrong |
| Typical power | Baseline | Higher, but only when the baseline correlation is meaningful | The gain is conditional, not automatic |
| Best fit | Group means differ and no control variable is needed | Pre-test/post-test studies, trials with unbalanced baselines, quasi-experiments | Match the test to the design rather than to the novelty |
Two quick definitions first, because the AI-generated answers people now read before clicking anything frame it exactly this way.
When to use ANOVA
Goal: compare means across two or more groups on a continuous outcome.
Variables: one categorical independent variable, one continuous dependent variable.
Example: comparing final exam scores across three teaching methods with no pre-test recorded.
When to use ANCOVA
Goal: compare those same means while statistically controlling a continuous starting point.
Variables: a categorical independent variable, a continuous dependent variable, plus at least one continuous covariate.
Example: the same three teaching methods, now with each student’s pre-test score entered as the covariate.
The question that settles it: would the groups still differ on the outcome if everyone started at the same baseline? If your honest answer is no, the pre-test score belongs in the model.
ANOVA vs ANCOVA: What Is the Core Difference?
ANOVA compares group means using the outcome variable alone. ANCOVA compares adjusted group means after the covariate’s contribution to the outcome has been accounted for.
Mechanically the difference is smaller than it sounds. ANCOVA is a regression in which the groups are dummy-coded into indicator variables and the covariate sits beside them in the same equation. SPSS will give you a GLM Univariate table; R will give you the same model from lm(). Nothing exotic is happening.
What changes is the error term. ANOVA splits the outcome variation into between-group and within-group parts. ANCOVA first removes whatever share of that variation the covariate explains, then does the same split on what’s left. Because the within-group error is smaller, the F statistic tends to be larger, which is exactly why ANCOVA often finds effects that plain ANOVA misses.
An adjusted mean is worth understanding before you go further. It is the mean your group would show at a common covariate value, typically the covariate’s overall mean across the whole sample. It is a modelled estimate, not an observed average, which is why you cannot simply divide it by your group size or report it as if it were real data.
Here is the practical illustration. Say three exercise groups start at baseline anxiety scores of 30, 18, and 12, and finish at 24, 16, and 11. A plain post-test ANOVA reads those final three numbers as the whole story. It cannot tell the difference between an intervention that helped and a group that simply started ahead.
ANCOVA on the same data fits one regression line per group, removes the piece of the outcome that tracks baseline anxiety, and compares where each group lands relative to that line. That is the difference between raw group means and adjusted group means, and it is the entire conceptual gap between the two tests.
What Research Question Does Each Test Answer?
ANOVA answers a clean question: on the outcome I measured, do these groups have different means? There is one categorical independent variable and one continuous dependent variable, and the design itself is expected to have dealt with anything else that differed between groups.
ANCOVA answers a slightly different question: do these groups differ on the outcome at a common value of the covariate? That reframing matters because it changes what your F test is actually a test of. You are no longer asking whether the observed final scores differ. You are asking whether the estimated groups differ once starting points have been equalised.
The covariate belongs in the model when it is part of your research design, not when it is merely available. Pre-test scores in a pre-test/post-test design are structural. Baseline severity in a clinical trial is structural. Age in a cross-sectional survey of lifespan outcomes is structural. Those were on the table before you collected a single outcome.
That distinction rules out a common move. People see a significant covariate in a preliminary regression and then build the ANCOVA around it. It inflates the Type I error rate and it is the wrong logic, because whether a covariate predicts the outcome marginally is not what qualifies it for inclusion.
The two-group case deserves its own note, because most guides skip it. With two groups you could run an independent-samples t-test on post-test scores or an ANCOVA adjusting for baseline. If you collected a reliable pre-test and the two groups differ at baseline, the ANCOVA is the better analysis. If the groups are balanced and you never measured a starting point, the t-test is fine and ANCOVA has nothing to offer.
When a Covariable Is Needed

Four conditions should all hold before you decide when to use ANCOVA instead of ANOVA.
- It is continuous. A numeric, interval-scale variable measured independently of your outcome. Age, pre-test score, baseline symptom severity, years of experience.
- It was measured before or independently of the treatment. Anything measured after the intervention begins cannot be a covariate. See the next section for why.
- It has a real conceptual relationship to the outcome. You need a reason, grounded in theory or prior work, that predicts this variable matters. Significance in your own data is not a reason.
- It is measured reliably. A noisy covariate adds variance instead of removing it, which defeats the entire purpose.
If the variable you want to control is categorical, such as gender or site, it is not a covariate. It is a second factor, and the analysis you want is a two-way ANOVA. That single realisation answers a large share of the questions people post with the title “ancova with categorical control variable”.
When to use ANCOVA instead of ANOVA: three exceptions to the rule
The covariate was affected by the treatment. If your intervention could plausibly change the covariate, controlling for it removes part of what you are trying to measure. Symptoms measured at post-treatment, attendance figures for a program that might alter attendance, salary for a study of career progression: all of these are outcomes or mediators, not baseline variables.
The covariate barely correlates with the outcome. This is the one that surprises people. If pre-test and post-test scores are essentially uncorrelated, the covariate explains almost nothing, contributes almost no power, and consumes a degree of freedom. Worse, the analysis becomes anti-conservative: the type I error rate is inflated rather than protected. Users on r/spss post this exact scenario, weak covariate correlation with ANCOVA results looking worse than plain ANOVA, and the answer is that the covariate is not earning its place.
The sample is small and the baseline correlation is low. The power advantage of ANCOVA comes entirely from the strength of the baseline-outcome relationship. With few participants per group and a weak correlation, that advantage disappears and the model can misbehave. If you have under roughly 20 participants per group and a baseline correlation below about 0.3, the safer path is an unadjusted analysis or a mixed model.
ANCOVA vs change scores vs repeated-measures ANOVA
Three groups measured before and after an intervention generate three defensible analyses, and the debate between them runs long in the cross-validated forum. Here is how I would decide.
| Method | What it estimates | Use it when | Main limitation |
|---|---|---|---|
| Post-test ANOVA | Difference in raw final scores | Groups were equivalent at baseline | Throws away the starting point information |
| Change score | Difference in gain from baseline | Pretest reliability is very high | Relies on the same reliability as the ANCOVA, and regression to the mean works against it |
| Repeated-measures ANOVA | Difference in within-person change | You want the time main effect and the interaction | Tests the interaction rather than a single adjusted post-test comparison |
| ANCOVA | Difference in adjusted post-test means | Pre-test score is conceptually part of the design and correlates with the outcome | Depends on homogeneity of regression slopes |
For a randomised or well-controlled pre-test/post-test study, ANCOVA on the post-test scores with pre-test as the covariate is the default choice in modern trial methodology, because it uses the baseline information without discarding measurement reliability. Change scores are more vulnerable to regression to the mean. Repeated-measures ANOVA is the right call when time is itself of interest, or when there is no usable pre-test covariate.
One practical warning from the trial literature: if the randomisation worked and your groups were equivalent at baseline, adjusting for the pre-test score can cost you a small amount of power rather than gain it. Adjustment is clearly worth it when baseline differences are real, and questionable when they are sampling noise.
ANCOVA Assumptions and Requirements
ANCOVA inherits every assumption of ANOVA and adds three of its own. The inherited ones: independent observations, normally distributed residuals, and homogeneity of variance across groups. Add a fourth practical requirement, enough participants in each group for the model to be stable.
The three ANCOVA-specific assumptions are where most published analyses quietly go wrong.
Linearity between the covariate and the outcome
The relationship between pre-test score and post-test score must be approximately linear across the observed range. Plot the covariate against the outcome, add a regression line, and look. A clear curve means you need a transformation or a different model rather than a straight ANCOVA.
Homogeneity of regression slopes
This is the assumption students find hardest and the one most guides bury. It requires that the covariate relates to the outcome with the same slope in every group. If your strong responders improve differently from your non-responders, the assumption fails and the single pooled effect estimate is misleading.
Test it by including the group by covariate interaction. In SPSS, run the ANCOVA with Model set to Full Factorial and look at the interaction row of the Tests of Between-Subjects Effects table. In R, fit lm(post ~ group * pretest, data = d) and inspect the group:pretest coefficient. If that term is significant at 0.05, you have a problem. Either drop the pooled effect and report the interaction, treat group as a factor with separate slopes, or switch to a mixed model.
No important post-treatment variables as covariates
Already covered, and repeated here because it is the one that invalidates an entire study rather than just weakening a test.
Running it in SPSS and R
In SPSS the path is Analyze, then General Linear Model, then Univariate. Put post-test score in the Dependent Variable box, group in the Fixed Factors box, and the pre-test covariate in the Covariates box. Set Model to Full Factorial so the interaction is tested. Then use Estimate Marginal Means with the EM Means box set to Group, plus Compare main effects, to get the adjusted means and post hoc comparisons.
In R, library(rstatix) with anova_test(post ~ group + pretest, data = d) gives you the Type II table and partial eta squared. For adjusted means, library(emmeans) with emmeans_test(post ~ group + pretest, covariate = pretest, data = d) gives pairwise comparisons on the estimated marginal means.
One gotcha that catches nearly everyone: base R’s aov() uses Type I sequential sums of squares, so the order of terms in the formula changes the answer. Put the covariate first and your F for group will not match the GLM output you saw elsewhere. Use Type II or Type III via car::Anova() whenever more than one predictor is in the model.
Choosing Between ANOVA and ANCOVA
Work through these five questions in order. The first “no” tells you which test to run.
- Did you measure a continuous starting point before the treatment, such as a pre-test, baseline severity, or a prior outcome on the same scale? If no, you cannot run ANCOVA. Full stop.
- Do your groups differ at baseline, or is your design one where balance is not guaranteed, such as a quasi-experiment or a non-randomised comparison? If no and you did measure a pre-test, plain ANOVA on post-test scores is usually the cleaner, more powerful analysis.
- Does the covariate have a clear theoretical or practical reason to predict the outcome, independent of anything you found in this dataset? If no, drop it.
- Is the correlation between covariate and outcome meaningful, and do you have enough participants per group to estimate the extra parameter? If no, ANCOVA buys you nothing.
- Are the assumptions testable in your sample, particularly linearity and homogeneity of regression slopes? If no, report the unadjusted analysis and explain why.
Two designs sit outside this frame entirely. If your participants are nested within schools, clinics, or sites, your groups are not independent, and both ANOVA and ANCOVA underestimate the standard errors. Use a linear mixed model with a random intercept for the site instead. If you have several correlated outcomes rather than one, you need MANCOVA, not ANCOVA.
A word about non-normality, because it drives more bad decisions than anything else in this area. The ANOVA family is fairly robust to mild departures from normality as long as group sizes are reasonable, and residuals rather than raw scores are what you should inspect. r/rstats users make this point repeatedly. If your residuals look clearly non-normal or you have serious outliers, transform the outcome or move to a robust method, but do not abandon ANCOVA for ANOVA on the grounds that your raw scores are not bell-shaped.
How to Report the Results
An ANOVA result needs the test statistic, both sets of degrees of freedom, the significance value, an effect size, and the descriptive statistics that go with it. A one-way ANOVA reporting template in APA 7 style looks like this, with invented numbers purely as an illustration of the format.
An analysis of variance was conducted to compare final exam scores across the three teaching methods. There was a significant effect of teaching method on final exam score, F(2, 117) = 6.42, p = .002, partial eta squared = .099. Tukey post hoc comparisons showed that the collaborative method (M = 81.4, SD = 9.2) scored significantly higher than the lecture method (M = 74.8, SD = 10.1), p = .004, and than the individual method (M = 73.2, SD = 11.6), p = .001. The lecture and individual methods did not differ significantly, p = .512.
An ANCOVA result needs the same core statistics plus the adjusted means and a statement about the covariate. Here is the template with an illustrative set of numbers.
An analysis of covariance was conducted to compare final exam scores across the three teaching methods, controlling for pre-test score. There was a significant effect of teaching method on adjusted final exam score, F(2, 116) = 9.17, p < .001, partial eta squared = .137. Adjusted means were 78.6 for the collaborative method, 75.1 for the lecture method, and 74.3 for the individual method. Bonferroni-corrected comparisons showed that the collaborative method scored significantly higher than the lecture method, p = .003, and higher than the individual method, p < .001. Adjusted means, not raw means, are reported throughout.
Also state the homogeneity of regression slopes check, because reviewers will look for it. A sentence such as “The assumption of homogeneity of regression slopes was tested by including the group by pre-test interaction, which was not significant, F(1, 117) = 0.84, p = .362, so the pooled model was retained” closes that line of questioning.
Two reporting habits separate a clean results section from a confusing one. Report adjusted means in every table and figure that involves the ANCOVA, and never mix raw means for one group with adjusted means for another. And report the degrees of freedom for the covariate effect too, so a reader can see how much variance the adjustment absorbed.
Which Should You Choose?
Use ANOVA when you are comparing outcome means across groups and no continuous variable needs statistical control. Use ANCOVA when a theoretically relevant continuous variable, measured before or independently of the treatment, should be held constant so the comparison happens at a common baseline.
Start by asking whether you actually collected a usable pre-test or baseline measure. If you did not, the decision is already made for you. If you did, run the unadjusted analysis first, look at whether baseline differences exist, and ask whether the covariate earns its degree of freedom.
Your research question and your design outrank any pull toward a more sophisticated analysis. A simple ANOVA that answers the question you asked is better than an ANCOVA that answers a question nobody posed. This guide was updated for 2026, and the decision rules above have not changed much in decades, which is reassuring for anyone about to defend a test choice in a viva.
Frequently Asked Questions
Can I use ANCOVA instead of ANOVA for pre-test and post-test data?
Yes, and it is usually the better choice. Enter post-test score as the outcome, group as the factor, and pre-test score as the covariate. ANCOVA compares adjusted means at a common baseline, which uses your pre-test data instead of discarding it. First confirm that pre-test and post-test scores are meaningfully correlated and that the group by pre-test interaction is not significant.
Is ANCOVA always better than ANOVA because it controls a variable?
No. ANCOVA gains power only when the covariate explains a real share of the outcome variation and you have enough participants per group to estimate it. With a small sample and a weak covariate-outcome correlation, ANCOVA becomes anti-conservative, inflating the type I error rate rather than protecting against it. Controlling for something is not automatically an improvement.
What variables can be used as covariates in ANCOVA?
Suitable covariates are continuous, measured before or independently of the treatment, conceptually related to the outcome, and reliably measured. Pretest scores, age, baseline symptom severity, prior performance, and years of experience all qualify. Categorical variables do not, and neither does anything the treatment could have changed, because controlling for a post-treatment variable removes part of the effect you are trying to measure.
Do I need a significant covariate before using ANCOVA?
No, and chasing significance here is backwards. The covariate is selected for conceptual and design reasons, not because it predicted the outcome in a preliminary regression. Selecting variables on the strength of their association with the outcome in the same data inflates the type I error rate. If you have no theoretical reason to expect a variable to matter, leaving it out of the model is the correct decision.
How do I report an ANCOVA result in a research paper?
Report the F statistic with both degrees of freedom, the p value, and an effect size such as partial eta squared. Alongside that, give the adjusted or estimated marginal means for each group rather than the raw means, plus any post hoc comparisons with their correction. State that homogeneity of regression slopes was tested and give the result of that test, since reviewers look for it.
What should I do if ANCOVA assumptions are violated?
If the group by covariate interaction is significant, the pooled effect is misleading. Report the interaction and describe the groups separately, or move to a model that allows slopes to vary by group. If the covariate-outcome relationship is curved, transform the outcome or the covariate. For seriously non-normal residuals or influential outliers, consider a robust method, though mild non-normality alone rarely justifies abandoning ANCOVA.
If you are still weighing when to use ANCOVA instead of ANOVA, start with the pre-test score you already have. Run the unadjusted analysis, then the adjusted one, and compare the F values. If the model holds up on the assumptions and the groups differ at baseline, ANCOVA is your answer. If not, ANOVA is not a lesser choice here, it is the correct one.