
Testing moderation means checking whether the link between your predictor and your outcome changes depending on a third variable. You do it by multiplying the predictor by the moderator, adding that product as a predictor in a multiple regression, and testing whether its coefficient is significant. If that interaction p-value is below .05, the relationship between your predictor and your outcome depends on the level of your moderator. That is the whole logic of how to test moderation with interaction terms, and everything below is just the mechanics of running and reporting that one test.
The method fits any field that runs multiple regression, and the same logic holds whether you work in R, SPSS, Stata, or Mplus. What changes between tools is only how you type the model and how you get the follow-up simple slopes.
Table of Contents
- 1What You Need
- 2Two practical constraints to check first
- 3How to Test Moderation with Interaction Terms: Step-by-Step
- 41. State the moderation hypothesis
- 52. Create the regression model
- 63. Enter the model in SPSS, R, Stata, or another statistics package
- 74. Test the interaction coefficient
- 85. Interpret simple slopes when moderation is significant
- 96. Report the moderation result
- 10Common Mistakes
- 11Frequently Asked Questions
- 12Do I need to center variables before testing moderation?
- 13Can a categorical variable be used as a moderator?
- 14What does a significant interaction term mean?
- 15Which statistical software is best for testing moderation?
- 16What is the difference between moderation and mediation?
- 17Conclusion
What You Need
Before you open any software, five things have to be settled on paper. Skipping this step is the most common reason a moderation test comes back unclear, because the model can only test what it was told to test.
An outcome variable (Y) that is continuous, or something you have already justified treating as continuous.
A focal predictor (X), the variable whose effect on Y you want to explain. Pick one focal predictor. Two-way interactions are fine, but running eight of them and reporting the two that cleared p < .05 is how false positives get published.
A moderator (Z), which can be continuous (stress score, caffeine tolerance, years of experience) or categorical (treatment group, gender, country). If Z is categorical with more than two groups, see step 5, because the implementation changes.
Control variables that you have a theoretical reason to hold constant. Include them as main effects. You do not automatically cross every control with the moderator; that decision depends on whether you think the control changes the focal relationship, and it should be stated as a deliberate modeling choice rather than added by habit.
A complete dataset with no missing values on those variables. Deleting listwise is the usual approach, and report how many cases that removed, because moderation models silently shrink when rows drop.
Two practical constraints to check first
Interactions are harder to detect than main effects. The same effect that is reliably found with 80 participants as a main effect may need several hundred participants as an interaction. If your sample is small, an insignificant interaction is not evidence that moderation is absent.
Variable coding has to be settled before anything else. A scale scored 1 to 5 and the same scale scored 1 to 100 will produce the same significance test but completely different coefficients, so decide your coding, then stick to it in the write-up. For a 0/1 dichotomous moderator, keep the 0 and 1 coding rather than mean-centering it.
How to Test Moderation with Interaction Terms: Step-by-Step
1. State the moderation hypothesis
Write the hypothesis in plain language first, then translate it into a statistical test. For example: sleep quality predicts job performance, and that relationship is stronger for people with high stress. That sentence names your outcome, your focal predictor, your moderator, and the direction of the moderation.
The statistical translation is a single testable statement: the coefficient on the product term XZ is not zero. The direction matters for interpretation, not for the test itself, since a two-sided test is standard, but state the expected direction anyway because it tells you what the result will mean if it is significant.
Decide at this stage whether moderation is the whole question or part of it. If you also want to argue that stress affects performance through sleep, that is a mediation question and it needs a different model.
2. Create the regression model
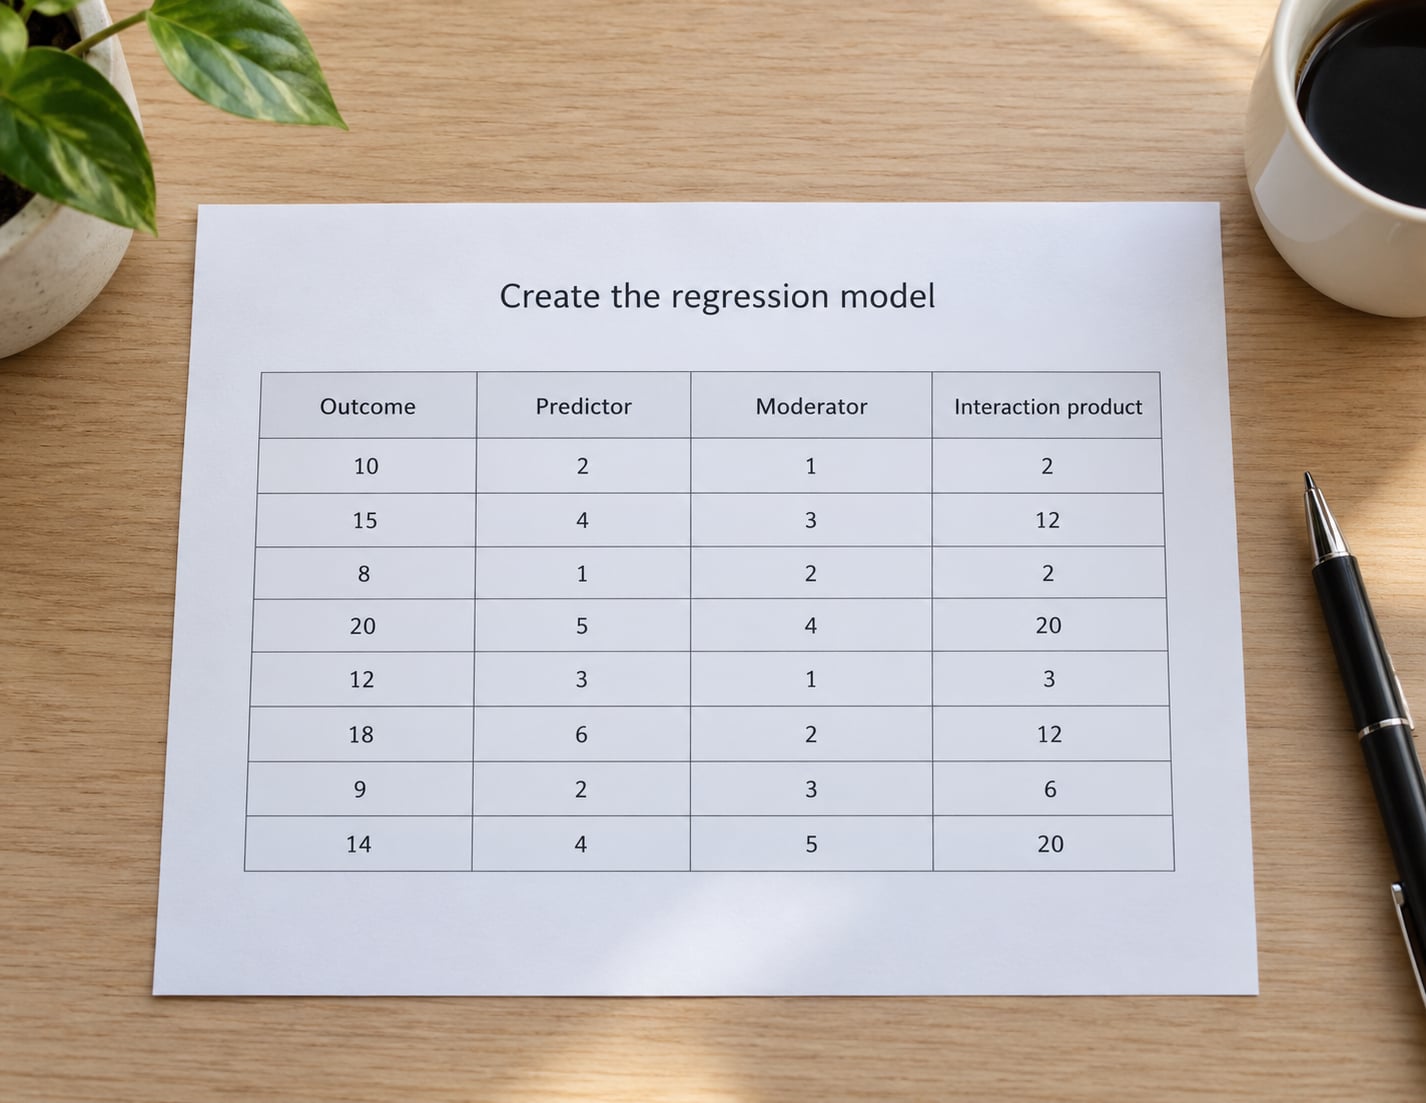
The moderated multiple regression model with one moderator is:
Y = β0 + β1X + β2Z + β3(XZ) + ε
β1 is the effect of X on Y when Z equals zero. β2 is the effect of Z on Y when X equals zero. β3 is the test: it tells you how much the X to Y slope changes for every one-unit increase in Z. If β3 is significantly different from zero, the relationship between X and Y depends on Z.
The interaction term is just a new column in your dataset containing the product of the two columns. That is all an interaction term is, and once it exists, nothing about it is special to any software package.
For continuous X and Z, mean-center both before multiplying: subtract each variable’s mean, then create the product from the centered columns. Centering does not change the significance of β3. What it changes is the intercept and the main effects, because now β1 is the effect of X at the average value of Z rather than at an arbitrary zero, which is usually a point no one actually observed.
Centering also reduces the correlation between the product term and its own components. That matters for the variance inflation factor of the interaction column, which is the diagnostic people most often misread in a moderation model.
3. Enter the model in SPSS, R, Stata, or another statistics package
In R, create the centered columns, multiply them, and fit the model with the base lm() function. Then ask car for the variance inflation factors, and interactions for the plot.
data$Xc <- data$X - mean(data$X)
data$Zc <- data$Z - mean(data$Z)
data$XZc <- data$Xc * data$Zc
fit <- lm(Y ~ Xc + Zc + XZc + age + tenure, data = data)
summary(fit)
car::vif(fit)
interactions::interact_plot(fit, "Xc", "Zc", mod_mediators = "XZc")
In SPSS, recode into new variables through Compute Variable, subtracting the mean for each, then create the product the same way. Open Analyze, Regression, Linear, and move X, Z, the product term, and the controls into the model block. Under Statistics, tick collinearity diagnostics so the VIF values appear in the output table.
In Stata, generate the centered variables, run regress Y Xc Zc XZc age tenure, then estat vif for the inflation factors.
In Mplus, declare the interaction on the line where you define the predictor, for example y ON x z (xz);, and make sure the moderator is a continuous exogenous variable in the model.
If you use Hayes PROCESS, run Model 1 for a single moderator and put the moderator in the Covariates box rather than on the Product panel. Then check the int_lm row in the model summary, which reports the interaction coefficient and its confidence interval directly.
Four things confirm the interaction term was built correctly. The model summary shows your product column under a name you recognize. The correlation between the product column and each of its components is close to zero after centering. The VIF of the product column is lower than it would be without centering. And re-running without the product term changes the intercept and main effects but leaves β3 exactly where it was.
4. Test the interaction coefficient
Look at the coefficient table and find the interaction row, β3. Read its significance column and its confidence interval.
Use the usual two-sided test with α = .05 unless your field or preregistration says otherwise. A 95% confidence interval for β3 that excludes zero corresponds to a two-sided test at .05, and the interval also tells you the range of plausible effect sizes, which the p-value alone cannot.
Here is the mistake that trips up most people. A significant main effect for X is not evidence of moderation. It only says X predicts Y, averaged over all values of Z. A significant β3 is the only evidence that the X to Y relationship changes across Z. You can have one, the other, both, or neither, and each combination means something different.
A significant interaction with two non-significant main effects is a perfectly normal result. The main effects describe the focal relationship at the mean of the moderator, and it frequently has no meaningful slope exactly there. What the significant interaction tells you is that the slope is positive for some values of Z and negative for others, cancelling out at the average.
Report the change in adjusted R-squared too. An interaction that is statistically significant but adds almost nothing to the model’s explained variance tells you the moderation is real but practically small, and readers deserve to know both halves of that.
5. Interpret simple slopes when moderation is significant
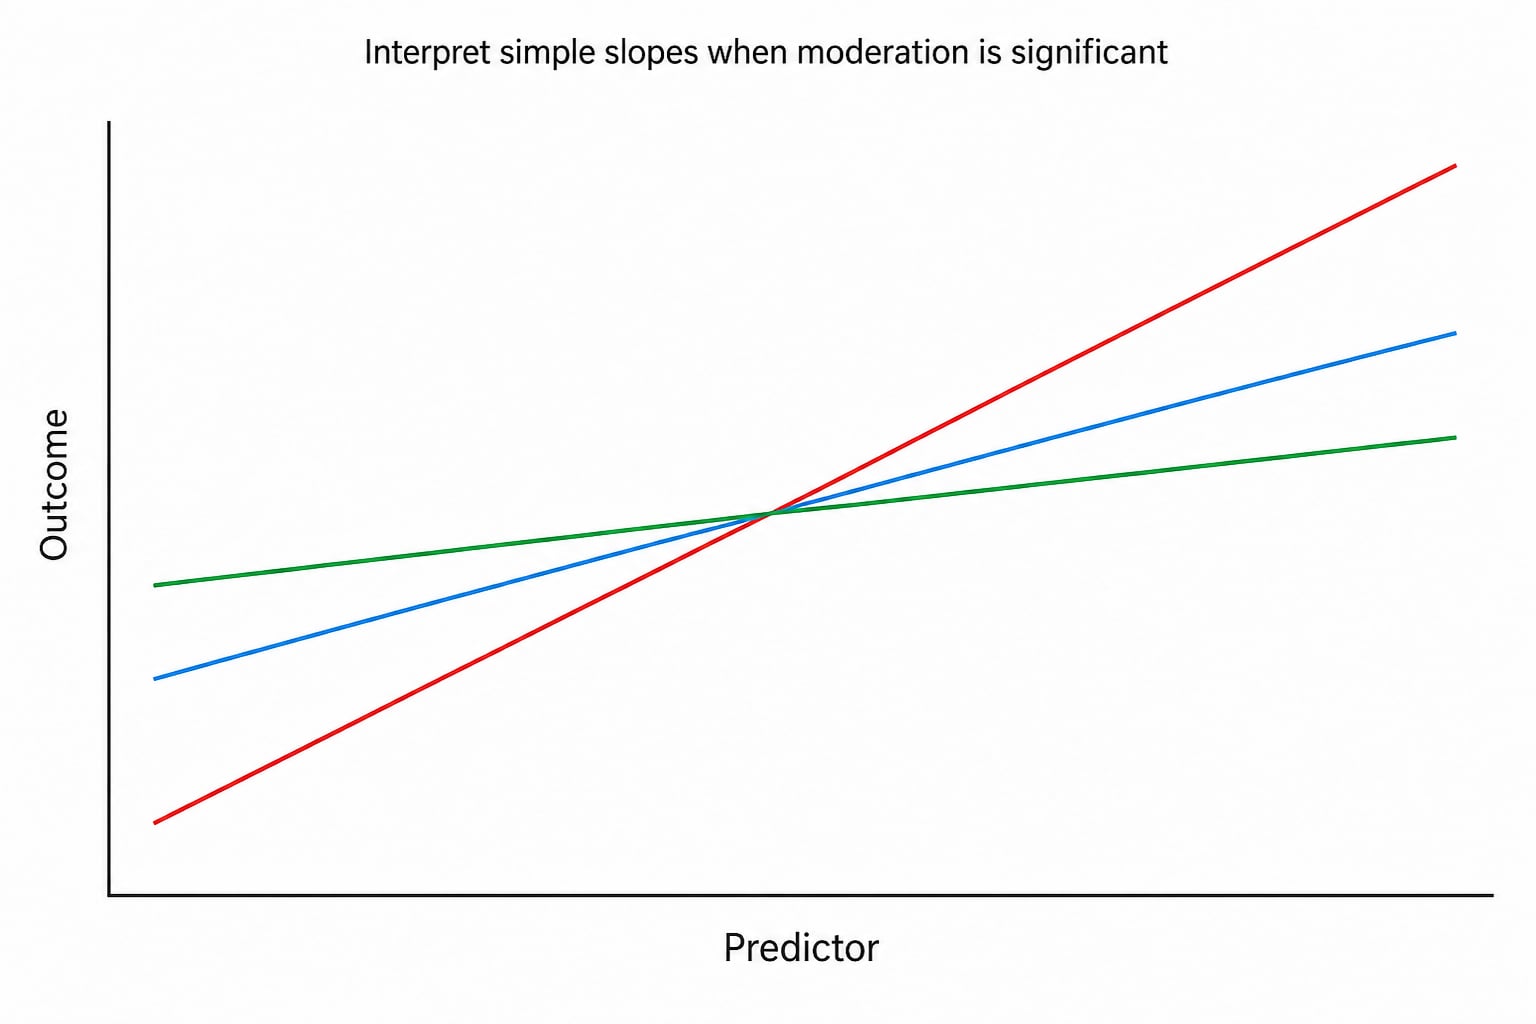
A significant β3 tells you moderation exists but not what it looks like. You get that from the conditional effects: the effect of X on Y at specific values of Z.
The standard approach is to compute the slope at one standard deviation below the mean of Z, at the mean, and at one standard deviation above. With centered variables, the slope of X at a given value of Z is β1 + β3 × that value, so at low, average, and high values you get three slopes you can each test for significance.
Plot those three slopes as an interaction plot. In the R code above, interact_plot() produces it directly; in SPSS, chart the predicted values from Linear Regression, or use the plot that PROCESS outputs. Crossed or converging lines make the moderation obvious to a reader who will never look at your coefficient table, which is exactly the point of producing one.
For a continuous moderator where the slope changes sign somewhere in the range, a Johnson-Neyman analysis is more informative than picking three values. It finds the specific value of Z where the slope of X becomes significantly different from zero, and reports the range of Z values on either side. PROCESS calculates this for you when you request it.
With a dichotomous moderator coded 0 and 1, you get two slopes instead of three, one per group, and you test whether they differ. Run the model with dummy-coded group variables plus the interaction, or run the regression separately within each group and then compare the coefficients.
With a categorical moderator of more than two groups, create dummy variables and enter one interaction per dummy so that one group is the reference category. A k-group moderator needs k minus 1 interaction terms, and each one answers the question of how that group differs from the reference group. If the moderator is numerical but recorded with a few ordered categories, keep it continuous instead of splitting it.
6. Report the moderation result
Write the model, the coefficient, the confidence interval, and the conditional effects in that order. A filled-in APA template looks like this, using an illustrative example:
A moderated multiple regression tested whether caffeine consumption predicted productivity differently across levels of caffeine tolerance. Tolerance was mean-centered, and the product of the two centered variables was entered along with the two main effects and controls for hours of sleep and seniority. The interaction term was significant, β = 0.41, SE = 0.13, t(198) = 3.15, p = .002, 95% CI [0.16, 0.66]. Simple slopes showed that caffeine predicted productivity for high-tolerance participants, β = 0.79, p < .001, but not for low-tolerance participants, β = 0.02, p = .84. The model explained 31% of the variance in productivity, Δ adjusted R-squared = .04 over the model with main effects only.
Substitute your own values and keep the order. A reader checking your work needs the equation, the interaction coefficient with its confidence interval, the controls you included, and the conditional effects. Leaving out the conditional effects is the most common reporting gap, because the coefficient alone does not tell the reader what the moderation means.
Common Mistakes
Most moderation analyses go wrong in ways that are easy to name and easy to fix. These are the ones that come up repeatedly in methods forums and peer review.
Running the model with main effects but no product term. If X and Z are both in the block and XZ is not, you ran an additive model and tested nothing about moderation. Add the product term and confirm it appears in the coefficients table under the name you expect.
Treating a significant main effect as moderation. That is an additive relationship with no conditional component. The test is the interaction coefficient and only the interaction coefficient.
Expecting both main effects to be significant when the interaction is. They often are not, and that is expected rather than alarming. Main effects are conditional effects evaluated at the mean of the other variable. Say so in your write-up and report the conditional effects instead.
Grouping variables the wrong way. Treating a numeric moderator as a set of categories throws away information and needs several interaction terms. Treating a genuinely categorical moderator as continuous invents meaningless values between groups, like a group code of 0, 1, and 2 implying that group 2 sits twice as far along something as group 1.
Panicking at a high VIF on the interaction column. A product term is mechanically correlated with the variables it multiplies, so its VIF will be higher than the others even in a clean model. Centering usually brings it down, and VIFs in the single digits are acceptable for most research. What matters is whether the interaction itself is stable, which you can check by re-running after removing any case with a very high Cook’s distance.
Reporting a p-value with no effect size. Give the unstandardized and standardized coefficient, its confidence interval, and the change in adjusted R-squared. Significance alone does not tell a reader whether the moderation is trivial.
Stopping at the interaction coefficient. A significant β3 with no simple slopes, no plot, and no description of the conditional pattern leaves the reader unable to say what the moderation means in practice. Probing the interaction is part of the analysis, not an optional extra.
Writing causal language for observational data. Unless your design randomizes and manipulates, the wording should be associational. A significant interaction tells you the relationship varies, not that the moderator caused it to vary.
Splitting the sample instead of modeling the interaction. Running separate regressions per group and eyeballing whether one slope is bigger wastes statistical power and gives you no formal test of the difference. Fit one model with the interaction term and then probe it.
Frequently Asked Questions
Do I need to center variables before testing moderation?
Center both the focal predictor and the moderator when both are continuous, then build the product term from the centered columns. Centering does not change whether the interaction is significant or the size of the interaction coefficient. It changes the intercept and the main effects, so the coefficients for X and Z become effects at the average value of the other variable, which is easier to write about. Leave a 0/1 dichotomous moderator coded as 0 and 1.
Can a categorical variable be used as a moderator?
Yes, and it is common. Code the groups as dummy variables, keep one as the reference category, and enter one interaction term per dummy, so a three-group moderator needs two interaction terms. Each interaction then compares that group with the reference group. A dichotomous moderator gives you two slopes, one per group, which are easier to report than a set of contrasts.
What does a significant interaction term mean?
It means the effect of your focal predictor on the outcome changes depending on the moderator. In the model Y = b0 + b1X + b2Z + b3(XZ), a significant b3 says that every one-unit rise in the moderator changes the slope of X by that amount. It does not mean the moderator causes anything, and it does not require both main effects to be significant.
Which statistical software is best for testing moderation?
Any of them works, and the model is identical underneath. R gives the most control and the cleanest plots through the interactions package. SPSS is fine, either through Analyze, Regression, Linear with collinearity diagnostics ticked, or through Hayes PROCESS Model 1, which automates simple slopes and Johnson-Neyman output. Stata and Mplus handle it equally well. Pick what you already know.
What is the difference between moderation and mediation?
Moderation asks whether the relationship between X and Y changes across levels of a third variable, and it is tested by the product term XZ. Mediation asks whether X affects Y through a third variable, and it is tested by whether X predicts that third variable and whether the third variable then predicts Y. A moderation model is one regression with a product term. A mediation model needs the indirect effect estimated, often with a bootstrap.
Conclusion
Testing moderation with interaction terms is one coefficient in one regression. Define your outcome, focal predictor, and moderator, center the two continuous variables, multiply them, add the product term to the model with your controls, and test that coefficient with a two-sided test. Read the confidence interval, check the VIF, then plot simple slopes at low, average, and high values of the moderator. Report the equation, the interaction coefficient, and the conditional effects together. The model is easy; the interpretation is where the work is, so leave enough room for it.