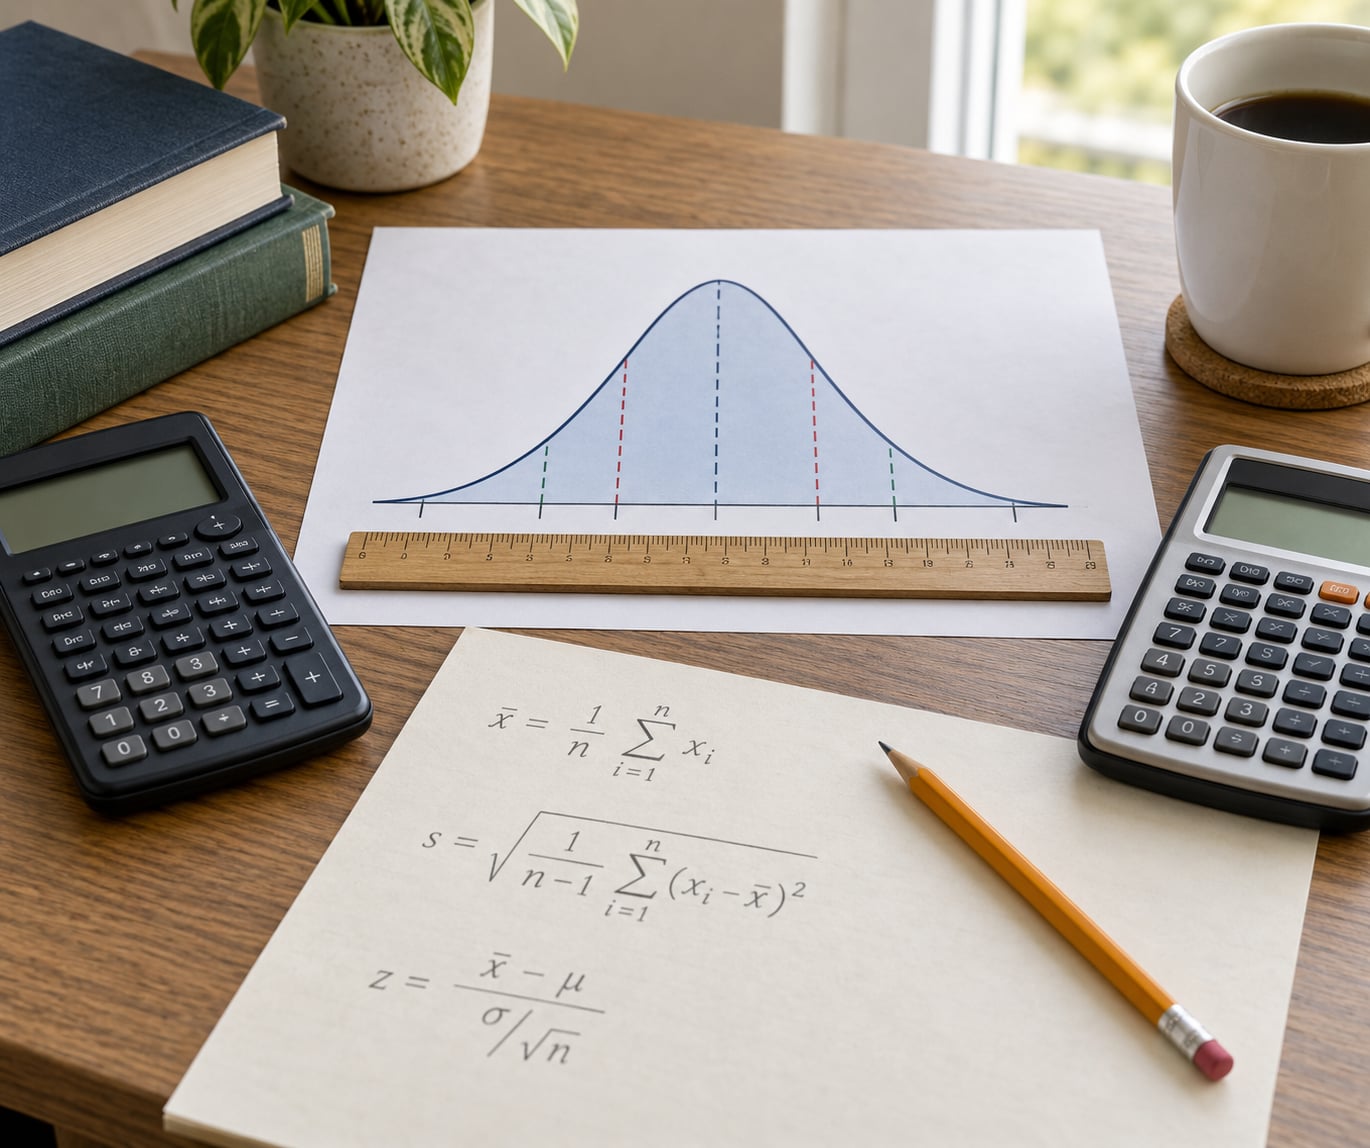
The difference between z test and t test comes down to a single input: whether you know the population standard deviation. Use a z-test when sigma is known, so the denominator is sigma divided by the square root of n. Use a t-test when sigma is unknown and has to be estimated from your sample, which adds uncertainty the t-distribution absorbs with heavier tails.
That is the whole rule, and it is also the rule your software already applies for you behind the scenes. The rest of this guide covers what each test measures, the formulas with every variable defined, a worked example run both ways on the same data, and the situations in which each test wins.
Table of Contents
- 1Difference Between Z Test and T Test at a Glance
- 2What Is the Difference Between Z Test and T Test?
- 3What a z-test actually tests
- 4What a t-test actually tests
- 5Why the difference between z test and t test is about uncertainty, not sample size
- 6When to Use the Difference Between Z Test and T Test
- 7The decision rule: do you know sigma or not?
- 8Use a z-test when
- 9Use a t-test when
- 10What Assumptions Do Z Tests and T Tests Have?
- 11How Do You Calculate a Z Test?
- 12How Do You Calculate a T Test?
- 13What Do Z Test and T Test Results Mean?
- 14One-tailed and two-tailed is a separate decision
- 15A z score and a t score are not the same thing
- 16Can You Use a Z Test With a Small Sample?
- 17Which Test Is Used in SPSS, Stata, R, and SAS?
- 18Z Test Vs T Test: Which Should You Choose?
- 19Frequently Asked Questions
- 20What is the main difference between a z test and a t test?
- 21Is a t test always more accurate than a z test?
- 22When should I use a z test instead of a t test?
- 23Why do textbooks use a z test for large samples?
- 24Can I compare the p-values from a z test and a t test?
- 25Which software command runs a z test or a t test?
- 26Conclusion
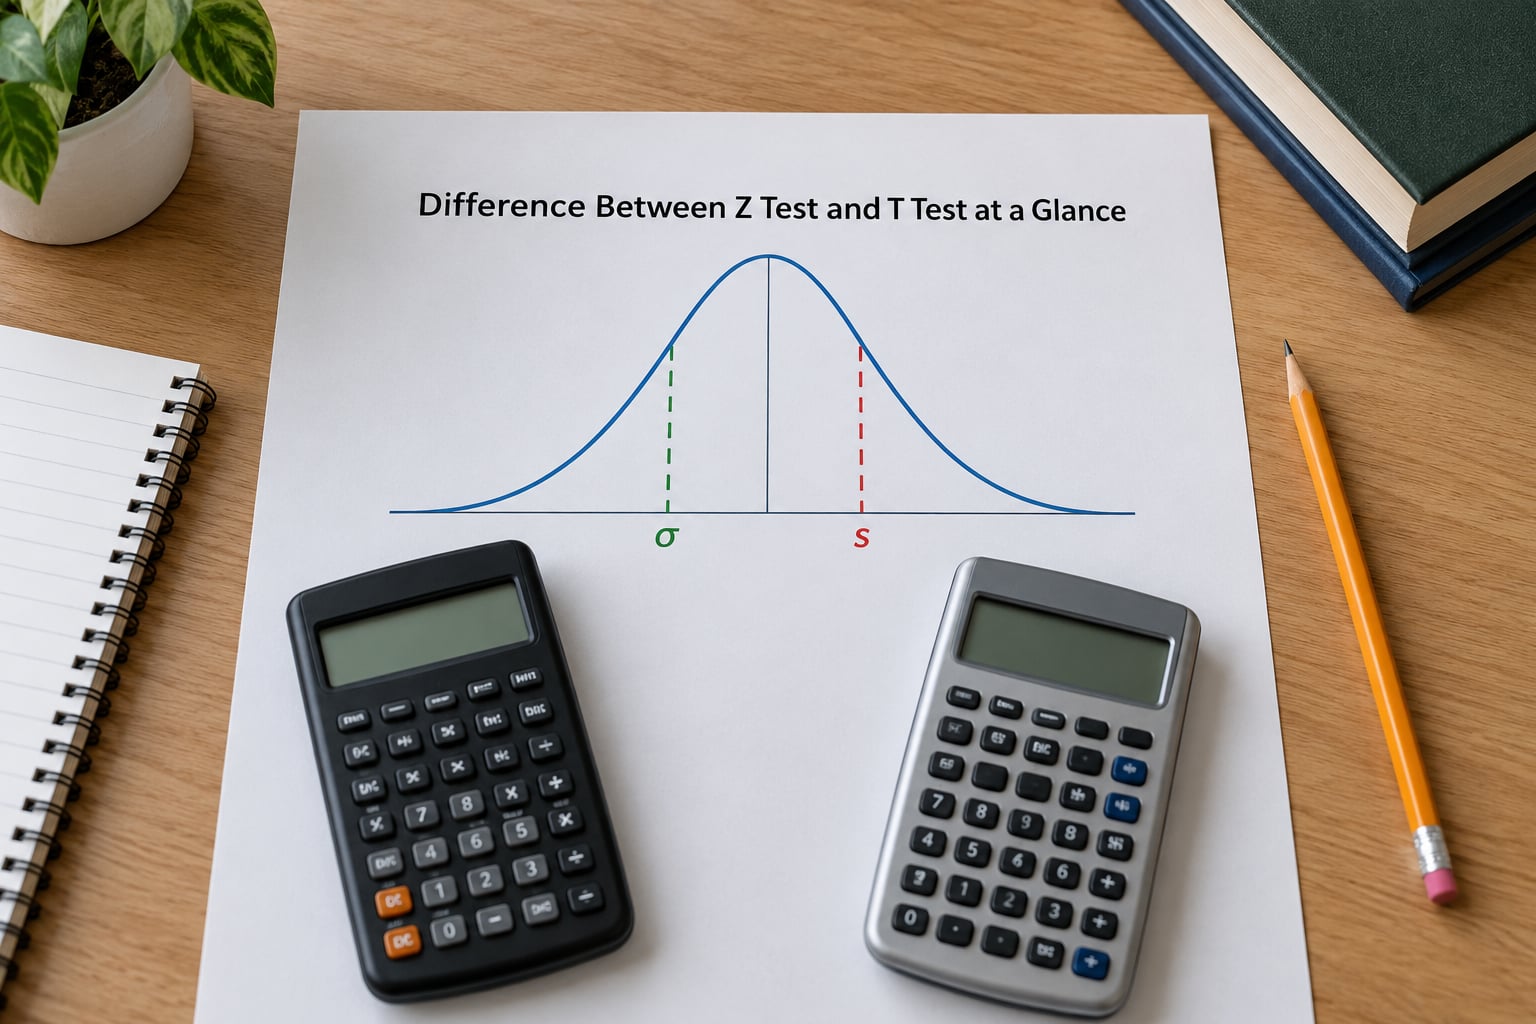
Difference Between Z Test and T Test at a Glance
| Criterion | z-test | t-test |
|---|---|---|
| What it tests | Whether a sample mean or proportion differs from a hypothesised population value | Same job: a mean compared with a population value, or two group means with each other |
| Population standard deviation | Known (sigma given or reliably established) | Unknown, estimated from the sample as s |
| Reference distribution | Standard normal distribution, fixed | Student’s t-distribution, changes with degrees of freedom |
| Degrees of freedom | None, treated as infinite | n minus 1 for one-sample, n1 + n2 minus 2 for independent two-sample |
| Denominator | sigma divided by the square root of n | s divided by the square root of n, plus the df-dependent penalty in the reference distribution |
| Tails | Thin | Heavier, so extreme statistics are less surprising |
| Sample size | Relies on the central limit theorem, so usually n at or above 30 | Valid at any n, and the only defensible choice below about 30 |
| Critical value at alpha 0.05, two-tailed | 1.96 always | 2.064 at df 24, 2.228 at df 10, 1.684 at df 60, so it moves with n |
| Practical result | P-values sit closer to the normal curve, slightly smaller for the same data | P-values are slightly larger and more conservative for the same data |
| Software default | Rare, mostly for proportions and very large samples | The default everywhere: SPSS, R, Stata and SAS all assume sigma is unknown |
| Where you meet it | Census or administrative data, quality control, proportion tests, A/B experiment platforms | Coursework, psychology, education, biology, clinical and survey research |
Short version: if the number in front of you is the population standard deviation, you are doing a z-test. If the number in front of you is the sample standard deviation, you are doing a t-test, and no sample size makes that label wrong.
What Is the Difference Between Z Test and T Test?
What a z-test actually tests
A z-test asks how far a sample mean sits from a population mean that you have specified in advance, measured in units of standard error, then compares that distance to the standard normal distribution. Write the null hypothesis as a statement about a population, for example that the mean exam score of all students is 70, and the test returns a z statistic you look up in a z table.
The z statistic is a number of standard errors away from the null value. A z of 2 means the sample mean landed two standard errors above what the null hypothesis predicts, which is a fairly unusual position under a normal curve.
What a t-test actually tests
A t-test does the same comparison but divides by the sample standard deviation instead, and compares the result to Student’s t-distribution rather than the normal one. The t distribution is generated by a ratio of a normal quantity to an estimate of sigma, and that estimate is itself noisy, so the result is not perfectly standard normal and the reference curve has to stretch to match.
Note the detail that trips people up: the t formula cannot contain the unknown population mean. Many online formulas write t as (x-bar minus mu) divided by s, which is not a valid statistic because mu is exactly the quantity you are trying to test. The mu in the formula is the hypothesised value, not the real population mean.
Why the difference between z test and t test is about uncertainty, not sample size
Here is the intuition that most courses skip. When sigma is known, the denominator is a fixed constant and your statistic is exactly standard normal. When sigma is estimated from s, the denominator wobbles, and a wobbling denominator pushes values toward the extremes more often than a normal curve would.
So the t-distribution is built with heavier tails, which is a way of saying: given that we guessed the spread from the data, an extreme statistic is less surprising than the normal curve claims. Look at the critical value row in practice: at df 10 the two-tailed critical value is 2.228 rather than 1.96, a gap of about 14 percent that shrinks as n grows.
The variables involved, defined once here so the formulas later are not guesswork:
- mu (or mu-zero): the population mean stated in the null hypothesis.
- sigma: the population standard deviation, known in advance for a z-test.
- x-bar: the mean of your sample observations.
- s: the sample standard deviation, computed with n minus 1 in the denominator.
- n: the number of observations in the sample.
- alpha: the significance level you set before looking at results, usually 0.05.
- df: degrees of freedom, the number of independent pieces of information left in the sample estimate.
When to Use the Difference Between Z Test and T Test
The decision rule: do you know sigma or not?
Ask two questions in order. Is the population standard deviation known from a previous study, a census, a quality-control record or a published figure? And is your sample large enough that the central limit theorem has done its work? The first question decides the test. The second decides how worried you should be about the normality assumption.
Use a z-test when
- The population standard deviation is known or comes from a full census of the population.
- You are testing a population proportion, where the standard error comes from the null proportion rather than from an estimated spread.
- Your sample is large and the quantity you divide by came from an external source, not from this sample.
- You are working with administrative or census data where every unit was measured, so no estimation is involved.
- Quality control and process control, where the historical process standard deviation is a known constant.
Use a t-test when
- The population standard deviation is unknown, which in applied research is almost always the case.
- Your sample is small, commonly fewer than 30 observations, and normality cannot be assumed.
- You are comparing two independent groups or a paired before-and-after set of measurements.
- Your course, tutor or journal expects a t statistic, which is the reporting convention in most social science fields.
- You want the conservative answer, since a t-test never produces a smaller p-value than the matching z-test on the same data.
One rule deserves a direct correction. The n at or above 30 guideline is a convention, not a law. If the population standard deviation is unknown, use a t-test regardless of sample size, and many statisticians prefer the t-test at every sample size because it costs almost nothing when n is large.
What Assumptions Do Z Tests and T Tests Have?
Both tests rest on the same foundation, and the assumptions are about your data rather than about the choice between them. Here is what each one means in practice.
- Random sampling. Observations should be drawn at random from the population you claim to describe. Convenience samples break the logic of the p-value no matter which test you run.
- Independence. One observation should not influence another. Cluster sampling, repeated measures on the same person and matched-pair designs all violate this and need a paired or clustered method instead.
- Approximate normality of the sample mean, not of the raw data. This is the point most people miss. The central limit theorem says the sampling distribution of the mean approaches normality as n grows, so mild skew in the raw data is fine. Severe skew matters much less at n of 50 than at n of 8.
- No extreme outliers. A single value far from the mean drags both the mean and s, and t-tests react more to this than z-tests because s is in the denominator.
- Equal variances for the pooled two-sample t-test. The standard independent-samples t-test assumes similar spreads in both groups, and Welch’s version is the safer default when you are not sure.
- Population parameter versus sample estimate. The z-test uses theoretical population values, which is why it needs the whole population’s sigma. The t-test works with sample estimates and carries the cost of that estimation in its reference distribution.
When the normality assumption genuinely fails and the sample is small, neither parametric test is the right tool. A Wilcoxon signed-rank test or a Mann-Whitney U test compares ranks instead of means, and a bootstrap gives you a confidence interval without assuming a distribution at all.
How Do You Calculate a Z Test?
Start with the one-sample z test for a mean:
z = (x-bar minus mu-zero) divided by (sigma divided by the square root of n)
The two-sample form for two independent groups is:
z = (x-bar-one minus x-bar-two) divided by the square root of (sigma-one squared divided by n-one, plus sigma-two squared divided by n-two)
And for a population proportion:
z = (p-hat minus p-zero) divided by the square root of p-zero times one minus p-zero, all divided by n
Here is the one-sample case with real numbers. A packaging line is documented as producing 100 gram packs with a population standard deviation of 15 grams. You weigh 64 packs and get a mean of 103.2 grams. The standard error is 15 divided by the square root of 64, which is 15 over 8, so 1.875 grams. The z statistic is 3.2 divided by 1.875, giving z equals 1.71.
On the standard normal table, a z of 1.71 falls between 0.90 and 0.95, so the two-tailed p-value is about 0.088. That is above 0.05, so you would not reject the null hypothesis and report that the evidence does not show the line is off spec.
For a proportion, suppose one landing page converts at 56 percent across 400 visits and you test it against a 50 percent baseline. The standard error under the null is the square root of 0.5 times 0.5 divided by 400, which is 0.025. The z statistic is 0.06 divided by 0.025, giving z equals 2.40, a two-tailed p-value of about 0.016.
That proportion formula is the one you will actually use in testing. Comparing two page variants works the same way, except that the two sample sizes are added inside the square root rather than used alone, so the standard error grows. Notice what never appears in either version: a population standard deviation. The spread comes from the null proportion, which is known by construction, and that is why proportion tests are legitimately z tests.
How Do You Calculate a T Test?
The one-sample t test swaps s for sigma and adds degrees of freedom:
t = (x-bar minus mu-zero) divided by (s divided by the square root of n), with df = n minus 1
The independent two-sample version is:
t = (x-bar-one minus x-bar-two) divided by the square root of (s-one squared divided by n-one, plus s-two squared divided by n-two), with df = n-one plus n-two minus 2
For paired data you test the differences rather than the two columns of raw scores, and use each pair’s difference as a single observation. If d-bar is the mean difference and s-d is the standard deviation of those differences, then t = d-bar divided by s-d over the square root of n with df = n minus 1.
Worked one-sample example. Twenty-five students take a practice exam scored out of 120 and their mean score is 103.2, the same 3.2-point gap used in the packaging example above, with a sample standard deviation of 16.4. Testing against the same null value of 100, the standard error is 16.4 divided by the square root of 25, which is 16.4 over 5, so 3.28. The t statistic is 3.2 divided by 3.28, giving t equals 0.976 with 24 degrees of freedom. The two-tailed p-value is about 0.34, nowhere near significance.
Now the two-sample version, which is the version most coursework asks for. Group one has 25 students averaging 82.4 with s of 9.8, and group two has 27 students averaging 76.1 with s of 11.2. The standard error is the square root of 96.04 over 25 plus 125.44 over 27, which is the square root of 3.84 plus 4.65, giving 2.91. The t statistic is 6.3 divided by 2.91, so t equals 2.16 with df of 50, and the two-tailed p-value is about 0.035.
Put the two approaches side by side on comparable data and the gap is small. The z version of a 2.16 statistic gives a p-value near 0.031; the t version gives 0.035. Both are significant at 0.05 and both would be written up the same way, which is why most researchers never notice which test a colleague used.
What Do Z Test and T Test Results Mean?
Four numbers come out of either test, and here is what each one is doing. The test statistic, z or t, is the distance from the null value in standard error units. The p-value is the probability of a statistic at least this extreme, assuming the null hypothesis is true. The critical value is the threshold your statistic must beat at your chosen alpha, and it is what you look up in a z table or t table. The confidence interval is the range of values consistent with the data at your confidence level, usually 95 percent.
Statistical significance is not the same as importance. A p-value of 0.04 on a difference of 0.2 points is statistically detectable but practically meaningless, and no test in this family can tell you which one you have. That is a question about effect size, which you should report alongside the test.
Reporting in APA style, a t test reads: “students in the seminar condition (M = 82.4, SD = 9.8) scored higher than those in the lecture condition (M = 76.1, SD = 11.2), t(50) = 2.16, p = .035.” A z test uses the letter z and no degrees of freedom, since there are none: “z = 2.40, p = .016.” Using the wrong letter for your test is the most common reporting error I see in student drafts.
One-tailed and two-tailed is a separate decision
Students routinely confuse the z versus t choice with the one-tailed versus two-tailed choice, and they are independent of each other. The first question is which distribution supplies the reference curve. The second is whether your alternative hypothesis specifies a direction.
| Test | Critical value at alpha 0.05, two-tailed | Critical value at alpha 0.05, one-tailed |
|---|---|---|
| z test, standard normal | 1.96 | 1.645 |
| t test at df 24 | 2.064 | 1.711 |
Choose one-tailed only when you committed to a direction before collecting data. Choosing it after seeing that your result leaned one way inflates your false positive rate, and most journals and markers will ask about that.
A z score and a t score are not the same thing
A z score standardises a single observation against a known population mean and known sigma, which is why it appears in IQ tests and in the familiar 68-95-99.7 rule. A t score does the same job for one observation but uses the sample mean and sample standard deviation, so its spread depends on your sample size.
The conversion is straightforward once you accept that s is itself an estimate. If a z score is z, the matching t score is t equals z multiplied by the square root of n divided by n minus 1. With z equals 1.96 and n of 10, the t value is about 2.07, and with n of 100 it is 1.97, essentially the z value. That shrinking factor is the same uncertainty argument the t-distribution encodes, applied to a single score rather than to a test.
Can You Use a Z Test With a Small Sample?
You can, but only under conditions that are rarely satisfied in coursework, and the t test is the safer choice. The z test assumes the sampling distribution of the mean is exactly normal. The central limit theorem says that distribution approaches normality as n grows, and 30 is where textbooks draw the line, but the approximation’s quality also depends on the shape of the population distribution.
With a small sample and a symmetric, bell-shaped population, the normal approximation is decent. With a small sample and a heavily skewed population, the approximation fails badly, and the z test will hand you a p-value that is too small, meaning you overstate your evidence.
The honest version of the n at or above 30 advice: it is a useful convention for teaching, not a licence to switch tests. If sigma is genuinely known and your sample is at least 30, a z test is defensible. If sigma is unknown, a t test is correct at n of 12 and n of 12,000 alike, and at large n the two tests converge to the same answer anyway. A t at df of 200 gives 1.972, against a z of 1.96. The difference stops mattering long before your study is finished.
What you should avoid is the reverse move, using a z test with n of 10 and a skewed variable because the formula looked simpler. That is the case where the two tests disagree enough to change a conclusion.
Which Test Is Used in SPSS, Stata, R, and SAS?
All four default to the t test, which is correct whenever sigma is unknown. Knowing where each command lives saves you from concluding you ran the wrong test because a textbook said z.
- SPSS: Analyze, then Compare Means, then One-Sample T Test for one sample and Independent-Samples T Test or Paired-Samples T Test for the other two. The z test is not in the modern menus, so a known-sigma analysis means computing the statistic yourself.
- R: t.test(x, mu = 100) for one sample, t.test(group ~ condition) for two independent groups, and t.test(before, after, paired = TRUE) for matched data. For proportions, prop.test and binom.test do the work. There is no base R z test for means, so you compute z and call pnorm().
- Stata: ttest for means, which reports both the t statistic and a z statistic alongside it. ztest handles the known-sigma version directly, and prtest handles proportions.
- SAS: PROC TTEST covers one-sample, two-sample and paired tests. PROC MEANS with an H0 statement handles a one-sample comparison, and for a z test with a known sigma you compute the statistic and use PROBNORM for the p-value.
Whatever you use, check the denominator in the output. If it shows a standard error built from s, the routine estimated the spread and you ran a t test, whatever the menu said. That single check settles most of the confusion students bring to this topic.
Z Test Vs T Test: Which Should You Choose?
Choose by the situation in front of you, not by the size of the number you want to see. If the population standard deviation is known from a census or a reliable external source, use a z test. If it is unknown, use a t test, and ignore sample size as the deciding factor.
A few specific cases. Comparing two independent group means with unknown spreads means an independent-samples t test, and Welch’s version unless you have good reason to assume equal variances. Before-and-after measurements on the same subjects mean a paired t test on the differences, not an independent test. A proportion comparison means a z test on the proportion, and no t test applies. Very large administrative datasets with a documented sigma mean a z test is fine and the t result will be nearly identical.
Two diagnostic questions settle almost every case. Is the population standard deviation known? And what is your sample size? If sigma is known and n is comfortable, use the z test. If sigma is unknown, use the t test. If both answers are unclear, the t test is the safer of the two, because it is conservative and costs you almost no power at large n.
Frequently Asked Questions
What is the main difference between a z test and a t test?
A z test is used when the population standard deviation sigma is known, so the standard error is sigma divided by the square root of n. A t test is used when sigma is unknown and estimated from the sample as s. The reference distribution follows: the z test uses the standard normal curve, while the t test uses Student’s t with heavier tails and degrees of freedom equal to n minus 1.
Is a t test always more accurate than a z test?
Not always, but it is never the wrong choice when sigma is unknown. On identical data a t test gives a slightly larger p-value than a z test, so it is the more conservative and usually the more defensible result. At large sample sizes the two are nearly identical, with a t of about 1.97 against a z of 1.96, so accuracy is not a practical concern once n passes 30.
When should I use a z test instead of a t test?
Use a z test when the population standard deviation is genuinely known, which happens with census or administrative data, a documented process standard deviation, or a proportion test where the spread comes from the null proportion. The central limit theorem means this is most defensible at n of 30 or more. If sigma was estimated from your own sample, a t test is the correct choice.
Why do textbooks use a z test for large samples?
The central limit theorem says the sampling distribution of the mean approaches normality as the sample grows, so at large n the exact normal distribution is a good stand-in. Textbooks draw the line at 30 because that is where the approximation is usually acceptable. The rule is a teaching convention, not a requirement, and many statisticians use the t test at every sample size because the two converge.
Can I compare the p-values from a z test and a t test?
You can compute both, and the t p-value will always be the larger of the two on the same data, because the t distribution has heavier tails. A meaningful comparison tells you little, though: the two tests answer the same question and differ only in how the spread is estimated. Report the one your assumptions support rather than reporting whichever gives the smaller p-value.
Which software command runs a z test or a t test?
For a t test, SPSS uses Analyze then Compare Means, R uses t.test(), Stata uses ttest, and SAS uses PROC TTEST. A dedicated z test for means is rarer: Stata has ztest and SAS can compute the statistic and use PROBNORM, while SPSS and base R expect you to calculate it yourself. Proportion tests, which are legitimately z tests, are available in all four as prop.test, prtest, or the equivalent.
Conclusion
The difference between z test and t test is not really about sample size. It is about whether the population standard deviation is known, because knowing it means the denominator is fixed and the normal distribution applies, while estimating it adds uncertainty that the heavier-tailed t-distribution is built to absorb.
Before you report a result, run three checks. Confirm whether sigma was known or estimated, count the observations, and look at whether the normality and independence assumptions actually hold for your data. If sigma was estimated from your sample, a t test is the right answer at any sample size, and nobody will fault you for it.