
The difference between cross-sectional and longitudinal studies is timing. A cross-sectional study measures a sample once, at a single point in time, like a photograph. A longitudinal study measures the same people repeatedly over months or years, like a video recording of the same scene.
That single difference changes what you can claim. A snapshot tells you what is true right now and how common something is. Repeated measurements tell you what happened first, what followed, and how the same individual changed.
If you are writing a methods chapter or picking a design for a dissertation, the question you are actually asking matters more than the label. Ask whether you need a picture of a moment or a record of a process, then pick the design that matches.
Table of Contents
- 1Difference Between Cross-Sectional and Longitudinal Studies at a Glance
- 2What Is a Cross-Sectional Study?
- 3What Is a Longitudinal Study?
- 4How Do the Two Designs Collect Data Differently?
- 5Which Design Is Better for Measuring Change?
- 6Can Either Design Establish Cause and Effect?
- 7Which Design Is Easier and Less Expensive?
- 8Which Statistical Methods Are Commonly Used?
- 9What Are the Main Strengths and Limitations?
- 10Cross-Sectional or Longitudinal: Which Should You Choose?
- 11Frequently Asked Questions
- 12What is the main difference between a cross-sectional and longitudinal study?
- 13Is a cross-sectional study better than a longitudinal study?
- 14Can a cross-sectional study measure change over time?
- 15How many participants are needed for a longitudinal study?
- 16Which design is more suitable for a dissertation or thesis?
- 17What are the main disadvantages of longitudinal research?
- 18Conclusion
Difference Between Cross-Sectional and Longitudinal Studies at a Glance
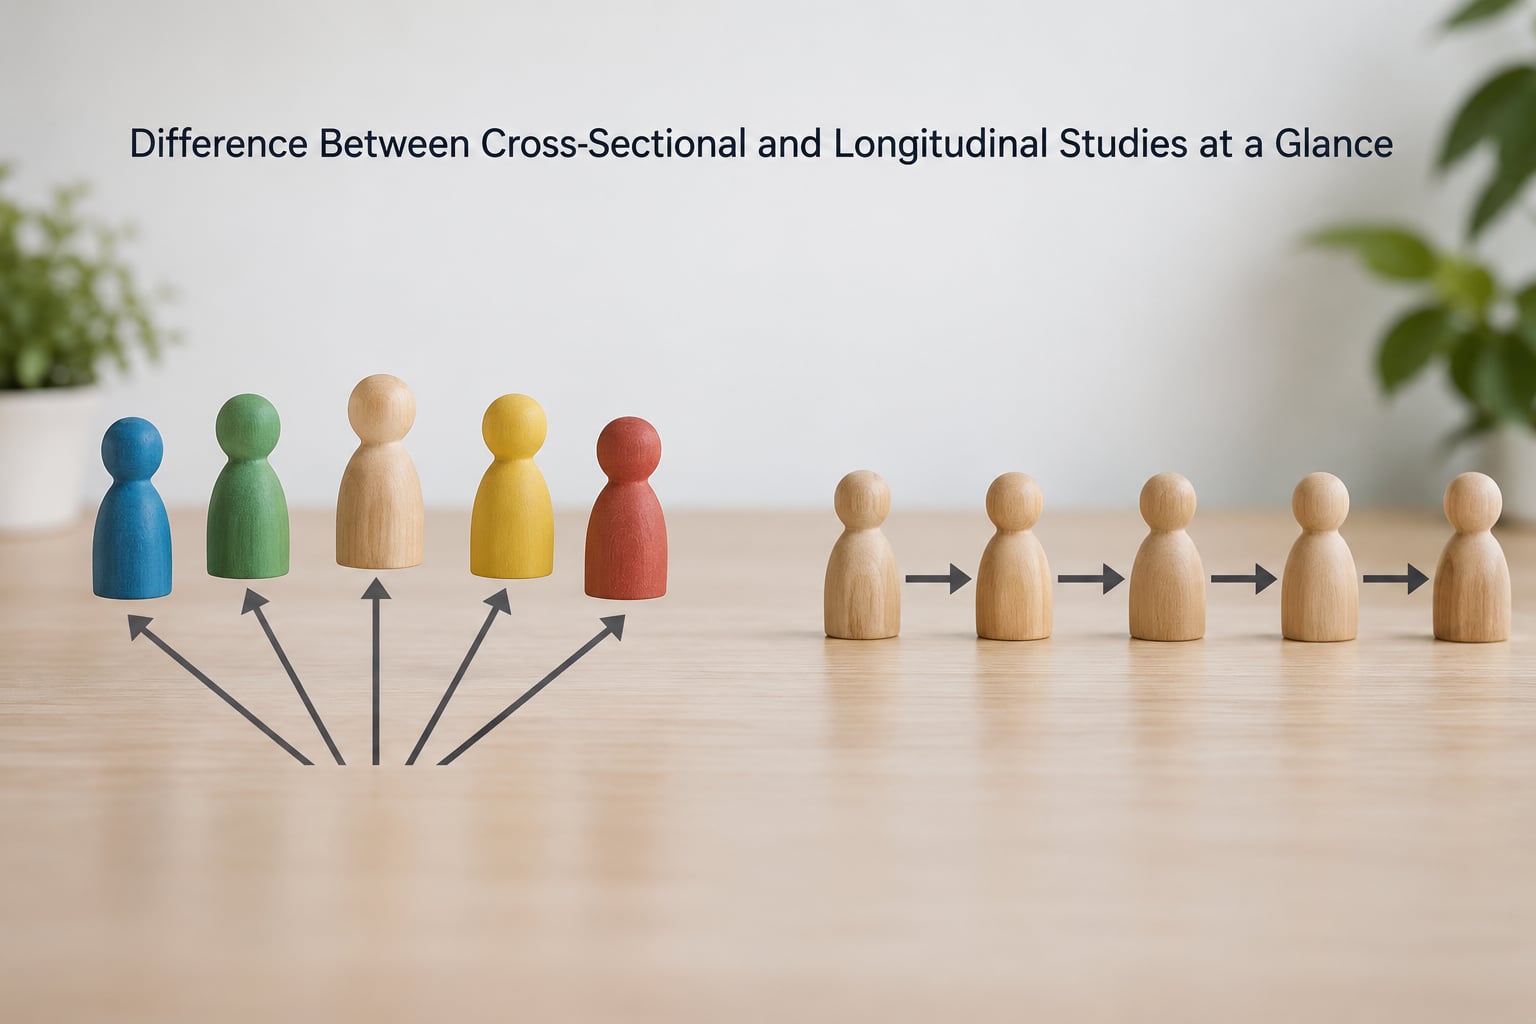
Here is the short version before the detail. Read down the rows and the practical differences become obvious quickly.
| Criterion | Cross-sectional study | Longitudinal study |
|---|---|---|
| Time frame | One measurement occasion, or a short collection window | Two or more occasions spanning weeks to decades |
| Participants | Each person measured once | The same people re-contacted at each wave |
| Analogy | A snapshot | A video recording |
| Time to publish | Months | Years, sometimes decades |
| Direct cost | Relatively low | High, per wave and per retention effort |
| Administrative load | One recruitment and one pass | Repeated recruitment, tracing and retention |
| Attrition | Almost none | Common and the biggest threat to validity |
| Prevalence | Estimated directly | Estimated from cases accumulated over follow-up |
| Incidence | Cannot be measured directly | Measured directly among those initially disease-free |
| Temporal order | Unknown; exposure and outcome are measured together | Known for variables ordered within the follow-up |
| Typical analysis | Chi-square, t-test, ANOVA, correlation, logistic regression | Paired t-test, McNemar, repeated-measures ANOVA, mixed-effects models |
| Data format | One row per person | Long format, one row per person per wave |
| Best for | Describing a population, prevalence, quick screening, comparing groups | Change, development, trajectories, forecasting outcomes |
| Main bias | Cohort and recall bias, cannot separate age from period | Attrition bias, practice effects, secular change |
What Is a Cross-Sectional Study?
A cross-sectional study collects data from a sample of people at one point in time. Everyone is measured once, usually within a few days or weeks, and the analysis compares groups or looks for associations between variables. Nobody is followed afterwards.
The snapshot analogy is the one most textbooks use and it holds up. A photograph of a street tells you what traffic looked like at that moment. It cannot tell you whether the jam formed because of an accident twenty minutes earlier, and it cannot tell you whether the same cars are still there an hour later.
The classic use is prevalence. If you want to know what share of adults in a region meet the criteria for a condition, a one-time survey of a large sample is efficient and hard to argue with. Prevalence studies underpin public health planning precisely because they are fast and stable.
A student example: you survey 200 undergraduates in a single week and compare weekly study hours against reported stress levels, GPA and sleep. You can report that students reporting more than 30 hours of study also report higher average stress. That is a real, publishable finding about association at one moment.
What you cannot do is claim that studying more hours causes stress. The two were measured together, and plenty of other things could explain the pattern, including stress driving studying rather than the reverse.
One disambiguation, because the phrase pulls in off-topic searches: a cross-section also means an anatomical plane, the slice you get when you cut a body part across at one level. A longitudinal section is a cut along the length. That is a completely different meaning of the same words, not a study design.
What Is a Longitudinal Study?
A longitudinal study measures the same participants, or a clearly defined group of them, repeatedly across time. The defining feature is not the length of the study. It is that the same unit is observed more than once, so change within that unit becomes visible.
Think of it as a video recording rather than a photograph. You can see the direction of movement, the pace of it, and whether two things move together or one follows the other.
Named examples help here. The Framingham Heart Study has followed residents of one Massachusetts town since 1948, producing decades of data on cardiovascular risk. The British Cohort Study followed a large sample of people born in 1938 into later life. The Millennium Cohort Study tracked roughly 19,000 children born across Great Britain in 2000 and 2001, following them into adolescence and early adulthood.
A practical student example: the same 40 students complete a motivation questionnaire in week 1, week 6 and week 12, and you also log their attendance and assignment submissions. You can then describe each student’s trajectory, average within-person change, and test whether early motivation predicts later performance. No cross-sectional dataset can tell you that.
Longitudinal designs are not always prospective. A retrospective longitudinal study reconstructs a timeline from existing records, for example following a hospital cohort backward through discharge notes and death registries to compare outcomes by treatment received. The defining feature is still repeated observation of the same units over an ordered time frame.
How Do the Two Designs Collect Data Differently?

Sampling and administration differ so much that the two studies end up looking like different businesses on paper. A cross-sectional project recruits once, surveys once, closes the file. A longitudinal project recruits once and then spends its remaining budget keeping people in the study.
Longitudinal projects live or die by retention systems. You need tracing databases for people who move, reminders with different contact channels, and a plan for people who simply stop replying. Each wave needs a protocol, an instrument that is either identical or deliberately harmonised, and a data dictionary that survives five years of changes in staffing.
Attrition is the practical problem that follows from that. Attrition is the loss of participants between waves, and attrition bias is what happens when the people who leave differ systematically from the people who stay. If the students who drop out of your motivation study are the ones who were already struggling, your remaining sample is quietly healthier than your original one, and your change scores will look artificially positive.
Researchers usually report a retention rate and compare the baseline characteristics of completers and non-completers. That comparison is the honest way to show whether the losses threatened the result, and many journals now ask for it explicitly.
How long a study has to run before it counts as longitudinal is a fair question and people argue about it. A four-week study with two measurement points is still longitudinal, because there are two occasions and the design captures repeated measurement. The label does not expire, but the credibility of the change estimate does depend on whether there is enough time for meaningful change to occur.
Here is a practical method for classifying any study you read. Open the methods section and work through these checks.
- Does the text say when data were collected, as one date or one window? One window means cross-sectional.
- Are the same identifiable participants measured again later? If yes, it is longitudinal.
- Does the analysis compare people against each other at one moment, or does it report change scores and within-person differences?
- Is there a stated follow-up period, and does the paper report how many participants remained at the last wave?
- Does the abstract describe a cohort being followed forward, which implies a longitudinal or cohort design rather than a cross-sectional one?
- Is the instrument described as administered once or at repeated waves? Repeated administration is the giveaway.
That last check settles most ambiguities. Papers that describe a single administration of a survey are cross-sectional, whatever the title of the study or the journal implies.
Which Design Is Better for Measuring Change?
Longitudinal designs are better for measuring change, because change is defined within a person and only repeated measurement can see it directly. Cross-sectional designs compare different people, so what looks like change is often a difference between birth cohorts, age groups or generations rather than a real trajectory.
UK Biobank makes this point forcefully in its work on ageing research. Comparing a 60-year-old sample with a 70-year-old sample in a single survey confounds age with the different historical conditions each cohort grew up in. Education, diet, smoking norms and health systems all differed, so the gap between the groups mixes up getting older with being born in a different era.
That is the cohort effect, and it is the single strongest argument against using cross-sectional data to make claims about how people develop. A longitudinal study follows the same people, so within-person change and between-person difference can be separated in the model.
Cross-sectional data can still approximate change by comparing age groups, and in some fields that approximation is defensible. But when the decision matters, the honest framing is that you are comparing groups, not tracking individuals, and the distinction belongs in your limitations section rather than being quietly dropped.
There is a second advantage to longitudinal data. Incidence, meaning new cases arising over a defined period, can only be measured among people known to be free of the condition at baseline. A single survey tells you how many people have it now, not how many will get it.
Can Either Design Establish Cause and Effect?
No. Neither design is an experiment, so neither can establish cause and effect on its own. A cross-sectional study measures exposure and outcome at the same moment, so the direction of influence is completely unknown. A longitudinal study establishes temporal order, which is necessary for a causal argument but nowhere near sufficient.
Getting the order right removes one specific problem, the reverse-causation problem, where the outcome you are studying is actually driving the exposure. But confounding variables still travel with the participants. A longitudinal study showing that people who exercise more have lower blood pressure cannot separate exercise from diet, income, smoking, age and genetics, all of which correlate with both.
Randomised controlled trials establish causality because the researcher assigns the exposure and holds everything else constant on average. Observational designs cannot do that, no matter how long they run or how many waves they collect. What they can do is establish that the exposure came first, sharpen the hypothesis, and provide the effect estimate that a later trial tests properly.
So the accurate statement is not that longitudinal studies are causal and cross-sectional studies are not. It is that longitudinal designs support a stronger causal argument, and cross-sectional designs support only an associational one. If a methods section claims otherwise, that is a problem with the paper, not with your reading of it.
Which Design Is Easier and Less Expensive?
Cross-sectional studies are easier and cheaper, and that is their main practical argument. One recruitment campaign, one instrument, one pass of data entry. Many well-designed cross-sectional studies are run by a small team inside a single academic year.
Longitudinal studies multiply every cost over the number of waves. You pay for repeated contact, tracing, retention incentives, staff time coordinating each wave, and data management for a dataset that keeps growing. Studies that follow people for decades also carry real risks around consent renewals and data protection, since the people you enrolled may no longer be the people you hold records about.
Data management is the hidden expense. Cross-sectional data is usually one row per person, tidy and easy to check. Longitudinal data is one row per person per wave, and before you analyse anything you spend time reshaping it, writing a codebook that still makes sense two years later, and checking for impossible values like a height that dropped 30 centimetres between waves.
For a student with one year and a fixed budget, that gap usually decides the question. If change is not essential to the answer, a well-sampled cross-sectional study beats a thin longitudinal one. A study with 60 participants measured twice and 30 per cent drop-out is weaker evidence than a study with 400 measured once with solid sampling.
Which Statistical Methods Are Commonly Used?
For cross-sectional data, the analysis depends on how many variables you have and what types they are. Chi-square tests compare two categorical variables. Independent-samples t-tests compare a continuous outcome between two groups, and one-way ANOVA does the same across three or more. Correlation and simple or multiple regression handle continuous variables, while logistic regression predicts a binary outcome such as yes or no.
For longitudinal data the analysis must account for the fact that the same person appears more than once. Ignoring that produces standard errors that are too small and claims that look stronger than they are. The usual tools, in ascending order of flexibility:
- Paired t-test, when you have exactly two waves and one continuous outcome.
- McNemar test, the paired equivalent for a binary outcome at two waves.
- Cochran’s Q, for the same idea across more than two waves with a categorical outcome.
- Repeated-measures ANOVA, which handles a continuous outcome across several waves and assumes sphericity, an assumption that often fails in practice.
- Mixed-effects models, which treat wave as a fixed effect and each person as a random effect, tolerate missing waves, and let you model random slopes and attrition more honestly.
- Generalised estimating equations, which model the correlations between a person’s repeated responses without requiring normally distributed outcomes.
- Growth-curve or latent curve models, when the shape of the trajectory matters more than the average at each wave.
One practical note for SPSS, Stata and R users. Longitudinal data is nearly always stored in long format, one row per person per wave, with a person identifier, a wave variable and a time variable. Your software will need a mixed model with that person identifier as the grouping factor, and in R that usually means the lme4 or nlme packages, in Stata the mixed command, and in SPSS the MIXED procedure. If you find yourself reshaping data repeatedly, that is usually a sign the file is not in long format yet.
What Are the Main Strengths and Limitations?
Cross-sectional designs are strong on speed, cost and the stability of their estimates. Prevalence, population descriptions and screening questions are answered well and quickly. Large samples are affordable, which means better representation of hard-to-reach groups, and there is no drop-out to worry about mid-study because there is no second wave.
Their limitations are structural. Temporal order is unknown, so causal language is off the table. Cohort effects contaminate anything that involves age. Recall bias is common, since people reconstruct past behaviour on the spot, and prevalence studies systematically miss people who died or recovered before the survey, which biases conditions with poor survival rates downward.
Longitudinal designs are strong on everything that requires time. They show within-person change, reveal the order of events, support incident case calculation, and let you test whether an early measure predicts a later one, which is the basis of most screening and forecasting work.
Their limitations are the practical ones. Attrition is the headline problem, and it is worst when it is non-random, because the people who remain are systematically different from those who left. Practice effects contaminate repeated testing, since participants get better at a test simply by taking it three times. Secular change confounds a long window, since the world around participants shifts. And they are expensive and slow enough that a study can become outdated before it publishes.
One clarification worth making explicitly, because it comes up constantly: a cross-sectional study is not a cohort study, even though many secondary summaries describe it that way. A cohort study follows a defined group forward in time, whether prospectively or retrospectively, so it is a longitudinal design by definition. A cross-sectional study samples people at one moment and may follow nobody. Some cross-sectional surveys are drawn from a defined cohort’s members, but the design is still one-wave.
When you need both, a cohort-sequential design overlaps age groups across multiple cohorts with staggered entry points, so change can be estimated faster than a single cohort allows. An accelerated longitudinal design compresses the same idea by measuring the same people at increasingly dense intervals as they age.
Cross-Sectional or Longitudinal: Which Should You Choose?
Choose a cross-sectional study when your question is about a moment. How common is a condition in this population? How do two groups differ on a set of attitudes right now? Which risk factors are associated with an outcome among people who already have it? These questions need one well-drawn sample and nothing more.
Choose a longitudinal study when your question contains a change: how do study habits develop, does early engagement predict final grades, does an intervention reduce symptoms over three months. If the words do or will not do the work, or if you need a direction of influence, you need repeated measures.
A staged approach is common in practice. Researchers often run a cross-sectional study first to establish that an association exists and to identify which variables matter, then escalate to a longitudinal design when the causal and developmental questions demand it. That is a defensible strategy rather than a compromise, as long as the limitations are stated.
Ask two questions before committing. Does my outcome vary meaningfully over the period I can realistically observe? If the answer is no, the extra waves buy you nothing. And can I retain enough participants to keep the final sample usable? Those two answers settle most design decisions faster than any other criteria.
Whichever you pick, plan for the data from day one. Decide the wave schedule, commit to using the same instrument or a harmonised version, budget for retention, and write down in advance how you will handle missing waves. Studies that drift from their own protocol lose far more data through inconsistency than through drop-out.
Frequently Asked Questions
What is the main difference between a cross-sectional and longitudinal study?
A cross-sectional study measures a sample once at a single point in time, while a longitudinal study measures the same participants repeatedly over weeks, months or years. The cross-sectional design gives you a snapshot of a population; the longitudinal design gives you repeated measurements of the same people, which makes within-person change and temporal order visible.
Is a cross-sectional study better than a longitudinal study?
Neither is better in general. A cross-sectional study is the right choice for describing a population, estimating prevalence and testing associations cheaply and quickly. A longitudinal study is the right choice for studying change, development and prediction, but it costs far more and suffers from attrition. Judge the design against your research question, not against the other design.
Can a cross-sectional study measure change over time?
Not directly. A cross-sectional study has only one measurement occasion per person, so it can compare age groups or categories but cannot show how an individual changed. Any apparent change is a difference between different people, which is open to cohort effects where age and birth era are confounded. Reporting that as change is one of the most common errors in weaker studies.
How many participants are needed for a longitudinal study?
There is no fixed number, because it depends on the expected effect size, the number of waves, the correlation between repeated measurements and your expected attrition rate. Power calculations should be done for the specific model you plan to use, such as a mixed-effects model, rather than with a generic sample-size table. Budget for loss: recruit more than you plan to analyse.
Which design is more suitable for a dissertation or thesis?
Whichever one your research question requires, provided you can fund and staff it. Longitudinal designs are usually unsuitable for a short masters project because of the multi-year follow-up they need, unless existing data or a short two-wave window makes them feasible. A strong cross-sectional study with careful sampling and clear limitations is far better than a thin longitudinal one, and supervisors judge reasoning quality heavily.
What are the main disadvantages of longitudinal research?
The main disadvantage is attrition, the loss of participants between waves, which is damaging when the people who leave differ from those who stay. Beyond that, longitudinal work is slow and expensive, needs repeated retention effort, is vulnerable to practice effects from repeated testing, and can take so long that the research question has moved by publication time.
Conclusion
The difference between cross-sectional and longitudinal studies comes down to how many times the same unit gets measured. One time gives you a clear, cheap, representative snapshot and a set of associations. Many times give you change, order and prediction, at the price of money, years and participants you will lose along the way.
Start by writing your research question as a sentence and underlining every word that implies movement. If nothing is underlined, a cross-sectional design will serve you well. If words like develop, predict, improve, persist or precede appear, you need repeated measurements, and you should scope the waves and retention plan before you recruit anyone.