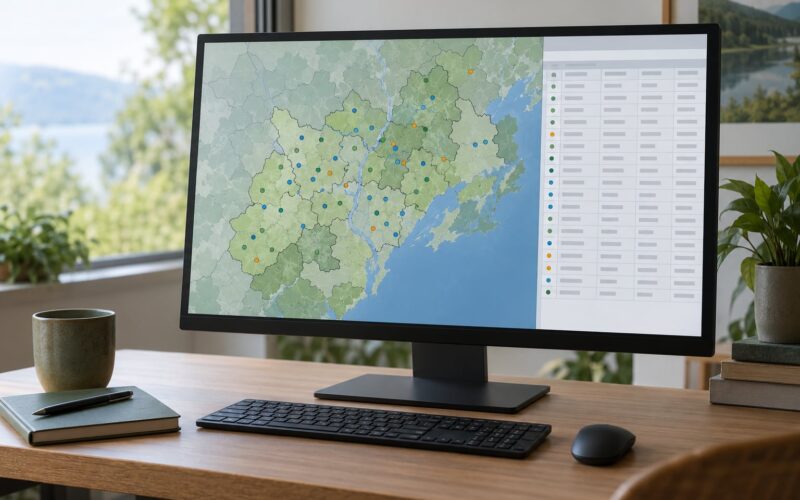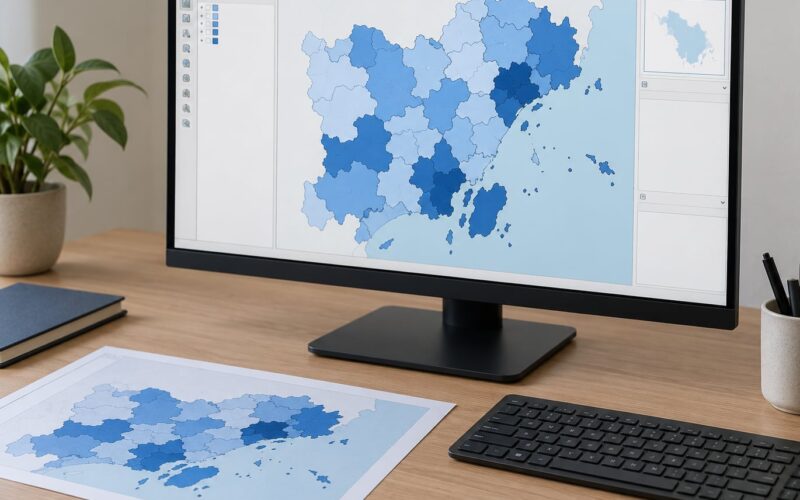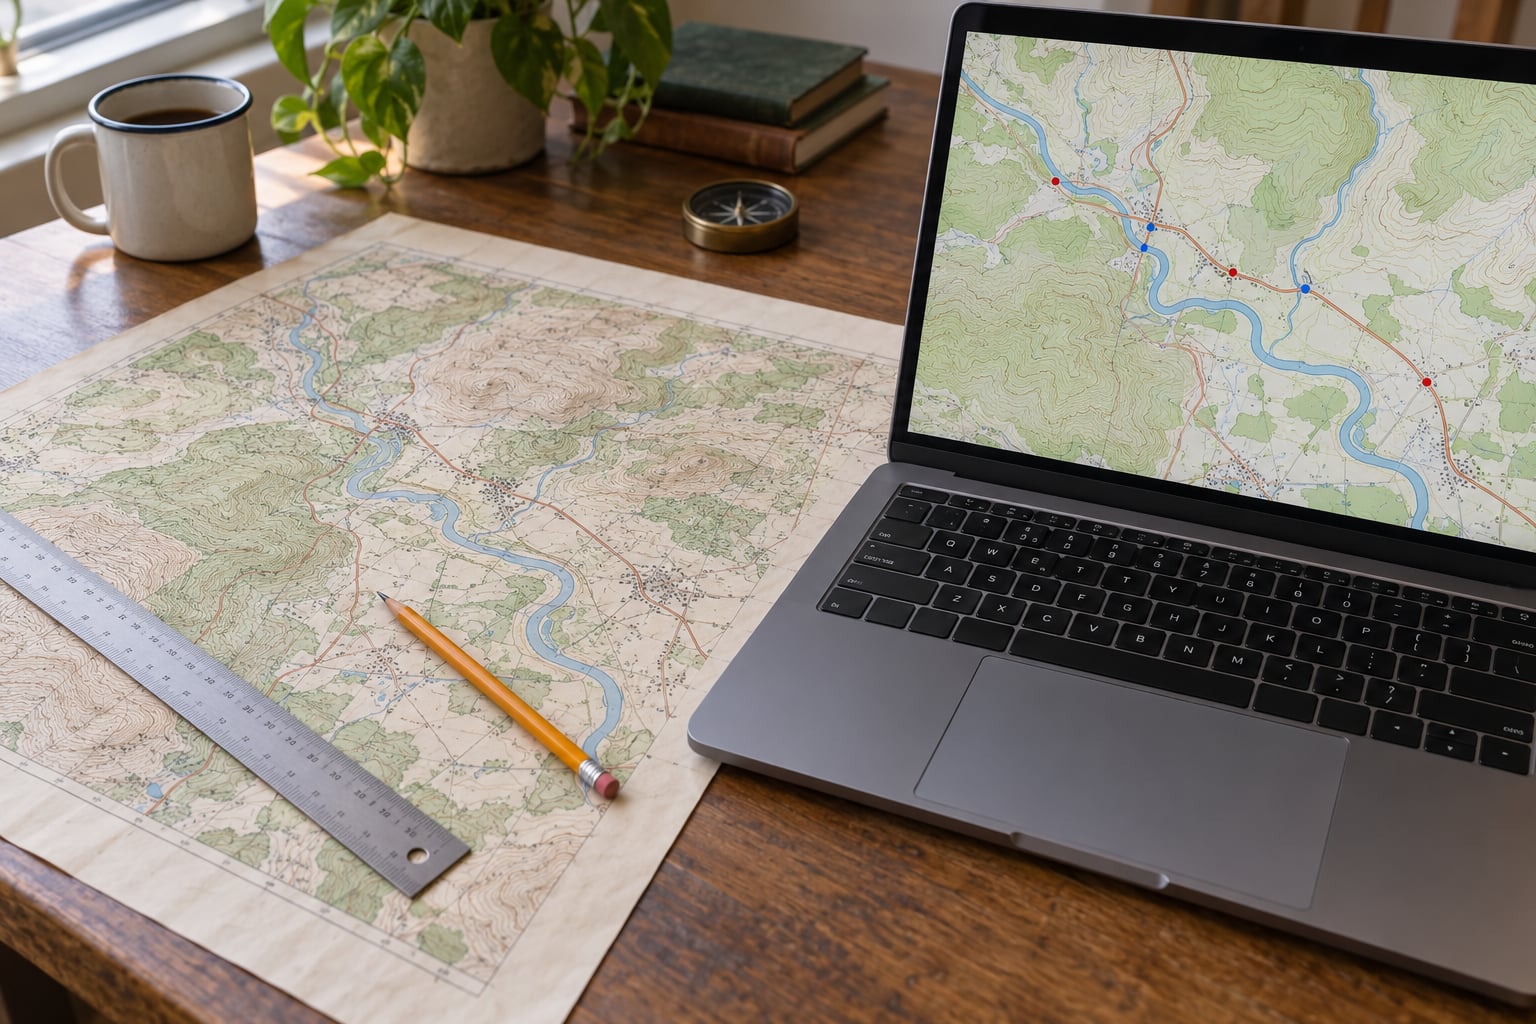
Georeferencing a scanned map means giving a flat picture of a paper map real-world coordinates, so ArcGIS Pro can drop it onto roads, parcels, and elevation layers instead of treating it as a JPEG with pixel addresses. You do it by picking control points you can identify on both the scan and a reference layer, typing in their true coordinates, and running a transformation that warps the image onto a coordinate grid. Budget about half an hour for your first sheet, and do not export anything until you have read the residuals.
The part that trips people up is not the clicking. It is that a georeferenced map can look perfectly plausible and still be rotated, offset, or sitting 200 metres off, and you only find out when the overlay fails. So this walkthrough spends as much time on verification as on the workflow itself.
The steps below target ArcGIS Pro 2.x and 3.x on Windows. Menu names in Pro 3.x place Georeferencing on the Map ribbon; in 2.x it lives under Insert. QGIS does the same job with the Georeferencer dialog under Raster, and both tools use the same logic, so the control point and residual concepts transfer directly.
Table of Contents
- 1What You Need
- 2How to georeference a scanned map three ways
- 3What to have open before you start
- 4Step-by-Step: How to Georeference a Scanned Map in ArcGIS Pro
- 5Prepare and Load the Scanned Map
- 6Set the Source Coordinate System
- 7Choose Control Points and Enter Coordinates
- 8Run the Transformation and Review the Warp
- 9Check Residuals and Refine the Registration
- 10Save or Export the Georeferenced Map
- 11Common Mistakes and How to Fix Them
- 12Tips for a More Accurate Result
- 13Frequently Asked Questions
- 14What is the best software for georeferencing a scanned map?
- 15How many control points do I need to georeference a map?
- 16What RMS error is acceptable for a georeferenced map?
- 17What is the difference between georeferencing and assigning a projection?
- 18Can I georeference a historical map whose projection is unknown?
- 19How do I export a georeferenced scanned map from ArcGIS Pro?
- 20Conclusion
What You Need
Four things make this workflow smooth: the scan itself, some idea of the coordinate system the paper map was drawn in, a reference layer covering the same ground, and a version of ArcGIS Pro you can open a map in. None of them are optional, and the second one is where most failures start.
How to georeference a scanned map three ways
There are three genuinely different operations, and mixing them up is the single most common cause of a map that will not line up.
- Assigning a projection simply declares that the image’s existing pixel grid corresponds to a coordinate system. It is one click, it warps nothing, and it is only correct if the scan is already perfectly north-up and evenly scaled. For a folded, photographed, or photocopied paper map it will be subtly wrong.
- Georeferencing by coordinates is the real workflow: you supply pairs of image locations and true x/y values, and ArcGIS Pro computes the transformation between them. This is what this article covers.
- Georeferencing from a data frame means the source raster already has georeferencing information stored with it, and you are adding points to adjust it rather than starting from nothing. ArcGIS Pro calls this updating an existing georeference, and the Georeferencing workspace opens differently when the raster carries spatial metadata.
What to have open before you start
- The scan, at full resolution. Export the largest version your archive offers, usually TIFF or PNG. JPEG compression smears the thin black lines that make a road intersection findable, and it smears the control point itself.
- The source coordinate system of the paper map. Check the map margin for a projection name, an EPSG code, or a graticule labelled in degrees or metres. A 1:25,000 topographic sheet from a national mapping agency will usually name its projection and zone somewhere on the sheet.
- A reference layer for the same area, georeferenced and correct. OpenStreetMap basemap tiles, a national topographic basemap, or any existing vector layer with roads and boundaries will do.
- Coordinates for your control points, from a gazetteer, a control point table published with the map series, or your own field GPS readings.
Step-by-Step: How to Georeference a Scanned Map in ArcGIS Pro
Prepare and Load the Scanned Map
Make a working copy first. Georeferencing writes new files next to the raster, and if you point the tool at your only copy of a 200 MB archival scan, you have made a problem for yourself. Copy it into your project folder, keep the original untouched, and work on the copy.
Add it to a map, then decide whether to crop. Excess white scanner margin and the plastic sleeve edge in the corner are common and are safe to trim, because they contain no geographic content. Do not trim the map neat line, the grid ticks, or the corner registration marks, since those are frequently your best control points. Cropping is worth doing mainly because it shrinks the file and speeds up every step that follows.
If your source is a PDF rather than an image, you have two options. Export a page to PNG or TIFF at 300 dpi from any PDF reader or from ArcGIS Pro’s Export Map, then georeference the raster. Or open the PDF directly and georeference it as a PDF, which Pro supports but which behaves unpredictably with vector-heavy map sheets. Raster first is the safer route for archival material.
Set the Source Coordinate System
On the Map ribbon, open Georeferencing. ArcGIS Pro adds a Georeferencing ribbon and a Georeferencing pane. The first thing it asks for is which raster you are working on, then it shows a Coordinate System box reading Unknown until you set it.
Set that box to the coordinate system the paper map was drawn in, not the one you would like to work in. If the sheet is a UTM sheet for the appropriate zone, set it to that WGS 1984 UTM zone. If the map is printed in unprojected latitude and longitude, set it to WGS 1984 geographic, EPSG 4326. Get this wrong and every point you enter will be interpreted as being somewhere else entirely, which is the leading cause of the problem people describe as my map is not mapping.
There are three related fields here and they are easy to confuse. The source coordinate system describes the paper map. The horizontal coordinate system is the planar x/y grid you type values into when your points come from a projected source. The geographic coordinate system describes the output, and for most work you set it to WGS 1984. If your paper map names its own projection in a non-standard form, a historical projection, you may need to build that coordinate system by hand rather than picking it from the list.
Choose Control Points and Enter Coordinates
A control point is a single spot you can pin down in two places: on the scanned image, and in the real world with a known coordinate. The tool then learns what the relationship is between the two.
Good candidates are grid line intersections where a labelled meridian and parallel cross, sharp road crossings, railway junctions, bridge abutments, river mouths, and distinctive coastlines. Small, hard, unambiguous shapes work best. Avoid large cities, since a city symbol spans hundreds of pixels and any point you pick inside it is probably wrong by a long way. Also avoid rivers that have moved since the map was drawn, text labels, and boundaries drawn as a fuzzy line rather than a hard edge.
Distribution matters more than count. Four points in a tight cluster in one corner of the sheet will produce a warped, twisted result no matter how low the residual looks. Spread points so they surround the features you care about, roughly at the corners and across the middle.
Add points with Add Control Points, click the exact spot on the image, then type the X and Y in the pane. ArcGIS Pro expects map units, so a projected source wants easting first and northing second, and a geographic source wants longitude first and latitude second. Getting that order backwards is the second most common failure, and it usually shows up as a map reflected across the equator or spun 180 degrees.
A workable starting count: four points for an affine fit, six or more for a polynomial, and ten to fifteen well-spread points for a thin plate spline on a historical sheet that has stretched unevenly.
Run the Transformation and Review the Warp
Open Transformation settings in the Georeferencing pane. For an undistorted modern scan, Polynomial 1st Order (affine) or Projective is enough. For a paper map that has warped between printing and scanning, Thin Plate Spline bends locally and usually wins, given enough points.
Set the resampling method at the same time. Nearest Neighbour preserves the exact pixel values and keeps lines crisp, which matters if you plan to digitize or run classification. Cubic Convolution or Bilinear smooths the image and looks better on screen but invents values between pixels. For analytical work, stay with Nearest Neighbour.
Set an output raster name, then press Start Georeferencing or Apply. A preview of the warped image appears behind your reference layers. That preview is the moment of truth: coastlines, road junctions, and river bends should sit on top of their modern equivalents, and the error should grow gradually toward the sheet edges rather than swinging wildly.
Check Residuals and Refine the Registration
The numbers behind that visual check are the residuals, and they are the part most tutorials skip.
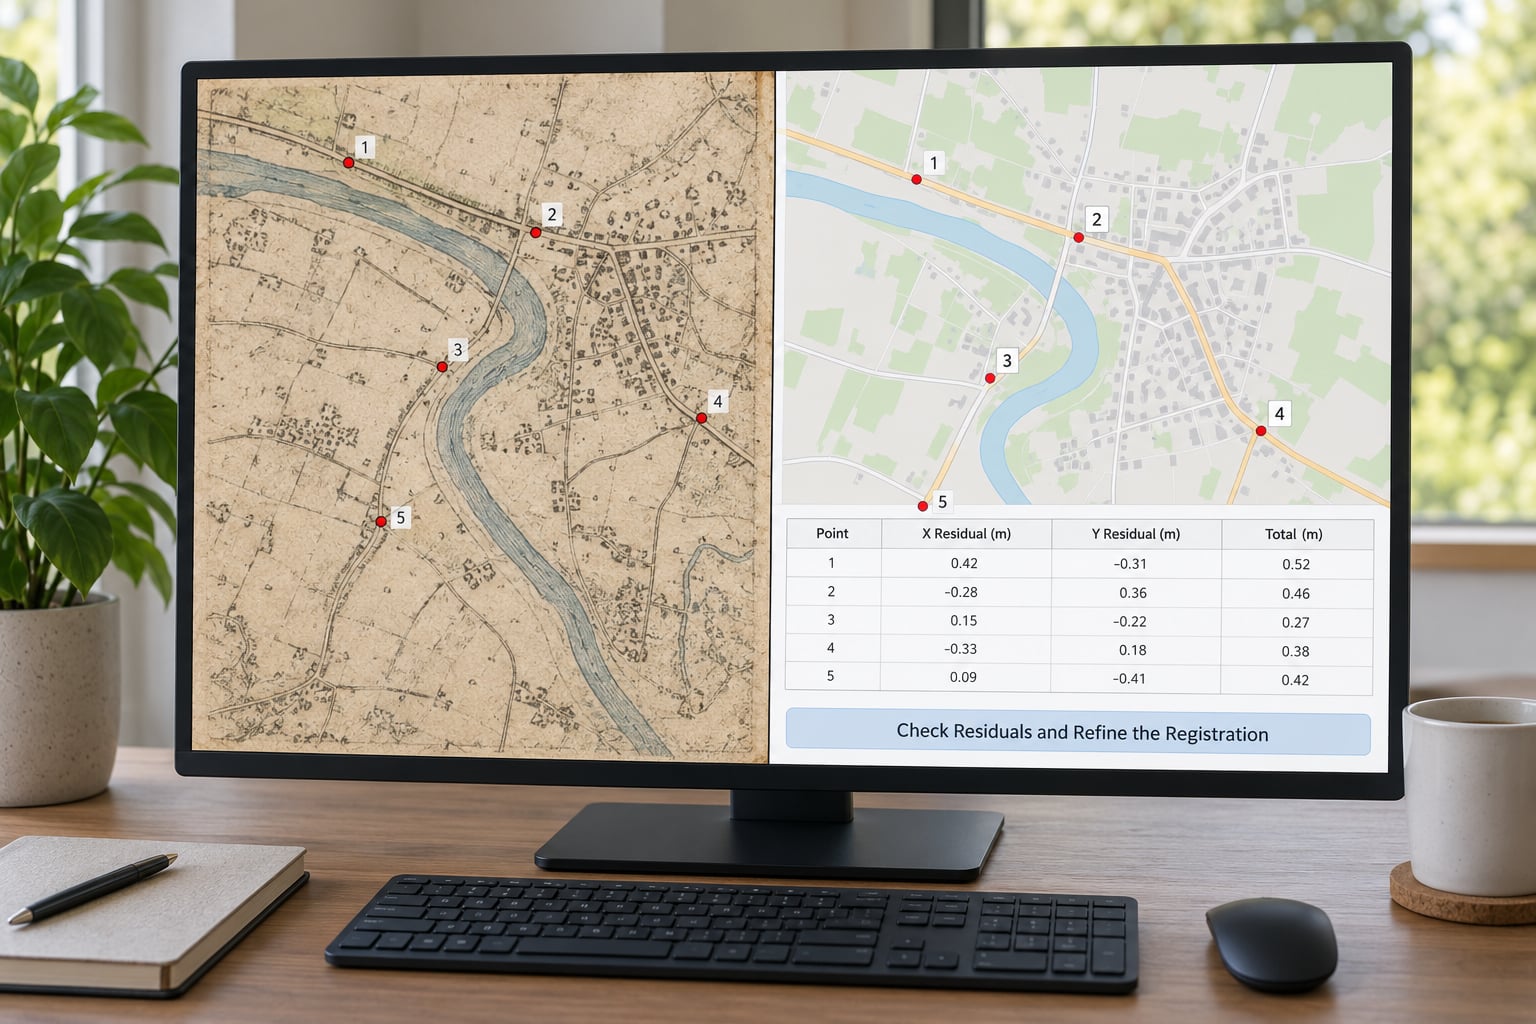
Each control point gets a residual: the distance, in map units, between where you placed it on the scan and where the fitted transformation says it should be. The total RMS error is the summary statistic, and it is the number to watch when you compare transformations or judge whether the sheet is good enough for your purpose.
A total RMS error in the low single-digit metres is excellent for most scanned paper maps. Under roughly one pixel of the source scan is the theoretical floor, and for a 300 dpi A0 sheet that is a few centimetres. Anything in the tens of metres means something is structurally wrong, not merely imprecise.
Read it against map scale, because the right number depends on what you are doing. For a 1:250,000 overview map, tens of metres of error is invisible and harmless. For a 1:5,000 sheet you plan to digitize parcels from, you want errors you could not see at full zoom, and that is a different, tighter standard.
When a residual is large, look at that point before deleting it. If it sits far from all the others, you probably mis-clicked, so re-place it. If it is off systematically, you may have the source projection wrong. Delete and re-add with better coordinates, then re-run, and compare the total RMS error each time.
Save or Export the Georeferenced Map
Use Save Georeferencing in the Georeferencing pane to store the transformation with the raster, so you can reopen and refine it later without redoing the points. Keep that alongside your original scan and a short note of where the coordinates came from.
Then export through Export Map, or use Save As with the output raster path set in the georeferencing pane. A GeoTIFF with an embedded coordinate system is the safe default: it travels between software without splitting into a raster and a world file, and it carries the CRS with it.
On the export dialog, set the output cell size to match your source scan or to the ground resolution you actually need. Larger cells discard detail you paid for; smaller ones do not add information back. Use compression to keep file sizes manageable, but note that heavy JPEG compression on a GeoTIFF will reintroduce exactly the artifacts that made control points hard to place in the first place.
Confirm the horizontal coordinate system listed on the export matches what you intended, then open the finished file on its own, with the reference layer, and check the corners as well as the centre. Sheets frequently look fine in the middle and drift badly at the edges.
Common Mistakes and How to Fix Them
Almost every failed georeference is one of these seven. Find your symptom, check the cause, apply the fix, and run the residuals again.
| Symptom | Likely cause | Fix |
|---|---|---|
| Map lands far from the right place, or mirrored | X and Y entered backwards, or latitude and longitude typed into a projected source | Swap the values, or switch the coordinate format in the pane to match your source system |
| Map is rotated or skewed at one corner | Control points clustered in one area of the sheet | Add points at the remaining corners and across the middle, then re-run |
| Residuals stay high no matter what you change | Wrong source coordinate system | Re-read the map margin; set the source CRS to what the paper map actually used |
| One point has a huge residual, the rest are small | Mis-clicked, or a control point on a feature that moved (meandering river, relocated road) | Delete the point and re-place it on a fixed feature |
| Output has wide black or empty borders | Scan includes margins outside the mapped area, and no transparency or clipping applied | Crop the scan, or export with a No Data value set to zero so edges render transparent |
| Lines look jagged and broken after warping | Resampling method set to Nearest Neighbour on a display-only output | Keep Nearest Neighbour for analysis; use Bilinear or Cubic for a viewing copy |
| Update Georeferencing appears to do nothing | Stale georeferencing sidecar files holding an older transform | Close the app, delete the associated georeferencing files, and start the workspace again |
Tips for a More Accurate Result
Most of the quality lives in decisions you make before you click anything. Scan at the highest resolution the archive offers, and work from a lossless format rather than a JPEG. Write down the paper map’s projection the moment you identify it, while the map sheet is in front of you.
Use a reference layer that is itself trustworthy, and check it. A basemap that is itself misaligned will send your residuals in circles. Prefer a layer from the same national mapping agency that produced the sheet where you can.
Pay attention to the sheet edges. If the corners disagree but the centre is tight, your transformation is too rigid for a sheet that has stretched. Move up to a thin plate spline and add points near the edges before you add more anywhere else.
Do not rotate, stretch, or clean up the scan during processing. Editing pixels changes the relationship between your control points and the image, and the transformation you fit no longer describes the file. If you must clean stains or fold lines, do it in a separate copy and georeference that deliberately.
Finally, document what you did: control point sources, transformation type, total RMS error, output resolution, and the CRS. Six months later, when someone asks why your digitized boundary sits two metres off the modern parcel layer, your notes are the only thing that answers it.
Frequently Asked Questions
What is the best software for georeferencing a scanned map?
QGIS is the strongest free option, with its Georeferencer dialog under Raster and no install cost. ArcGIS Pro is the better choice if your organization already licenses it, mainly because of its live basemap and integrated editing. Online tools such as mapwarper.net work for a quick single map but give you less control over transformation settings and residuals.
How many control points do I need to georeference a map?
Four well-spread points is the practical minimum for an affine or first-order polynomial fit. Use six or more for higher-order polynomials, and ten to fifteen for a thin plate spline on a historical sheet that has distorted unevenly. Distribution beats quantity every time: points spread across the corners and centre of the sheet will beat six points in one corner.
What RMS error is acceptable for a georeferenced map?
A total RMS error in the low single-digit metres suits most scanned paper maps, and staying under one source pixel is close to the theoretical best you can achieve. For a small-scale overview map at 1:250,000, errors of tens of metres are invisible and harmless. Digitizing parcels from a 1:5,000 sheet demands a far tighter figure, so judge against your map scale.
What is the difference between georeferencing and assigning a projection?
Assigning a projection only declares which coordinate system the raster already follows, and it warps nothing. Georeferencing uses pairs of known coordinates and image locations to compute and apply a transformation that actually moves, rotates, and stretches the pixels. Assigning a projection is correct only for an image that is already perfectly north-up and evenly scaled.
Can I georeference a historical map whose projection is unknown?
Yes, often accurately, because the georeferencer does not need to know the paper map’s projection in advance. You set the source coordinate system to your best guess, distribute plenty of control points, and let the residuals tell you whether the guess was wrong. If it was, try a neighbouring projection and see whether the total RMS error drops noticeably.
How do I export a georeferenced scanned map from ArcGIS Pro?
Set the output raster path in the Georeferencing pane, then use Save Georeferencing to store the transformation with the source file, and Export Map to write the corrected raster. Choose GeoTIFF with an embedded coordinate system so the CRS travels with the image. Set your cell size to match the source scan and open the result separately to check the corners.
Conclusion
Start by finding out what coordinate system the paper map was drawn in, because every control point you enter afterwards depends on that answer. Then place your points across the whole sheet rather than in one corner, run the transformation, and read the residuals before you believe anything on screen.
And keep the reminder in proportion: georeferencing lines up the map you already have. It cannot recover coastline detail the scanner missed, un-stretch a badly photographed sheet, or make a map drawn before accurate surveying trustworthy at parcel level. Match your effort to what the map can actually support.