To track your analysis steps for reproducibility, you record each decision as you make it: script every transformation, keep a written log of the reason behind each cleaning or exclusion choice, commit each change to version control with a message that explains the change, and capture the environment (random seeds, software and package versions) so the same code produces the same numbers later. Most of this takes an hour to set up properly, and it pays off the first time a reviewer asks where a table came from.
The awkward part is rarely the scripting. It is the why. You can rerun a do-file, but if nobody wrote down why 412 cases were dropped or why a variable was recoded from 1-5 into 1-3, the rerun reproduces the numbers without reproducing the reasoning — and you are back to guessing.
Table of Contents
- 1What You Need
- 2Step-by-Step
- 31. Create a project folder before starting
- 42. Record the research question and analysis plan
- 53. Preserve the original data and document preparation
- 64. Save the exact software commands or code
- 75. Track every analytical decision and change
- 86. Save and interpret each output
- 97. Run a reproducibility check before submission
- 108. Package the analysis for later use
- 11Common Mistakes
- 12Frequently Asked Questions
- 13What is reproducibility in research?
- 14What is the difference between reproducibility and replicability?
- 15How do I document my data cleaning steps?
- 16Should I use Git for my thesis or a small analysis?
- 17Do I need a log file for my analysis if I already use a script?
- 18What should I do when my results change between reruns?
What You Need

You need five things, and four of them are free. None of this requires a large compute budget or a particular programming language.
- Untouched source data. A read-only copy of the file exactly as the instrument or agency delivered it, plus a record of where it came from and when it arrived.
- A project folder with a fixed structure. Somewhere to keep raw data, intermediate files, scripts, output, documentation and the write-up separate from each other.
- Something that executes your steps. That is an SPSS syntax file, a Stata do-file, an R script or notebook, or for menu-driven work, a written record of every click path.
- A decision log. A plain text file, spreadsheet or document where each entry holds the action, the reason, the input file, the output file and the date.
- A history mechanism. Version control such as Git is the strongest option, but the platform’s own file history, dated backups, or a changelog work too if you use them consistently.
The data dictionary is worth building early because it forces you to write down variable names and codes while they are still obvious to you. Six months on, they are not.
Step-by-Step
1. Create a project folder before starting
Set up the folder structure in the first hour of the project, not the last week. A workable layout keeps five categories apart: raw data, intermediate data, scripts or code, output (tables, figures, diagnostics), and documentation including the log, the codebook and the README.
Use file names that sort in a useful order and carry a date, such as 2026-02-14_cleaned_survey_v2.csv. A name that only says final_final2 tells the next person nothing about which version produced Figure 3.
Keep raw data in a subfolder that you never write to. Analysis code reads from raw and writes to everything else.
2. Record the research question and analysis plan
Write down the research question, the variables involved, the intended tests, the assumptions you expect to check, the exclusion rules and the outputs you expect to produce. This takes half an hour and it becomes the reference you compare against later.
The plan is what makes deviations visible. When your actual analysis differs from the plan, you can say so explicitly rather than quietly drifting. Researchers on forums describe this as the practical difference between a defensible analysis and one that looks improvised.
3. Preserve the original data and document preparation
Cleaning and normalization means converting the file into a consistent, analysis-ready form: consistent variable names, consistent coding for categories, no duplicate records, missing values marked in one agreed way rather than five, and units that match the codebook.
Never edit the raw file. Create a processed copy and save a dated version after each meaningful stage, so cleaned_v1 and cleaned_v2 both still exist. Log every recoding as a line: what you changed, from what to what, and why.
Keep intermediate files. They cost very little storage and they let you rerun one late stage without rebuilding everything upstream.
4. Save the exact software commands or code
The point of a script is that the analysis can be rerun without reconstructing menu choices from memory. In practice that means an SPSS syntax file, a Stata do-file, an R script or an R Markdown or Quarto document.
Write comments inside the file that explain what a block does and what it expects to find. A header comment naming the author, the date and the input file saves the next person a lot of guessing.
One habit worth building early: use relative file paths rather than an absolute path tied to your own machine. A hard-coded path works perfectly for you and breaks instantly for everyone else, including you after a laptop refresh.
5. Track every analytical decision and change
Record two things for every step: what you did, and why. The what is easy. The why is the part that makes the log useful, and it is the part people skip.
A practical entry format that fits in a spreadsheet:
| Field | Why it matters | Example entry |
|---|---|---|
| Step number | Ties the log entry to the script and the output file | Step 14 |
| Date | Orders entries and shows the pace of the analysis | 2026-02-14 |
| Purpose | One line on what this step is for | Build the composite wellbeing scale |
| Input file | Lets you start the rerun from the right place | data/2026-02-10_cleaned_v2.csv |
| Action taken | The transformation, in specific terms | Mean of items 4, 7, 9, recoded 1-5 to 0-100 |
| Reason | The judgment call, written for someone who was not there | Items worded in reverse; reversed before averaging per the scale manual |
| Tool and version | Explains version-specific output differences | R 4.3.2, dplyr 1.1.4 |
| Seed or settings | Makes random procedures repeatable | set.seed(20260214) |
| Output file | Connects the result back to the step that made it | output/table3_wellbeing.csv |
Apply the same format to exclusions. “Removed 412 cases” is an action; “removed 412 cases with more than 10% missing on any item, per the exclusion rule set in the pre-registration” is a record you can defend months later.
6. Save and interpret each output
Give every table, figure, diagnostic and model output a name, a date and a home in the output folder, and store it next to the command that produced it. Paste the command reference into the file name or a small header.
Then write the interpretation. Two or three lines per key output: what the result means, whether it is what you expected, and which decision it changed. Outputs with no recorded meaning are the ones you end up re-deriving from scratch.
This is also the step where you log the assumption checks — residuals, collinearity, normality, missingness patterns — and what you concluded from each one.
7. Run a reproducibility check before submission
A rerun on your own machine can succeed while the record is still broken, because you fill in the gaps from memory. So test it the hard way: start from the preserved raw file, on a clean session, using only what is written down.
Work through this checklist:
- Delete or move every intermediate and output file, leaving only raw data, code and documentation.
- Run the complete script end to end, without fixing anything mid-run. Note every error instead of patching it silently.
- Compare the new outputs to the originals, number by number, and record the differences rather than assuming they are rounding.
- Confirm that random procedures use a recorded seed and that the same software and package versions are stated.
- Check that no step depends on a file sitting in a personal folder or on a setting you changed by hand outside the script.
- Fix each discrepancy at its source, then run the whole thing again from the top.
Document the check itself: date, machine, software versions, outcome. A clean rerun is a result you can report.
8. Package the analysis for later use
Finish with a README that someone could follow without you in the room. It should name the software and versions, list the files and how they relate, state the order of execution, summarize the key decisions and their reasons, flag known limitations, and say who to contact with questions.
Include the data dictionary and the decision log in the same package. For anything you intend to share publicly, deposit it in a repository that mints a persistent identifier, and add a licence file so others know what they may do with it.
If the data cannot be shared because it is sensitive or confidential, say so explicitly in the README and describe the access procedure instead. A reader can work with a clear statement; they cannot work with silence.
Common Mistakes
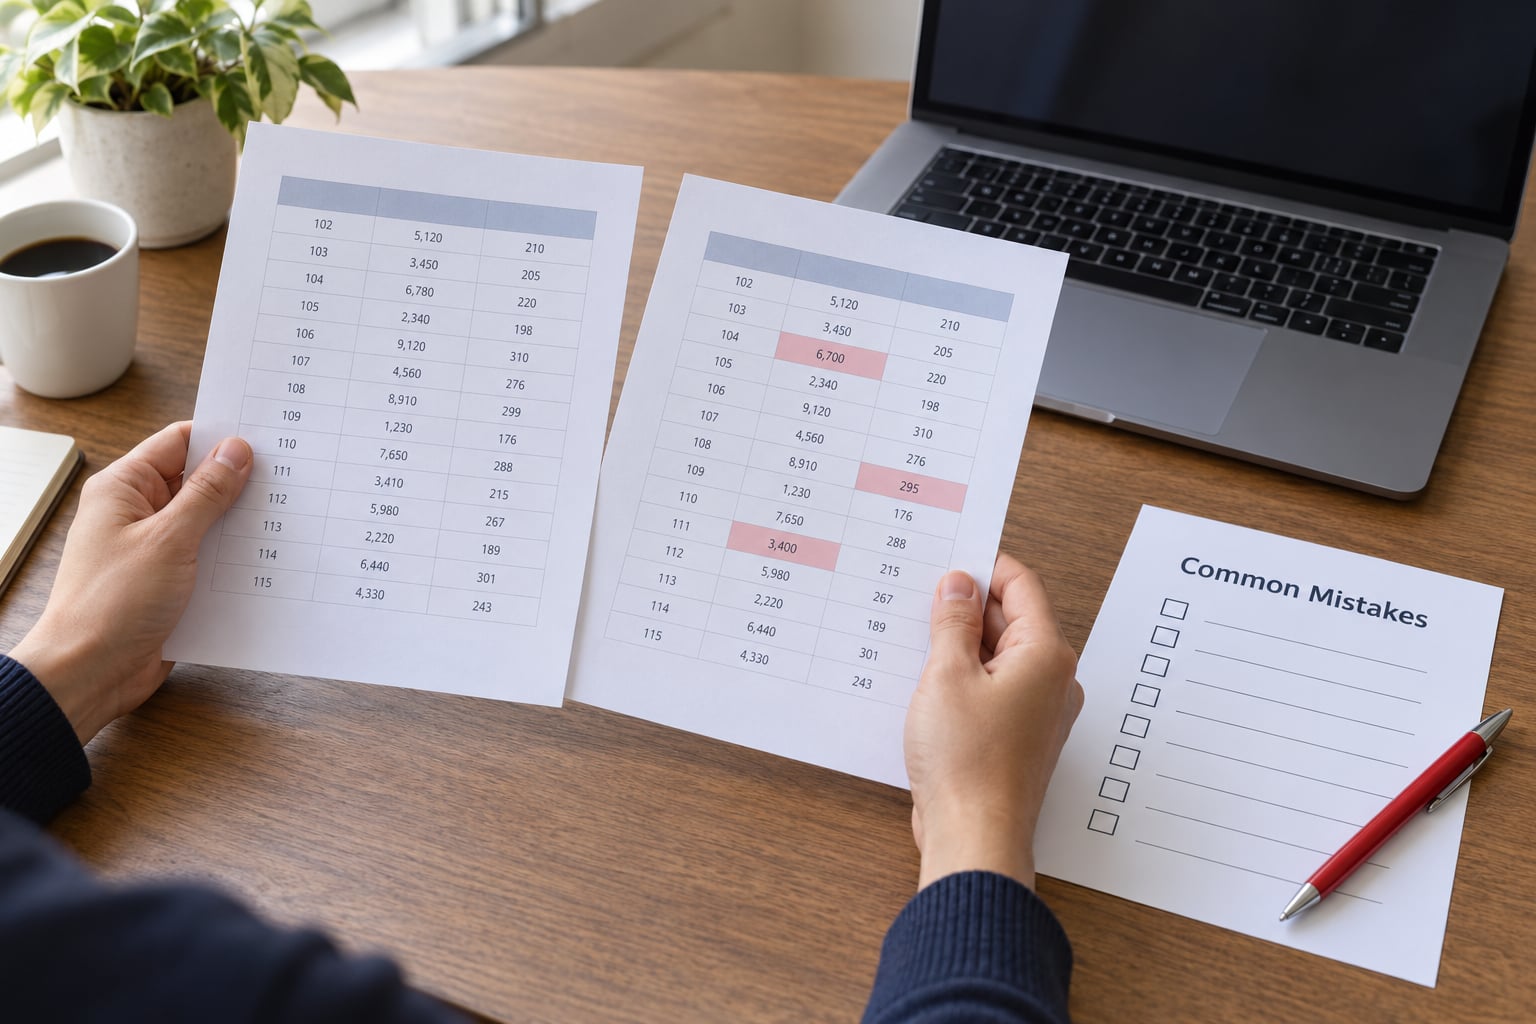
Almost every reproducibility problem I see traces back to one of a handful of habits, and each has a straightforward fix.
Overwriting the raw data. Once the original is gone, nothing downstream can be checked. Fix: keep raw read-only, and save a dated processed copy after each stage.
Undocumented recoding. A transformation appears in the code but not in the log, so nobody can tell whether it was a correction or a convenience. Fix: the reason field is not optional.
Relying on point-and-click work. Menu choices leave no record, and a sequence of them cannot be replayed. Fix: when you cannot script a step, write down the exact menu path, the options selected and the output produced, then re-enter it as syntax or a do-file command as soon as you can.
Vague file names. analysis_final creates ambiguity that surfaces at the worst possible moment. Fix: name, date and version every output.
Skipping software versions. This one catches experienced researchers. Package and language upgrades can quietly change results — a seeded bootstrap in R, for example, has broken for people whose script and seed were both unchanged, because the way the seed is generated changed between versions. Fix: record versions, and capture environment details with the session information your software provides, or a lockfile for the packages you use.
Never verifying the rerun. Documentation that has not been tested is a hypothesis. Fix: run the seven-point check above, from a clean state, at least once before you submit or hand the project over.
Adopting everything at once. Trying to install Git, a workflow manager, a container stack and a repository on the same afternoon leads to abandonment. Fix: adopt in order. Write the decision log first, script one stage, add commits when the habit is stable, then capture the environment. Each layer pays for the next.
One last test for whether the record is good enough: give it to a competent colleague who has never seen the project and ask them to rerun it. Where they stop and message you, that’s the missing documentation.
Frequently Asked Questions
What is reproducibility in research?
Reproducibility in research means that the same data and the same documented steps produce the same results, whether the person rerunning the analysis is you or a colleague. It is a property of the workflow rather than of the finding: an untracked analysis that happens to give the right answer is not reproducible, because nobody can demonstrate how the answer was reached.
What is the difference between reproducibility and replicability?
Reproducibility reruns the original study’s analysis with the original data, so the numbers should match exactly. Replicability repeats the study’s procedures with new data collected separately, so the numbers will differ but the underlying pattern should hold. A third term, repeatability, describes getting consistent results from the same data under the same conditions in a short window.
How do I document my data cleaning steps?
Keep raw data unchanged, save a dated processed copy after each stage, and log every cleaning action as a line containing the input file, the action, the reason, the tool and version, and the output file. Write the reason in full sentences aimed at someone who was not in the room. A log of actions alone lets you rerun the cleaning; a log with reasons lets someone judge whether the cleaning was appropriate.
Should I use Git for my thesis or a small analysis?
Git is a good fit once your analysis involves scripts and more than one version, and it gives you a dated history with a diff showing exactly what changed. For a small or menu-driven project, a dated folder of syntax files plus a written decision log gets you most of the value with far less setup. The important part is a consistent history, not the specific tool.
Do I need a log file for my analysis if I already use a script?
A script records what you did, including the reasoning you typed as comments, but it does not record decisions you never wrote down, and it loses context once the project is large. A separate decision log is worth keeping because it holds the excluded cases, the judgment calls, the abandoned approaches and the reasons, in a form you can read without reading code. Many groups keep both.
What should I do when my results change between reruns?
Do not patch the output. Work backwards from the difference: check the software and package versions first, then confirm the random seed and the working directory, then look for anything that was changed by hand outside the script. Once you find the cause, note it in the decision log and fix the script rather than the number, because the person who reads your work will be checking your process rather than your figures.
Start with the decision log today, before the next cleaning step, and add one line each time you make a judgment call. Everything else in this guide — the scripts, the commits, the rerun check — is easier to maintain once the habit of writing down the reason is already there.