
To run a Kruskal Wallis test in SPSS, open Analyze > Nonparametric Tests > 2 Independent Samples in current IBM SPSS Statistics releases, or Analyze > Nonparametric Tests > Legacy Dialogs > 1 Independent Samples (K Independent Samples) in older ones. Both routes produce the Kruskal-Wallis H test, but only the modern dialog adds pairwise post hoc comparisons.
The Kruskal-Wallis test is the non-parametric alternative to a one-way ANOVA. It ranks every case across all groups combined, works out the average rank within each group, and tests whether those mean ranks differ more than chance would explain. You need it whenever you have three or more independent groups and an outcome that is ordinal, skewed, or full of outliers. Most students first meet it with Likert survey responses split by something like year group, site, or condition.
A quick version note before we start. The Independent Samples dialog arrived with SPSS Statistics 18, so any screenshot you find online labelled “Legacy Dialogs” comes from an older release or a tutorial aimed at a different interface. Both are still in current versions, which is why menus have moved and students get stuck. If your dialog looks different from the ones described here, check the release number in Help > About.
Table of Contents
- 1What You Need Before You Run a Kruskal-Wallis Test in SPSS
- 2How to Run a Kruskal-Wallis Test in SPSS: Step-by-Step
- 31. Check and prepare your data
- 42. Open the Kruskal-Wallis test dialog
- 53. Assign the test and group variables
- 64. Run the test and locate the output
- 75. Interpret the significance value
- 86. Identify which groups differ
- 97. How to Report a Kruskal-Wallis Result for Your Paper
- 10Common Mistakes When Running a Kruskal-Wallis Test in SPSS
- 11Frequently Asked Questions
- 12Can I run a Kruskal-Wallis test in SPSS for two groups?
- 13How do I know whether the Kruskal-Wallis result is significant?
- 14What should I do when the Kruskal-Wallis test is significant?
- 15Does Kruskal-Wallis require normally distributed data?
- 16Why does SPSS show a different number of valid cases than my dataset?
- 17Can I test the same people across more than two conditions with Kruskal-Wallis?
- 18Conclusion
What You Need Before You Run a Kruskal-Wallis Test in SPSS
You need two variables in your dataset and nothing exotic. One numeric outcome variable holds the scores you are comparing. One categorical variable holds the group membership. In the Variable View, the grouping variable should be coded with numbers that mean nothing in particular, like 1, 2, 3 for three teaching methods.
| Variable | Role | Measure | Example values |
|---|---|---|---|
| satisfaction | Test variable | Scale or Ordinal | 2, 3, 4, 5 |
| group | Grouping variable | Nominal | 1, 2, 3 |
Each row of the data editor is one person, and that person belongs to exactly one group. If your design has the same participants in every condition, you do not have independent groups, and this test is the wrong tool. Use the Friedman test or a repeated-measures alternative instead.
Also decide how you will handle missing data before running anything. System-missing cells are fine, since SPSS drops those cases pairwise, but a missing value you typed as 9 or 99 will be treated as a real score and will wreck your ranks. Check the range of your outcome in Frequencies > Frequency Tables before you start.
How to Run a Kruskal-Wallis Test in SPSS: Step-by-Step
1. Check and prepare your data
Open your data file and go to Variable View at the bottom of the window. Confirm that your grouping variable has at least three distinct values, which you can see under the Values column. Three groups is the minimum for this test, and SPSS will complain if you define a range with fewer.
Run Frequencies on the grouping variable and check the frequency table. Every group should have a sensible count. Groups with fewer than about five cases give you an unstable H and a p value the chi-square approximation handles badly. If one group is tiny, say three people, no amount of menu clicking fixes that, and you should report it as a limitation.
2. Open the Kruskal-Wallis test dialog
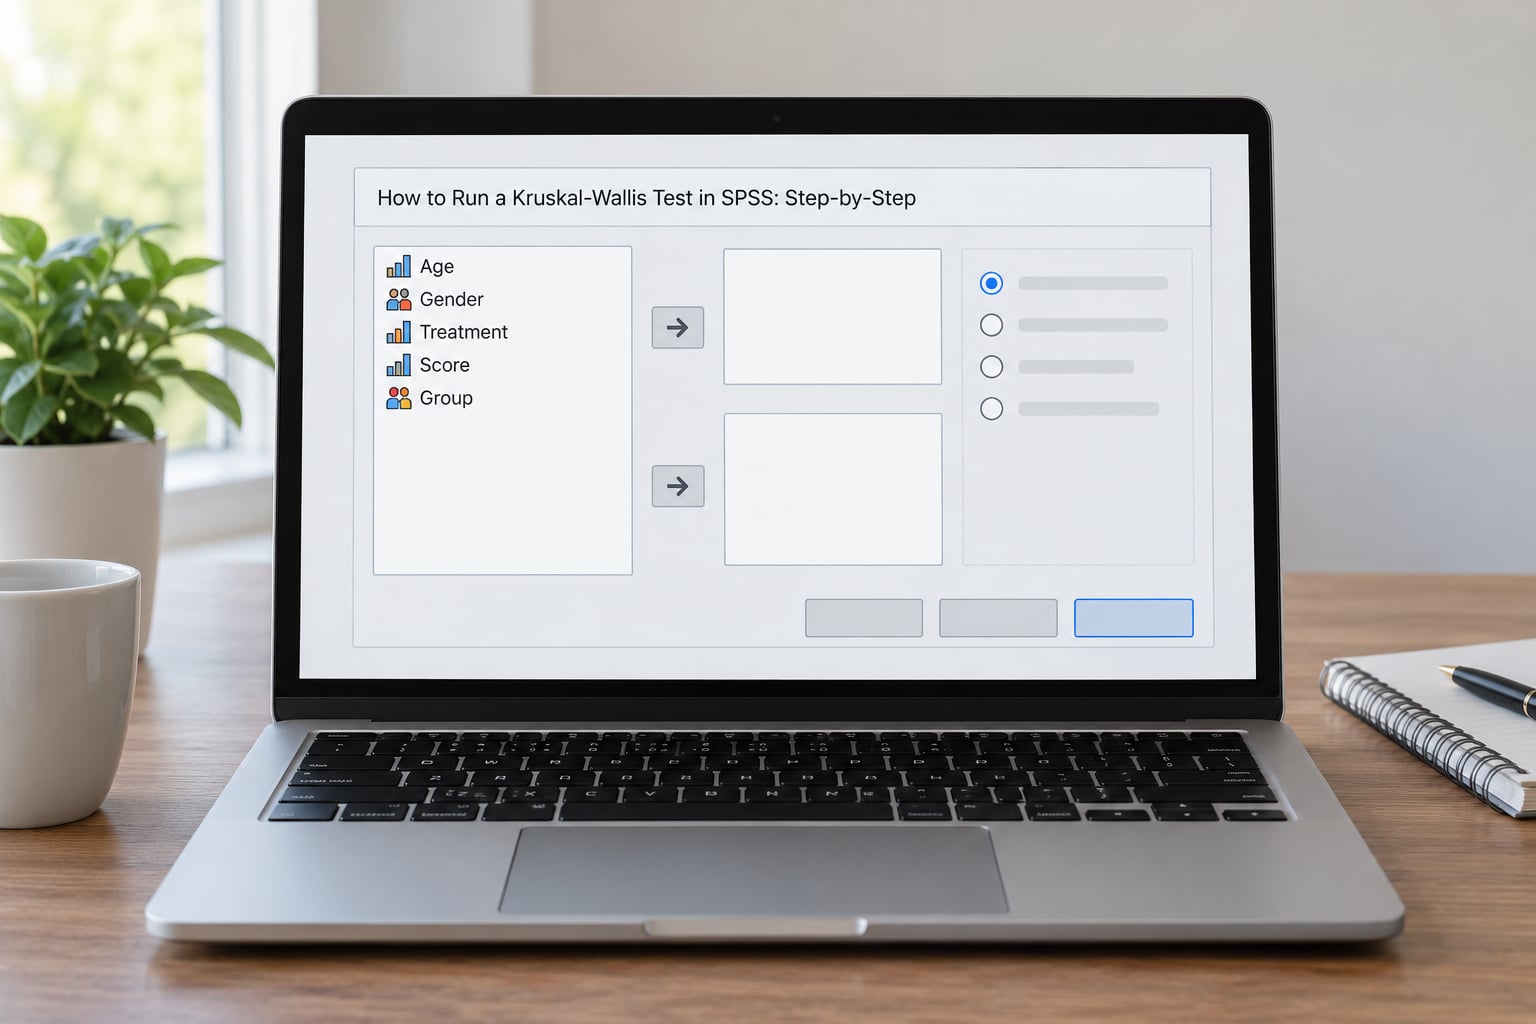
Go to Analyze > Nonparametric Tests. In SPSS 18 and later you will see a list of dialogs including 1 Sample, 2 Independent Samples, and Independent Samples. Choose the Independent Samples entry that mentions the Kruskal-Wallis test, which is labelled 2 Independent Samples in most current releases.
If your menu shows Legacy Dialogs instead, click that and choose 1 Independent Samples. It opens the older dialog with the same purpose and the same test, just with a different layout. Everything below describes the modern dialog, with the legacy differences noted where they matter.
3. Assign the test and group variables
Move your outcome variable, the one holding the scores, into the Test Variable box. Then move your grouping variable into the Group box. SPSS will not accept the test until both boxes are filled.
Click the Define Group button. A smaller dialog opens with two boxes, Minimum and Maximum. Enter the lowest and highest group codes you actually use. For three groups coded 1, 2, and 3, enter 1 and 3. For four groups, 1 and 4. This Define Range step is where most first-time users get stuck, because it defaults to 1 and 5 and silently includes groups that hold no data or no cases you meant to include.
Check the box for Kruskal-Wallis H in the list of test options, then use Options to tick Descriptives so SPSS prints group counts, means, medians, and mean ranks. Those numbers are what you will need for your results paragraph.
4. Run the test and locate the output
Click OK. SPSS writes the output to the Output Viewer, usually in a new window, and you get two things worth looking at. The Test Statistics table gives you the Kruskal-Wallis H value, the degrees of freedom, and Asymp. Sig. (2-sided), which is the p value. The Ranks table gives the mean rank and the median for each group.
Confirm three things before you read anything into the result. The test type should say Kruskal-Wallis H. The group counts in the Ranks table should match your own frequency counts. And the number of valid cases in the test statistics table should match the total you expect after missing data is removed.
If your sample is small, look for an Exact column alongside the asymptotic p value. When the exact test can be computed, trust it more than the chi-square approximation, which assumes you have enough cases for the approximation to hold.
5. Interpret the significance value
The decision rule is one sentence: if Asymp. Sig. (2-sided) is below .05, at least one group differs from the others; if it is above .05, you found no evidence of a difference at your chosen alpha level.
H is the test statistic. It approximates a chi-square distribution with degrees of freedom equal to k minus 1, so three groups give you 2 df and four groups give you 3 df. The larger H, the more the group mean ranks diverge.
Here is a result you might see. Three teaching methods produce H = 11.64, df = 2, p = .009. That is below .05, so something differs among the methods. A second run with H = 2.10, df = 2, p = .349 tells you the groups were not distinguishable at all in that sample.
A p value above .05 does not mean the groups are identical. It means this sample gave you no detectable difference, which is a statement about evidence rather than about the population. Plenty of threads on r/spss turn on exactly this misreading, and the distinction matters when you write your discussion.
6. Identify which groups differ
A significant Kruskal-Wallis result is an omnibus result. It tells you that something differs, never which groups differ from which. To find out, you need pairwise comparisons with a multiplicity correction, and this is where the two menu routes part ways.
The modern Independent Samples dialog handles this if you open Options before running and select Pairwise Comparisons, then Dunn’s test with Bonferroni or Holm adjustment. SPSS runs the omnibus test first and only produces the pairwise table when the omnibus result is significant. The output lists each pair, its adjusted p value, and a significance flag.
The Legacy Dialogs route gives you no post hoc output at all. Students who follow an old tutorial end up with a significant omnibus result and no way to say what caused it. Your options there are to run separate Mann-Whitney U tests on each pair and correct those p values yourself, or to rerun the test through the modern dialog.
With three groups you are making three comparisons, so an uncorrected family-wise error rate runs to roughly 14 percent at alpha .05. Bonferroni, Holm and Sidak adjustments all control this. Dunn’s test is the usual pairing with Kruskal-Wallis because both work on ranks.
7. How to Report a Kruskal-Wallis Result for Your Paper
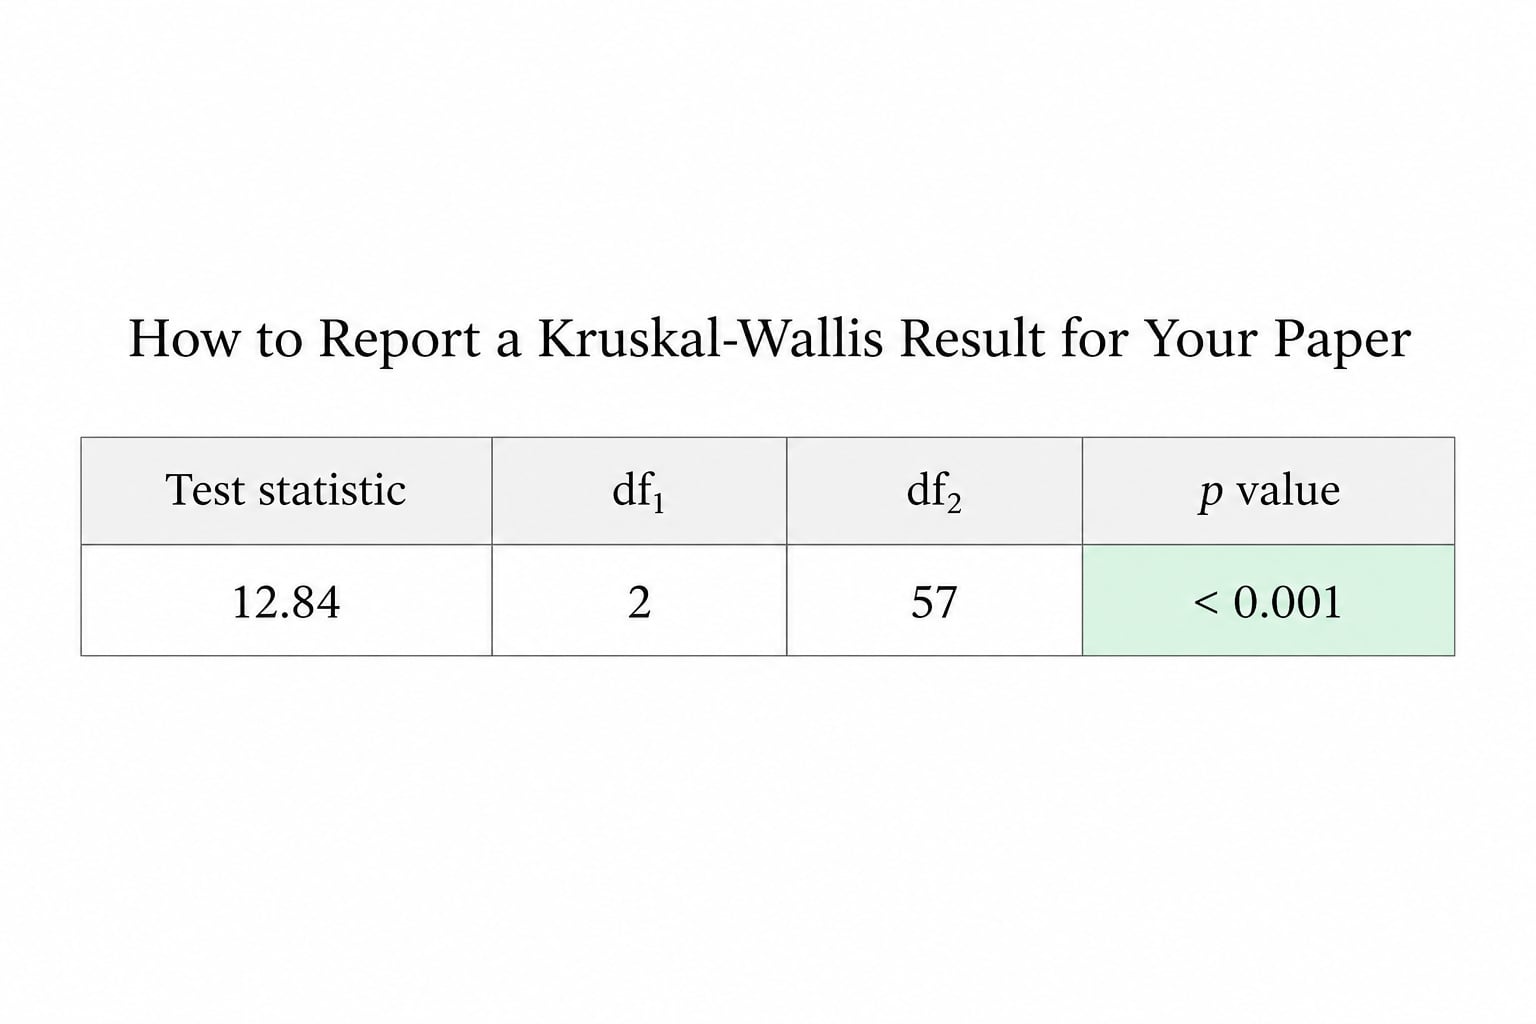
APA 7th edition wants the test name, the statistic, the degrees of freedom, the exact p value, the group descriptives, and any follow-up analysis in one or two sentences.
A Kruskal-Wallis test showed that satisfaction scores differed significantly across the three teaching methods, H(2) = 11.64, p = .009. Median scores were 4 for Method A (n = 42), 3 for Method B (n = 40), and 2 for Method C (n = 38). Dunn’s post hoc tests with Bonferroni correction showed that Method A scored significantly higher than Method C (p = .011).
APA 7 treats the exact p value as the headline number, so report .009 rather than p < .05. If you ran Dunn’s test, name it and the adjustment you used, then give the adjusted value for each significant pair. Include the effect size if your supervisor asks for one. SPSS does not compute epsilon squared for this test, but you can derive it from the output using the standard formula that divides H minus k plus 1 by n minus k.
Common Mistakes When Running a Kruskal-Wallis Test in SPSS
Treating related observations as independent samples is the most serious error, because the output looks completely normal while the p value is too small. Repeated measures on the same participants need the Friedman test. If you are unsure whether your design is independent, that is a design question, not a menu question, and it is worth settling before you analyse anything.
Leaving the grouping variable undefined is the second classic. Forget the Define Group step, define the range as 1 to 1, or use a range that covers codes you do not have, and SPSS either errors out or tests something other than what you meant. Always check the Ranks table counts against your own frequencies.
Reading p above .05 as proof that the groups are equal is the most common interpretation error in the threads I have read on this. It only means no difference was detected at that sample size. Write it as “no statistically significant difference was found” and leave it there.
Ignoring ties and small samples is a quieter problem. Likert data produce many identical values, and the tie correction in the H calculation handles it, but with very small groups the chi-square approximation can mislead. Look at the exact p value, and say in your limitations that groups were small.
Skipping post hoc comparisons after a significant result leaves you unable to write the interesting part of your findings. One r/spss user reported a significant omnibus result and no idea which groups were responsible, because the Legacy Dialog gives no pairwise table.
Running the test once per survey item is the trap that produces results nobody believes. Test 20 Likert items and you have 20 p values, so about one will look significant by luck alone. Correct for that, or state the correction you applied.
Frequently Asked Questions
Can I run a Kruskal-Wallis test in SPSS for two groups?
You can, but it is not the test designed for that job. With two groups the Kruskal-Wallis H reduces to the Mann-Whitney U test, and SPSS itself warns you when the group range covers only two values. Use Analyze Nonparametric Tests 2 Independent Samples and tick Mann-Whitney U instead. For two independent groups it gives you the same ranks-based logic, clearer output naming, and no need to justify a test designed for three or more groups.
How do I know whether the Kruskal-Wallis result is significant?
Look at Asymp. Sig. (2-sided) in the Test Statistics table and compare it with your chosen alpha level, usually .05. Below .05 means at least one group differs from the others; above .05 means no detectable difference at that sample size. If your groups are small, check whether SPSS also produced an exact p value and prefer that one, because the chi-square approximation is less reliable with tiny samples.
What should I do when the Kruskal-Wallis test is significant?
Run pairwise comparisons to find out which groups differ, because the omnibus result alone never identifies them. In the modern Independent Samples dialog, open Options, tick Pairwise Comparisons, and select Dunn’s test with a Bonferroni or Holm adjustment. SPSS will produce the pairwise table only when the omnibus test is significant. Report the adjusted p values for the pairs that differ and leave the rest unstated.
Does Kruskal-Wallis require normally distributed data?
No. That is the point of the test. It ranks the raw scores instead of working with means and variances, so severe skewness, outliers and ordinal outcomes such as Likert items are handled without the normality and homogeneity of variances assumptions that a one-way ANOVA makes. You still need independent groups, at least three of them, and a grouping variable that genuinely defines separate samples of cases.
Why does SPSS show a different number of valid cases than my dataset?
Usually because cells in your test or group variable are empty, and SPSS removes those cases rather than assigning them to a group. Cases outside the range you entered in Define Group are also excluded. System-missing values count as empty cells for this purpose, while values you typed as a placeholder number are treated as real data and stay in the analysis. Compare the N in the Ranks table with your own frequency counts to see exactly what was dropped.
Can I test the same people across more than two conditions with Kruskal-Wallis?
No, not with this test. The Kruskal-Wallis procedure assumes each case belongs to one group only, so running it on repeated measurements from the same participants breaks that assumption and produces p values that are too small. When the same people are measured across three or more conditions, use the Friedman test, which is the repeated-measures counterpart of the Kruskal-Wallis test, through Analyze Nonparametric Tests Related Samples.
Conclusion
Confirm your groups are independent and your grouping variable is properly defined, read the H, df and p value in the Test Statistics table, and run Dunn’s test with an adjustment whenever the omnibus result is significant. Report the exact p value with the group medians and the follow-up comparisons. That is the whole procedure, and doing it carefully avoids nearly every problem students bring to it.