
You need a multilevel model when your observations are not independent, because they belong to the same school, the same hospital, the same team, or the same person measured twice. The group a record sits inside is not incidental; it changes what that record’s score means, and it changes how precise your estimates are. This guide walks through how to spot that structure, how to test it with the intraclass correlation, and when a simpler analysis is the better call.
Plenty of people reach for a mixed-effects model by reflex. That reflex now and then costs you power, because a model with variance components you did not need spends degrees of freedom on structure rather than on the effect you care about. The skill here is not just fitting the model. It is knowing when the grouping earns its place.
Table of Contents
- 1What Is Nested Data?
- 2When You Need Multilevel Models for Nested Data
- 3The ICC and design effect rule for when to use multilevel models
- 4What Research Questions Do Multilevel Models Answer?
- 5Level-1 predictors
- 6Level-2 predictors
- 7Cross-level interactions
- 8Random intercepts and random slopes
- 9Changing the unit of interest changes the question
- 10How Many Levels Does Your Data Have?
- 11Nested versus crossed random effects
- 12What Distinguishes a Multilevel Model From Ordinary Regression?
- 13How Do Random Effects Differ From Fixed Effects?
- 14The few-clusters problem
- 15What Checks Should You Run Before Choosing a Model?
- 16How to Choose the Right Multilevel Model
- 17Match the outcome
- 18Choose how much random structure
- 19How to Interpret a Multilevel Model
- 201. The fixed effects
- 212. The variance components
- 223. The intraclass correlation
- 234. The shrinkage
- 24Statistical significance and practical importance
- 25When Is a Simpler Analysis Enough?
- 26Common Errors in Multilevel Analysis
- 27Frequently Asked Questions
- 28Can I use ordinary regression when my data are nested?
- 29What is the minimum number of groups needed for a multilevel model?
- 30What does an intraclass correlation coefficient tell me?
- 31Should I use random intercepts or random slopes?
- 32Can a multilevel model handle repeated measurements from the same participants?
- 33How should I report a multilevel model in a research paper?
- 34Where to Start
What Is Nested Data?
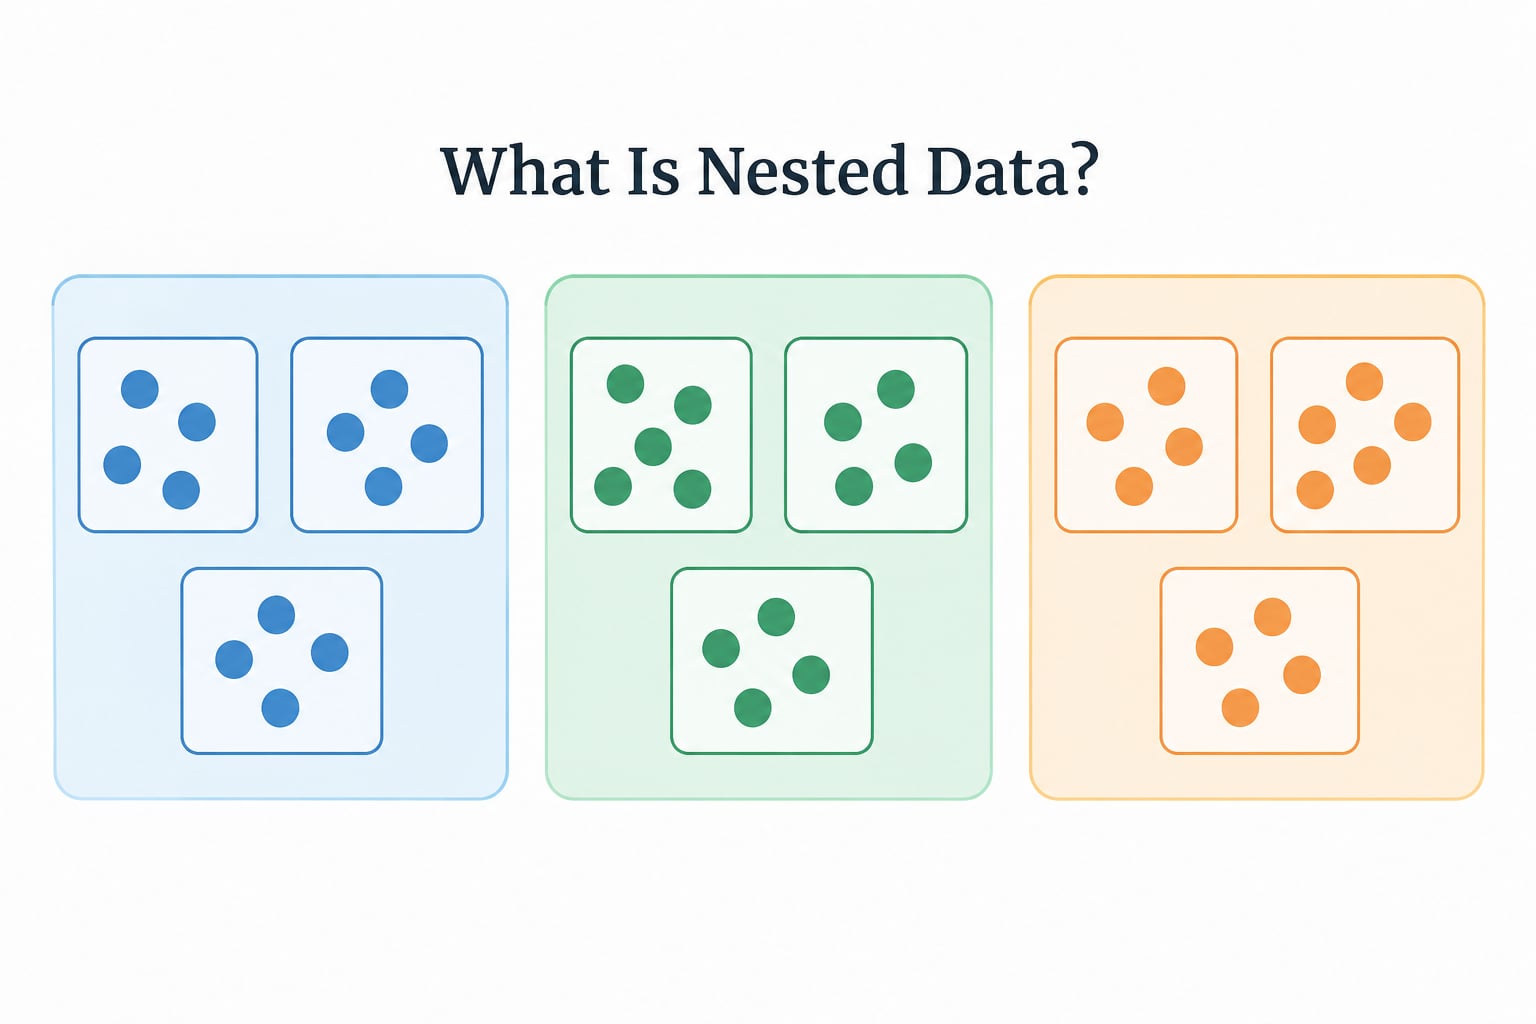
Nested data means each observation belongs to one, and only one, higher-level group. A second grader sits in one classroom. That classroom sits in one school. The set of second graders inside a classroom is nested inside the set of schools, and no second grader can be counted in two classrooms without becoming a repeated measure instead.
Here is what the level structure looks like spelled out, because most confusion in this area starts as confusion about the levels themselves.
- Students within schools, schools within districts. Level 1 is the student, level 2 is the school, level 3 is the district. Each student sits in exactly one school, each school in exactly one district.
- Patients within hospitals, hospitals within health systems. Level 1 patient, level 2 hospital, level 3 system. A patient’s readmission risk moves with hospital-level practice patterns, not just their own condition.
- Employees within teams, teams within organisations. Level 1 employee, level 2 team, level 3 organisation. Turnover in a unit is usually about the team before it is about the firm.
- Repeated measurements within one person. Level 1 is the measurement occasion, level 2 is the person. Ten weekly weights from the same participant is a two-level structure even with no organisations involved.
- Children nested in neighbourhoods and in schools at the same time. This one is crossed, not nested: a child belongs to one neighbourhood and one school, but those two groups overlap only partially.
- Survey respondents within countries or regions. Common in international comparisons where question wording, reference prices, and response norms vary by country.
- Questionnaire items within scales within respondents. Level 1 item, level 2 scale, level 3 person. The standard structure behind psychometric factor models.
- Plots within fields, sites within regions. The ecological workhorse. Yield depends on soil and management at the plot level and on weather and soil type at the site level.
- Clinics in a cluster-randomised trial. Many clusters, few per arm. The trial’s power comes from the number of clusters, not the number of patients.
- Siblings within families. Level 1 child, level 2 family. Parental education and income are level-2 variables, identical for every child in the household.
What makes nesting matter is that observations sharing a group tend to resemble each other more than observations from different groups. Two students in the same classroom share a teacher, a timetable, and a building. Their scores are correlated whether or not your model says so.
Nesting is also directional. A student is inside a classroom, but a classroom is not inside a student. When the grouping variable is not a strict hierarchy, you have crossed rather than nested structure, and the model syntax has to reflect that. More on that below.
When You Need Multilevel Models for Nested Data
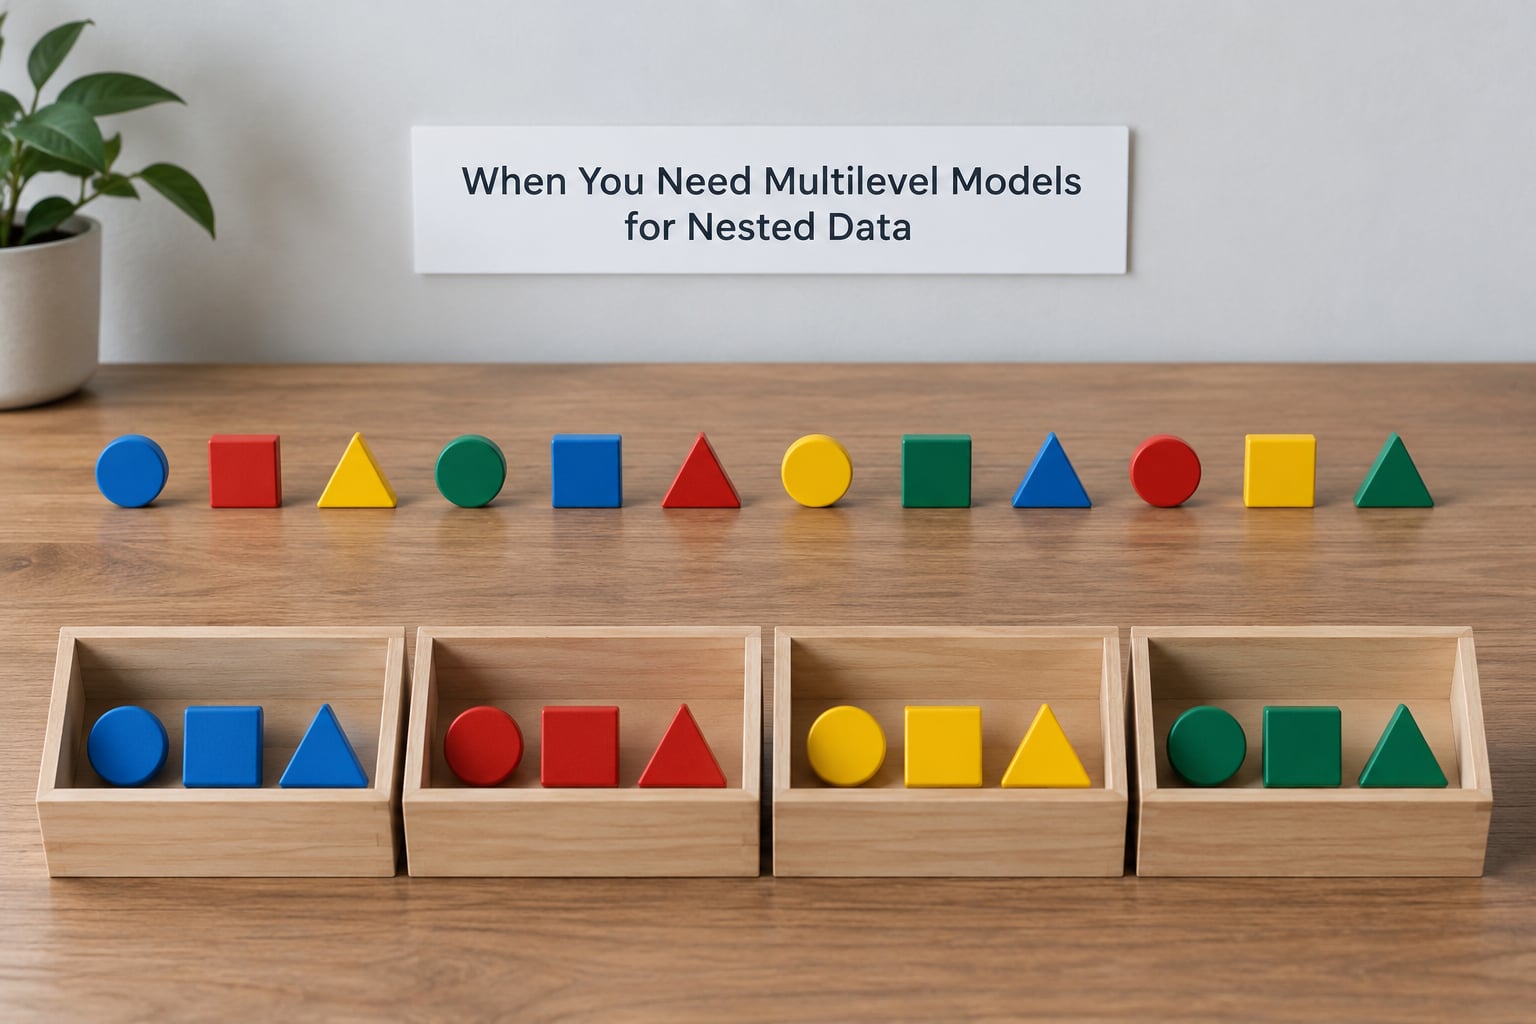
Here is the decision in plain terms: seven situations where the grouping earns a place in your model.
- Observations inside a group are genuinely more similar than observations across groups. This is the independence violation. Shared teachers, shared wards, shared supervisors, shared neighbourhoods. If you can argue that similarity, ignoring it makes your standard errors too small and your p-values optimistic.
- You want to know how much outcomes vary between groups. School-to-school spread, hospital-to-hospital spread, team-to-team spread. This is a research question in its own right, and a pooled regression cannot answer it because it never estimates a group-level variance.
- You have predictors measured at the group level. School size, hospital teaching status, team tenure. These are constant within each group. A level-1 model cannot include them at all, and a fixed-effects model with dummies estimates one of them at a time with no variance left to speak of.
- Your question is about a cross-level interaction. Does the effect of a student-level predictor depend on a school-level characteristic? That question requires the structure to be modelled, not adjusted for after the fact.
- The effect of your predictor varies across groups. If a training programme works well in some teams and not others, you need a random slope so the model can estimate that variation instead of averaging it away.
- You need to generalise from the groups you sampled to a population of similar groups. Random effects treat your schools or hospitals as a draw from a wider population. Fixed effects treat them as the entire universe you care about. Only one of those supports the inference you probably want.
- Cluster sizes are unbalanced and you do not want to lose records. Aggregation to group means discards within-group information and weights small groups too heavily. A multilevel model keeps every observation and handles unequal group sizes without special pleading.
The ICC and design effect rule for when to use multilevel models
The intraclass correlation is the share of total variance that sits between groups rather than within them. Fit a null model with no predictors, read off the between-group and within-group variance, and divide one by their sum. That single number, combined with how many observations you have per group, tells you how much work the clustering does to your effective sample size.
The design effect formula does the arithmetic: deff = 1 + (m − 1) × ICC, where m is the average number of observations per group. Multiply that by your total sample size and divide to get the effective sample size your analysis really has.
For 1,200 observations with an average of 30 per group, that gives 40 groups and the following picture.
| ICC | Design effect (m = 30) | Effective sample size | What it means for you |
|---|---|---|---|
| 0.010 | 1.29 | 930 | Pooling loses about a fifth of your precision. Fine for ordinary regression, wrong for anything else. |
| 0.050 | 2.45 | 490 | Meaningful loss. The clustering is doing real work. |
| 0.100 | 3.90 | 308 | Clear case for modelling the hierarchy. |
| 0.250 | 8.25 | 145 | Pooling is badly misleading. Model it. |
| 0.500 | 15.50 | 77 | Groups dominate. Almost nothing is an individual-level finding. |
The rule of thumb most people use: an ICC below about 0.05 in a purely observational design is small enough that the design effect stays under 1.5, and a single-level model with cluster-robust standard errors is defensible. An ICC above 0.10 makes the clustering hard to ignore. Between 0.05 and 0.10 sits the awkward zone where the design, the sample size, and the stakes decide.
A caution on the low-ICC case. That threshold describes power. It does not license ignoring clustering when you also care about group-level predictors or group-level variance, and it is useless when groups are very small. If your average cluster size is 3, an ICC of 0.03 still leaves you with a design effect above 1.06 per group, and the problems show up in the variance estimates rather than the standard errors.
What Research Questions Do Multilevel Models Answer?
The model you need follows from the question you want answered, and the questions themselves differ by level.
Level-1 predictors
A level-1 predictor varies across individual observations. Student attendance, age, dosage, weekly hours worked. A multilevel model estimates these alongside a group structure, which matters because a level-1 coefficient in a hierarchical model is a within-group effect: it describes what happens when two students in the same school differ on that variable. That is a different quantity from a pooled coefficient.
Level-2 predictors
A level-2 predictor is constant within a group and varies between groups. School size, teaching experience of the ward, team autonomy. These cannot be entered in a model that treats every observation as independent, because the model has no way to tell that 30 students share one value of this variable rather than 30 independent values.
Cross-level interactions
A cross-level interaction asks whether a level-1 effect depends on a level-2 characteristic. Does the benefit of a tutoring programme shrink as class size rises? The interaction term answers this directly. It also needs enough groups: around 20 to 30 at the higher level is a common minimum for a stable estimate, and considerably more for a well-powered one.
Random intercepts and random slopes
A random intercept lets each group have its own baseline. A random slope lets the effect of your predictor differ by group, and the covariance between the intercept and slope tells you whether groups with higher baselines also respond more strongly. Both can be in one model, but the second costs you degrees of freedom you may not have.
Changing the unit of interest changes the question
If you care about individual variation, you want level-1 predictors with group structure in the background. If you care about school effectiveness, you want level-2 predictors and you probably want group-centred versions of the individual variables so you can separate the individual and school components. If you want to generalise from your 40 schools to schools like them, you need random effects. Each of these is a different model, built from the same data.
How Many Levels Does Your Data Have?
Count levels by asking what contains what. Measurements sit inside people: two levels. People sit inside teams, teams inside organisations: three levels. Where a person belongs to two groups at the same level, the structure is crossed rather than nested, and it adds a level even though the count of variables suggests otherwise.
The unit of analysis and the grouping structure are not the same thing, and conflating them is a frequent source of badly specified models. Your unit of analysis might be the student, which is exactly what your data rows are. The grouping structure is the additional hierarchy you must account for around that unit. A dataset can have one row per student and still be a two-level problem, and it can have a row per student and a school column and be nothing of the sort if every school contributes exactly one student.
Variables operating at different levels are the tell. Anything constant within a school is level 2 by definition, whatever the column name suggests. Centre your level-1 variables and check: if a value barely moves within a school but changes a lot between schools, you have probably found a level-2 variable by accident.
Nested versus crossed random effects
| Structure | What it means | Example | Syntax pattern |
|---|---|---|---|
| Nested | Each lower unit sits in exactly one higher unit, and each higher unit contains lower units belonging only to it | Students in schools | (1 | school) |
| Crossed | Lower units belong to one group on each of two or more dimensions, and the groups do not contain one another | Children in neighbourhoods crossed with schools | (1 | neighbourhood) + (1 | school) |
| Partially crossed | One dimension nests strictly, another crosses | Students in schools, all in one district | (1 | district/school) |
The same model in the three tool families your lab is most likely to use. Students in schools in districts, three-level, continuous outcome:
R (lme4): <- lmer(score ~ hours + age + (1 | district/school), data = df)
Stata: mixed score hours age || district: school ||, data
SPSS: MIXED score BY district school WITH hours age /FIXED hours age /RANDOM = district school /LEVEL = district school.
R writes the nesting top down, district then school. Stata’s mixed uses || as the nesting operator and drops level-1 fixed effects after the first || because level 1 has no higher grouping within it. SPSS takes the level names after /LEVEL and the grouping variables after /RANDOM, which is the bit most people get wrong on their first attempt. Mplus and lavaan also handle multilevel SEM, though lavaan’s multilevel path support is narrower: complete cases, random intercepts at the higher level, no random slopes.
What Distinguishes a Multilevel Model From Ordinary Regression?
Ordinary least squares gives you one residual variance term for the whole dataset. A multilevel model splits it into a between-group component and a within-group component, and lets the group structure correlate with your predictors in a controlled way. The consequences are practical, not cosmetic.
Take a school dataset: 40 schools, 30 students each, scores with a between-school variance of 25 and a within-school variance of 75. The ICC is 25 / 100 = 0.25, and the design effect at m = 30 is 1 + 29 × 0.25 = 8.25. Your 1,200 rows behave like roughly 145 independent observations.
If you run ordinary regression and get a standard error of 0.08 for your predictor, the multilevel model will typically give you something nearer 0.23. The point estimate rarely moves much. The precision claim does, and precision is what your p-value is made of. That gap is the whole argument, and it is why confidence intervals in published work widen once clustering is modelled correctly.
There is a second failure that is not about standard errors at all. Ignoring hierarchy invites two fallacies. The atomistic fallacy is reading individual-level relationships into group-level data: concluding that schools with higher average income have higher scores because within schools the richer students score higher. The ecological fallacy is the reverse: concluding that individuals behave like their group average. A multilevel model does not abolish these, but forcing you to state which level each variable lives on makes both errors harder to commit.
One more distinction matters. A mixed-effects model is not simply a fixed-effects model with extra steps. The fixed part estimates an average relationship that is constant across groups by assumption unless you add interactions with group indicators. The random part estimates how much that relationship varies. If you need the variation, no amount of dummy variables gives you a clean estimate of it, because each group-specific slope consumes its own parameters and you run out of data long before you run out of groups.
How Do Random Effects Differ From Fixed Effects?
The difference is a claim about the world. Random effects say the groups you have are a sample from a population of groups, and the variation among them is something to estimate. Fixed effects say the groups you have are the specific groups you care about, full stop, and each one gets its own parameter.
That claim changes what you can say. With a random school effect, you can estimate school-level variance and generalise to schools you did not sample. With a fixed school effect, you can report how School 14 differs but cannot say anything about School 4000, and the school-level variance is not a parameter in the model at all.
It also changes what happens with group-level predictors. School size varies between schools and is constant within them. In a fixed-effects model with a dummy for every school, size is perfectly collinear with the dummies and gets dropped or reported with an unusable standard error. The random-effects model separates the two cleanly, which is why group-level predictors and multilevel modelling arrive together so often.
The few-clusters problem
Here is the case that trips people up. If you have 2, 3, or 4 hospitals, a random-effects assumption is doing an enormous amount of work: it is asking you to characterise a distribution of hospital effects from three draws. Estimates become unstable, standard errors unreliable, and boundary solutions appear where a variance component is estimated as zero. Community threads describe this as the model being sad, and it is a fair description.
With fewer than about five groups at a level, treat those groups as fixed. You lose the population inference, and you should say so in your limitations, but you gain estimates you can defend. Between five and around twenty, the choice is genuinely contested and worth a sensitivity analysis: fit it both ways and report whether your substantive conclusions move. Above twenty to thirty, random effects is usually safe.
McNeish and Kelley (2019) make the case that the random-effects and fixed-effects models are far closer than the textbook contrast suggests when the sampling of groups is plausible, and that the more consequential assumption is the one about regressors being uncorrelated with the random effects. Antonakis and colleagues make a sharper version of that point. Both are worth reading before you commit to a specification in a paper.
What Checks Should You Run Before Choosing a Model?
Work through these in order. The first three decide whether a multilevel model is even on the table.
- Count the groups at every level. Not the rows. If any level has fewer than about 20 groups, note it now, because it constrains everything downstream and it will come up in review.
- Look at cluster sizes. Two observations per cluster is the classic error case. As a rough floor, you want at least around 10 and ideally 20 to 30 observations per group for a stable within-group model, and the floor is higher once you add random slopes.
- Fit a null model and read the ICC. No predictors, just the grouping variable. That gives you the variance components and the ICC before any interpretation gets in the way.
- Check whether cluster sizes are wildly unbalanced. Unbalanced clusters are handled by multilevel models without special effort, but they change the effective sample size calculation and they can leave the smallest groups with unstable estimates. Small groups get shrunk harder, which is correct behaviour, not a bug.
- Look at missing data by group. Differential attrition across schools or teams is itself a level-2 phenomenon and can quietly turn into a level-2 finding.
- Check for outliers within and between groups. A single school with a mean four standard deviations from the rest is a between-group question, not a student-level one.
- Test linearity and the distribution of residuals within groups. Not just overall. Heteroscedasticity across groups, and non-normal residuals within a group, both need attention before you trust the variance components.
- Ask whether your design supports the claim you want to make. Level-2 inference needs groups sampled from something. No model converts an observational convenience sample of clinics into a basis for causal claims about health systems.
That last point is the one people skip. Multilevel modelling is a way to represent structure. It does not repair a design that was never able to answer the question, and a carefully specified model on a weak design is still a weak design.
How to Choose the Right Multilevel Model
Two decisions: what family the outcome puts you in, and how much random structure to include.
Match the outcome
| Outcome | Model family | Common choices |
|---|---|---|
| Continuous | Linear mixed model | lmer, mixed, MIXED |
| Binary | Logistic mixed model, or GEE | glmer with a binomial family, melogit, MIXED LOGISTIC |
| Count | Poisson or negative binomial mixed model | glmer with poisson or nbinom_cdf |
| Ordinal | Ordinal mixed model | ordinal package in R, MIXED ORDINAL in SPSS |
| Time to event | Shared frailty or stratified survival | Cox with a cluster frailty |
| Unbounded continuous | Nonlinear mixed model | nlme, nlme-family models in Stata |
For binary outcomes, the mixed logistic model and GEE answer related but different questions. The mixed model estimates subject-specific effects with subject-specific random intercepts and shrinks unstable groups toward the mean. GEE estimates a population-averaged effect with working independence within clusters and robust standard errors. If you want to say something about how effects vary between groups, use the mixed model. If you only want a marginal effect with correct standard errors, GEE is lighter and often easier to defend.
Choose how much random structure
- Random intercept only. Groups differ in baseline level but the predictor works the same everywhere. The default, and the cheapest.
- Random intercept and random slope. You want to know whether the effect differs by group. Needs enough observations per group, and it is where singular fits appear.
- Random intercepts at several levels. Three-level structures, or crossed structures. Every additional level costs degrees of freedom at that level.
Build the model up rather than all at once. Empty model, then random intercept, then level-1 predictors, then level-2 predictors, then interactions, then random slopes. At each step look at the variance components and the fit, and keep a record of what each addition bought you.
Use REML for comparing models that have the same fixed-effects structure, since ML and REML estimates of variance components are not on a common scale. Use ML when you want to compare models with different fixed-effects structures, including by likelihood ratio. Report which one you used; it changes the numbers.
How to Interpret a Multilevel Model
Read the output in four passes, in this order.
1. The fixed effects
A level-1 coefficient is a within-group effect. If hours of practice has a coefficient of 0.4 in a student-within-school model, that is the expected score difference between two students in the same school who differ by one hour. A level-2 coefficient describes between-group differences. Keep the two distinct in your prose, because collapsing them into “hours matter” is where misreadings start.
2. The variance components
The group-level variance says how much outcomes vary between groups after you have accounted for the predictors. The residual variance says how much they vary within groups. If the group variance is small, your multilevel model is doing very little, and that is worth knowing before you write a paragraph about between-group variation.
3. The intraclass correlation
ICC is the between-group variance divided by the total. For a null model it answers “how clustered is this data at all”. For a model with predictors it answers “how much clustering remains once I have explained what I can”. The second is more informative, and it is a better diagnostic of whether your structure is doing work.
4. The shrinkage
Group-specific estimates from a multilevel model are not raw group means. Each one is pulled toward the overall mean by an amount that depends on how much data supports it. A group with 4 observations is shrunk hard; a group with 60 is barely touched. This is empirical Bayes shrinkage, and it is the reason small groups look less extreme than your descriptive table suggests. If you are reporting group rankings, say that they are shrunk estimates rather than observed means.
Statistical significance and practical importance
A level-2 effect can be statistically significant and practically trivial when you have many groups, and it can be practically large and non-significant when you have ten. Report the estimate, the interval, and the ICC together, and translate the estimate into the units people care about: a 0.3-point difference on a 4-point scale is not the same sentence as a 0.3-point difference on a 100-point test. Confidence intervals on variance components are wide and often reported on a transformed scale; give the range and stop trying to read significance into it.
When Is a Simpler Analysis Enough?
This is the section that changes your analysis most often, and it is the one most often missing from textbooks. Four approaches handle clustered data, and each buys you something different.
| Approach | What it gets right | What it costs you | Choose it when |
|---|---|---|---|
| Multilevel (mixed-effects) model | Everything: within and between coefficients, group variance, group-level predictors, cross-level interactions, generalisation to a population of groups | Degrees of freedom, convergence headaches, a model reviewers in your field may not read comfortably | You care about any group-level quantity, or the ICC is above roughly 0.05 with more than about 20 groups |
| Fixed effects with dummy variables | Correct within-group effects, and immunity to unobserved group characteristics, since each group gets its own intercept | No group-level variance, no group-level predictors alongside dummies, and many parameters consumed | You care only about within-group effects and the groups are fixed, such as the specific sites in a study |
| Cluster-robust standard errors | Correct standard errors for the fixed part, with no distributional assumptions about the group effects | No group variance, no random slopes, no group-level predictors, and small-sample corrections that are unreliable below about 40 clusters | You want one honest p-value for one coefficient and nothing else, and the ICC is low |
| Aggregate to the group level | A simple analysis on the unit you actually sampled | Within-group variation is discarded, small groups get equal weight, and individual-level relationships cannot be recovered | Your question is purely group-level and you have enough groups to analyse directly |
Two more legitimate simplifications. Repeated-measures ANOVA handles a single group factor with one measurement per subject, and with balanced groups it is a special case of the random-intercept model rather than a rival to it. For change over time, a mixed model with a linear time term and a random slope for time usually beats repeated-measures ANOVA, because it handles unbalanced missingness and unequal spacing between occasions without fuss.
Do not choose a multilevel model by reflex. McNabb (2021) makes the argument directly: routine use of multilevel models for clustered data reduces statistical power and consumes degrees of freedom for structure the study never needed. The honest framing for a methods section is that you checked the ICC and the group count, and here is why you landed where you did.
Common Errors in Multilevel Analysis
These are the failures that show up repeatedly in review comments and forum threads.
Ignoring the clustering entirely. The most common, and the easiest to fix. Your standard errors are optimistic and every confidence interval is too narrow. At minimum, run cluster-robust standard errors and compare against the pooled model. If the intervals barely move, you have your answer about whether the structure matters.
Too few groups. Two or three observations per cluster produces unidentifiable variance components and boundary solutions. Nine hospitals in a trial is a real-world figure that shows up often. No model choice rescues it; report the limitation and consider a fixed-effects approach.
Getting the nesting order wrong. (1 | school) and (1 | district/school) are different models, and so is writing the levels bottom up. If the model converges to a nonsense result or fails entirely, check your order before anything else. In R, nesting is written largest unit first; in Stata’s mixed, use ||; in SPSS, list the levels outermost first after /LEVEL.
Over-parameterising random slopes. Adding a random slope for every predictor in a model with small clusters is the fastest route to a singular fit. Add them one at a time, and check the variance component’s confidence interval before defending it.
Failing to centre before testing cross-level relationships. If you want to know whether the association between a student-level and a school-level variable is meaningful, grand-mean centre the level-1 variable, then build the cross-level interaction from that. Group-mean centring answers a different question, and switching between the two can flip your substantive conclusion, which is why the centring choice has to be stated explicitly in the methods.
Treating a group-level variable as if it varied within groups. If a column is constant inside every school, no amount of data makes it a level-1 predictor. Check its within-group variance before you model it.
Over-interpreting random effects. A group-level variance estimated as zero, or with a confidence interval spanning zero, does not mean groups are identical. It often means the data cannot tell the difference. Say that.
Reporting results without the group counts. Any multilevel result without the number of groups at each level, the cluster size distribution, and the ICC is not interpretable. Reviewers will ask, and the honest answer belongs in the paper anyway.
Frequently Asked Questions
Can I use ordinary regression when my data are nested?
You can fit ordinary regression, and you can fit cluster-robust standard errors on it, which fixes the standard errors without modelling the hierarchy. That is a reasonable choice when the ICC is below about 0.05, groups number twenty or more, and you want a single within-group effect and nothing else. It does not give you group-level variance, group-level predictors, or cross-level interactions.
What is the minimum number of groups needed for a multilevel model?
Around 20 to 30 groups per level is the usual working minimum, and more is better. Below five groups, treat the groups as fixed effects and accept the loss of population inference. Between five and twenty the choice is contested, so fit the model both ways and report whether your conclusions change. Group count, not observation count, sets the ceiling on what you can estimate at a level.
What does an intraclass correlation coefficient tell me?
The ICC is the share of outcome variance that sits between groups rather than within them, calculated as the between-group variance divided by the total. It tells you how clustered your data are, and combined with your average cluster size it gives the design effect and therefore your effective sample size. In a model with predictors, it shows how much clustering remains after you have explained what you can.
Should I use random intercepts or random slopes?
Use a random intercept when groups differ in baseline level but your predictor works the same way everywhere. Add a random slope when you want to know whether the effect itself varies across groups, which needs substantially more observations per group. In practice, start with the intercept, add slopes one at a time, and check that each variance component has a confidence interval excluding zero.
Can a multilevel model handle repeated measurements from the same participants?
Yes, and this is one of its strongest cases. Treat each measurement occasion as level 1 and the participant as level 2, with a random intercept for the participant. Adding a random slope for time lets each participant follow their own trajectory. This handles unequal spacing between visits and unbalanced missingness, which repeated-measures ANOVA handles awkwardly.
How should I report a multilevel model in a research paper?
Report the software and version, the full formula including all random terms, the number of groups at each level, the cluster size distribution, and the intraclass correlation. State your centring choice, your estimation method, and how you handled degrees of freedom. Include the variance components with their intervals, not just the fixed effects table.
Where to Start
Count your groups first. That one number tells you whether a random-effects model is even defensible, and it is the number reviewers will look for. Next, fit a null model and read the ICC and the cluster sizes. Those two facts, combined through the design effect formula, give you a defensible answer to the question you actually came here with.
Only then choose a model, and choose the simplest one that answers your question. If a level-2 predictor or a cross-level interaction is in your research question, the multilevel model is the right tool and the effort is justified. If neither is, and the ICC is small with plenty of groups, cluster-robust standard errors will give you an honest answer with a fraction of the fuss.