
A factor loading is the correlation between an observed variable and an underlying latent factor, and it ranges from -1 to +1. How to interpret factor loadings comes down to three things: how strong the number is, which direction it points, and whether it is the only factor that item loads on.
If you have a rotated component matrix or a pattern matrix in front of you and no idea which items belong where, you are in the right place. The reading process takes about ten minutes once you know the sequence, and the arithmetic behind it is simple enough to do by hand.
The rest of this guide walks through that sequence: a threshold table you can pin above your desk, a fully worked example, the rules for cross-loadings and negative values, the differences between exploratory and confirmatory analysis, and the language to use when you write it up. I have kept the statistics conventional and the examples small, because the mistakes people make are almost always about interpretation, not computation.
Table of Contents
- 1What Factor Loadings Mean
- 2Factor Loading Values at a Glance
- 3How to Interpret Factor Loadings Step by Step
- 4How to Interpret Factor Loadings: Choose the Strongest Loading for Each Variable
- 5Compare Loadings Down the Column
- 6Check What the Software Actually Reported
- 7Understand Cross-Loadings and Ambiguous Variables
- 8Interpret Positive and Negative Loadings
- 9Use Different Rules for EFA and CFA
- 10Check Significance, Sample Size, and Measurement Error
- 11Turn Loadings into Meaningful Factor Names
- 12Common Factor Loading Interpretation Mistakes
- 13How to Report Factor Loadings in a Paper
- 14Frequently Asked Questions
- 15Is a factor loading of 0.30 acceptable?
- 16Why can a factor loading be negative?
- 17What should I do with a cross-loading?
- 18Does a factor loading have to be statistically significant?
- 19How do I interpret loadings differently in EFA and CFA?
- 20Conclusion
What Factor Loadings Mean
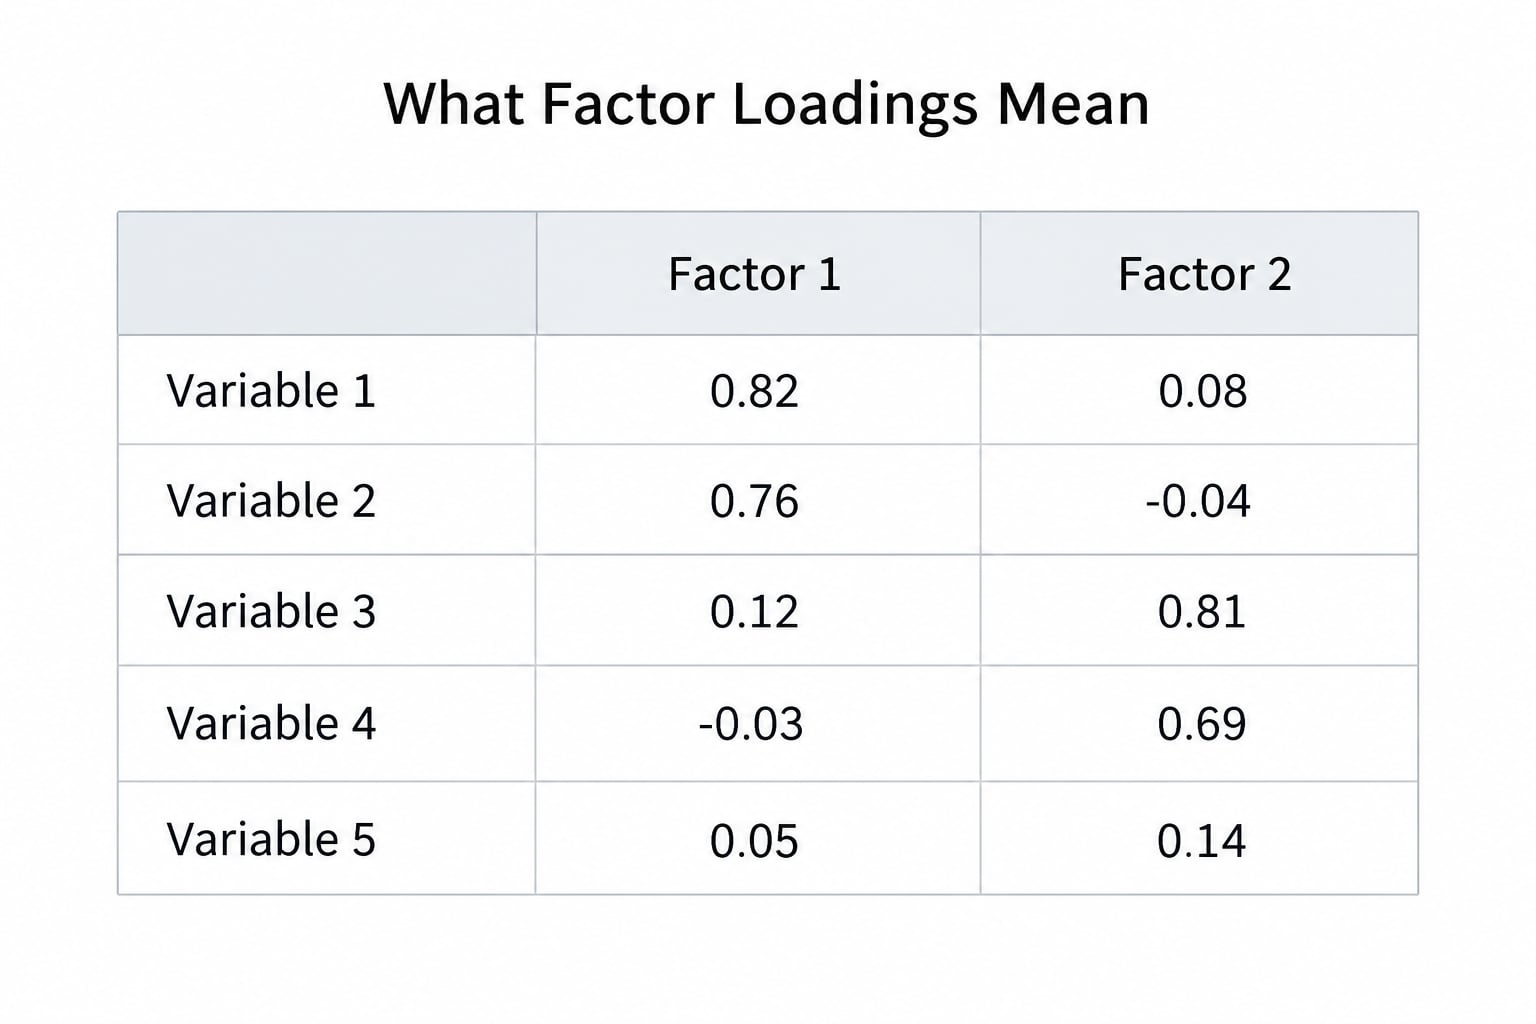
Factor analysis starts from a puzzle. You have measured twenty survey items, they all correlate with each other to some degree, and you suspect that correlation is not random. The analysis looks for the handful of latent constructs that could have produced those correlations.
A loading, written as lambda or simply as a decimal, tells you how strongly one observed variable moves with one factor. At 1.00 the variable is perfectly aligned with the factor. At 0 it shares nothing. Most real data sits somewhere between 0.30 and 0.80, and that middle ground is where all the interpretation work happens.
Here is a plain hypothetical. Suppose you survey nursing students on three items about clinical confidence and four about placement anxiety. After extraction and rotation, “I feel prepared on the ward” shows a loading of 0.78 on one factor and 0.14 on the other. That item is strongly attached to the first factor and barely involved in the second, which is exactly what a well-behaved indicator looks like.
Two properties of the coefficient matter from the start. Its absolute value gives strength, and its sign gives direction. Everything after this point is a refinement of those two facts plus a check for competing explanations.
Factor Loading Values at a Glance
These bands are conventions, not laws. They were built on large samples and simple correlation structures, so treat them as a starting point that gets adjusted by your sample size and design.
| Absolute loading | Common label | What it usually means | Where the cut-off is applied |
|---|---|---|---|
| Below 0.30 | Weak | The item shares little with the factor and may be noise | EFA item retention; also weak CFA indicators |
| 0.30 to 0.39 | Modest | Retain only with a clear reason, such as a large sample or a small number of items per factor | EFA item retention |
| 0.40 to 0.49 | Acceptable | The usual minimum for keeping an item in exploratory work | EFA item retention |
| 0.50 to 0.69 | Strong | A solid indicator that anchors its factor | EFA and CFA |
| 0.70 and above | Very strong | The item is nearly measuring the factor on its own | CFA indicator validity |
The 0.30, 0.40 and 0.50 numbers conflict because they were never meant to answer the same question. Retention thresholds in exploratory analysis are deliberately permissive, since the whole point is to find candidate structure and refine it. Confirmatory analysis is the opposite: you have already committed to a structure, so an indicator below roughly 0.70 signals a poorly specified model.
Sample size shifts things too. With fewer than 150 participants, push the retention bar toward 0.50 rather than 0.40. Complex designs and low communalities pull in the same direction.
How to Interpret Factor Loadings Step by Step
Work through a matrix in this order and you will not miss anything: check the signs, find the largest absolute value in each row, note every other non-trivial value, compare the pattern down each column, then decide whether each item has a defensible home. If you are ever unsure, the rest of this sequence is the order I would follow on someone else’s output.
How to Interpret Factor Loadings: Choose the Strongest Loading for Each Variable
Read across the row for each item and take the largest absolute value. That is the primary loading and it decides the item’s factor assignment. In a Varimax solution, the value you want is usually well separated from everything else in the row, so the choice is easy.
The caution is about the cases where nothing stands out. An item whose strongest loading is 0.34 and whose next is 0.31 has no real primary factor, and no amount of careful reading will manufacture one. Publish the whole row in your write-up and let readers see the ambiguity rather than quietly reporting the largest number.
Compare Loadings Down the Column
Now turn the matrix on its side. Each column should be dominated by a handful of items with high loadings and a majority near zero. A factor held together by one loading of 0.71 and six loadings under 0.30 is thin, and a scale built on it will be unstable.
Count the items per factor as well. Three or four items with loadings above 0.50 is a workable minimum. Two is a judgment call that needs defending.
Check What the Software Actually Reported
Some output tables contain significance markers, standard errors or confidence intervals next to each value. Where they exist, read them before deciding anything. A point estimate of 0.45 with an interval running from 0.20 to 0.70 tells you much less than the single number suggests.
Understand Cross-Loadings and Ambiguous Variables
A cross-loading is any meaningful loading on a factor other than the item’s primary one. It is the main reason factors are hard to name, because one item is now telling two stories at once.
The practical decision rule uses the difference between the two loadings. A spread under 0.20 means the item is essentially clean, since most software output rounds to two or three decimals and small gaps are not meaningful. A spread between 0.20 and 0.25 warrants a note in your interpretation. A spread above 0.25 means the item is ambiguous and something has to change. In other words, a cross-loading only needs action once the gap tells you it is competing for the item, not merely accompanying it.
One published rule for flagging goes further: drop an item when its communality is below 0.20, its absolute loading is below 0.40, and a secondary loading exceeds 75 percent of the primary. Each condition alone is a weak case for removal, but the combination is hard to defend around.
What you do next depends on the cause. If the item is worded ambiguously, fix the wording rather than the sample. If two factors correlate strongly and the item genuinely spans both, an oblique solution may be more honest than deletion. If it is a one-off stray, remove it and rerun.
Interpret Positive and Negative Loadings
A negative sign carries no moral weight. It means that as scores on the observed variable go up, scores on that factor go down, given how the item and the factor are scored. A loading of -0.62 is just as strong as +0.62.
Negatives often appear for a good reason. If you reverse-code an item so that high agreement becomes a low score, it will load negatively on a positively worded factor. Many researchers then reverse the factor axis or flip the sign for reporting, which is cosmetic and changes nothing substantive.
An unexpected negative is different. It usually means the item does not measure what the others measure, or that reverse coding was applied to the wrong items. Check the original coding before you interpret anything, because a miscoded item will distort every factor it touches. Sign indeterminacy is worth knowing about too: rerunning the same analysis can flip the sign of an entire column without changing the fit, so a negative on the first factor is a labelling convention rather than a finding.
Use Different Rules for EFA and CFA
The two methods use loadings for opposite purposes, and mixing their rules produces most of the confusion in interpretation.
Exploratory factor analysis asks an open question. You do not know how many factors there are or what they mean, so the loadings tell you which items cluster together and how to name the resulting groups. Here, retention thresholds of 0.40 or 0.50 are reasonable, rotation is expected, and naming the factor is a required step.
Confirmatory factor analysis tests a structure you have already specified. Loadings now answer a validity question: does each indicator adequately represent its latent construct? Expect higher values, look for standardized estimates rather than unstandardized ones, and remember that the first loading for each factor is fixed to 1.00 to set the scale of the factor, which makes it uninterpretable as a strength. It is a mathematical necessity, not a perfect indicator.
Software and versions differ in what they print by default. Some report unstandardized estimates, some standardized ones, and some show both. If you are not sure which you are looking at, check the column header before comparing any number to a threshold.
Check Significance, Sample Size, and Measurement Error
Loadings are estimated values with error around them, and the size of that error shrinks as your sample grows. In a sample of 100 with a loading of 0.40, the confidence interval is wide enough to include values you would normally reject.
This is why small samples produce unstable solutions. Rerun an analysis on a small dataset and you may get a different number of factors and different assignments. Bootstrap or split-half checks reveal this directly. If a loading changes sharply across resamples, report it as tentative.
Measurement error is the other side of the story. A loading of 0.70 implies roughly half the item’s variance is error rather than shared factor, which is a ceiling no real instrument fully reaches. Treat extremely high loadings in noisy self-report data as a reason for mild scepticism rather than celebration.
Turn Loadings into Meaningful Factor Names
A factor gets named from the items that load on it, not from the statistics. Read the column, list the items with loadings above about 0.40, and look for the shared theme in their wording.
Worked example. In a study of postgraduate students, one factor collects “I study because I enjoy the subject,” “I read optional material for pleasure,” and “I would take this module again.” Loadings of 0.74, 0.69 and 0.58 on study motivation, with values near zero elsewhere. A second factor holds “I find the reading list overwhelming,” “I work better under deadline pressure,” and “My workload exceeds my available hours,” loading 0.71, 0.66 and 0.62. Two distinct themes, no overlap, no sign of suppression. Naming them Study Motivation and Perceived Workload is the obvious and defensible move.
Keep names short and descriptive. If you need a paragraph to justify the label, the pattern is probably not simple enough to name cleanly, and you should revisit the extraction.
Common Factor Loading Interpretation Mistakes
- Treating 0.40 as a law. It is a rule of thumb for exploratory item retention. Adjust it for sample size, factor count and indicator reliability.
- Ignoring cross-loadings. Reporting only the largest loading in each row hides the ambiguity that a reader will notice in your appendix table.
- Reading a negative sign as a problem. A reversed item produces one legitimately. Check the coding before you panic.
- Naming a factor from a single indicator. One 0.80 loading and five near-zero values is a one-item scale wearing a factor’s clothes.
- Reporting loadings without the extraction method. Component loadings from principal components analysis are not the same quantities as common factor loadings from principal axis factoring, and a reader cannot tell which you ran if you do not say.
- Skipping the Total Variance Explained table. A structure that explains 38 percent of variance across four factors is telling you something the loading matrix cannot.
How to Report Factor Loadings in a Paper
State enough for someone else to reproduce the matrix: the analysis method, the extraction and rotation for EFA, the estimator for CFA, the sample size, and any items you removed with the reason.
- Report the number of factors and the rule that produced it, such as parallel analysis or the eigenvalue criterion.
- Give the rotation method and whether factors were allowed to correlate.
- Present the full loading matrix, not a cleaned-up version, with the primary loading in bold.
- Include communalities, and Cronbach’s alpha for each retained factor as a reliability follow-up.
- Note every deleted item and the criterion that deleted it.
Sample EFA paragraph: An exploratory factor analysis with principal axis factoring and Promax rotation was conducted on 18 items completed by 214 participants. Parallel analysis supported a four-factor solution, which explained 62.4 percent of the total variance. All loadings exceeded 0.42, with a range of 0.44 to 0.81. Three items with absolute loadings below 0.35 and cross-loading differences above 0.25 were removed, and internal consistency for the retained scales ranged from alpha = 0.79 to alpha = 0.91.
Sample CFA paragraph: A two-factor confirmatory model was estimated with maximum likelihood. The model fit adequately, chi-square = 118.4, df = 43, p = .001, RMSEA = .07, CFI = .95, SRMR = .06. All standardized loading estimates were significant at p less than .001 and ranged from 0.68 to 0.83. The first indicator for each factor was fixed to 1.00 to establish the factor metric, and its estimate is therefore not interpretable as an indicator of strength.
Frequently Asked Questions
Is a factor loading of 0.30 acceptable?
A loading of 0.30 sits at the bottom of the acceptable range. Most exploratory studies retain items at 0.40 or above, and 0.50 when the sample is small or each factor has few items. A 0.30 loading is defensible when the sample is large, the item is conceptually central to the scale, and its cross-loadings are small. Check the communality too: 0.30 squared gives 9 percent of the item’s variance, which is low on its own.
Why can a factor loading be negative?
A negative sign means higher scores on the item go with lower scores on the factor, given how both are coded. This is normal for reverse-worded items, where a respondent who strongly agrees is given a low numeric score. It is also a labeling convention, because factor signs are arbitrary and can flip between runs without changing the solution. A negative you did not expect usually points to a reverse-coding error instead.
What should I do with a cross-loading?
Measure the gap between the two loadings first. Under 0.20 and the item is clean, 0.20 to 0.25 deserves a note, and above 0.25 the item is ambiguous. Before deleting, check whether the two factors correlate strongly, since oblique rotation may be the honest description of a genuinely two-sided item. Otherwise, review the wording, correct it if it is ambiguous, and rerun before settling on removal.
Does a factor loading have to be statistically significant?
A point estimate alone tells you the size of the relationship, not the precision behind it. Standard errors or confidence intervals answer the precision question, and significance testing answers whether the value differs from zero. In exploratory work most published analyses report loadings without significance tests, since the retention thresholds already imply a minimum size. In confirmatory work significance is routinely reported alongside standardized estimates.
How do I interpret loadings differently in EFA and CFA?
In exploratory analysis the loadings are descriptive: they show which items cluster together and you use them to name and structure new factors, with retention thresholds around 0.40 or 0.50. In confirmatory analysis they are evidence of validity for a structure you already specified, so you expect values above 0.70 and read standardized estimates. Remember that the first indicator of each factor is fixed to 1.00 to set the scale and cannot be judged on strength.
Conclusion
Start with the loading matrix in front of you. Read each row, note the largest absolute value, and write down every other value worth mentioning so cross-loadings stay visible. Then read down each column to see whether a factor has enough strong items to name, and only then decide what to keep, fix or remove.
Once the pattern holds, the arithmetic is quick: square each retained loading for the communality, check the variance explained per factor, and run a reliability analysis on each retained scale. That sequence is the whole of how to interpret factor loadings in practice, and it takes less time than a second round of email about your appendix table.