
Analyzing Likert scale data correctly means treating each single response item as ordinal data. You report the full frequency distribution first, then reach for a non-parametric test such as the Mann-Whitney U test, unless you have combined several items into a validated composite score you can defend as interval data.
Most of the difficulty is a mismatch between what software shows you and what you can actually defend. SPSS and Excel will happily print a mean and a standard deviation for every attitude question, and neither number is automatically reportable. This guide walks through the sequence I use: check the coding, audit the raw responses, build a composite only when the items really measure one thing, verify reliability, describe the distributions, then pick the test that matches your design.
Allow about an hour for a small survey and longer for a full thesis dataset. The hard part is not clicking through menus. It is deciding, before you look at any p-value, what shape your data actually has.
Table of Contents
- 1What You Need
- 2Step-by-Step: How to Analyze Likert Scale Data Correctly
- 31. Check the Response Scale and Coding
- 42. Inspect the Data for Missing Values and Straight-Lining
- 53. Calculate a Composite Scale When Appropriate
- 64. Check Reliability and Describe the Responses
- 75. Choose the Right Test for Your Data Shape
- 86. Interpret Effects and Write the Results
- 9Common Mistakes and How to Fix Them
- 10Frequently Asked Questions
- 11Can I treat Likert scale data as interval data?
- 12What is the best statistical test for analyzing Likert scale data?
- 13Should I report the mean or the median for Likert items?
- 14What Cronbach’s alpha is acceptable?
- 15How do I handle missing responses in a Likert survey?
- 16How do I report Likert results in APA format?
- 17Conclusion
What You Need
Before you touch any analysis, gather five things. Without them you will end up answering a question your instrument never asked.
- Your response data in a table with one row per respondent and one column per item.
- A codebook listing the numeric codes, the response labels, and any missing value codes.
- Your research questions written out, because each one implies a test.
- Sample details: total N, the size of each subgroup, and whether responses are paired or independent.
- Software: SPSS, R, Stata, jamovi, JASP, or Excel all handle this, with more or less hand-holding.
One decision matters more than the rest. Is your construct measured by one question or by several? A single item like “My supervisor gives me useful feedback” is a Likert item. Four or five items covering the same idea form a Likert scale. The item is ordinal; the composite score behaves much more like an interval measure, which is what unlocks means, t-tests, and ANOVA. Popular survey software will mix both kinds of numbers into one output table, so make the distinction yourself before you read a single line of results.
Sample size planning belongs here too. Non-parametric equivalents need more respondents per cell than their parametric cousins to detect the same difference, so a subgroup split into cells of five or six will not tell you much no matter which test you choose.
Step-by-Step: How to Analyze Likert Scale Data Correctly
1. Check the Response Scale and Coding
Open your data file and confirm what the numbers actually mean before doing anything statistical. A code of 5 might mean “strongly agree” or it might mean “strongly disagree” depending on how the survey platform exported it.
Open the value labels dialog in your software (Variable View, then Labels in SPSS) and set the codes explicitly. A standard five-point coding runs: strongly disagree = 1, disagree = 2, neutral or neither = 3, agree = 4, strongly agree = 5. Confirm the minimum and maximum values that exist in the file match that range, and identify the missing value code so your software does not treat a blank or a “did not answer” as a genuine 3.
Check whether any items are worded negatively, such as “I rarely feel supported by my team”. Those need reverse coding before anything else happens. On a five-point scale, a 1 becomes a 5, a 2 becomes a 4, a 3 stays a 3, a 4 becomes a 2, and a 5 becomes a 1. In SPSS this is a simple recode into a new variable; in R it is 6 - x for a five-point item and 8 - x for a seven-point item.
2. Inspect the Data for Missing Values and Straight-Lining
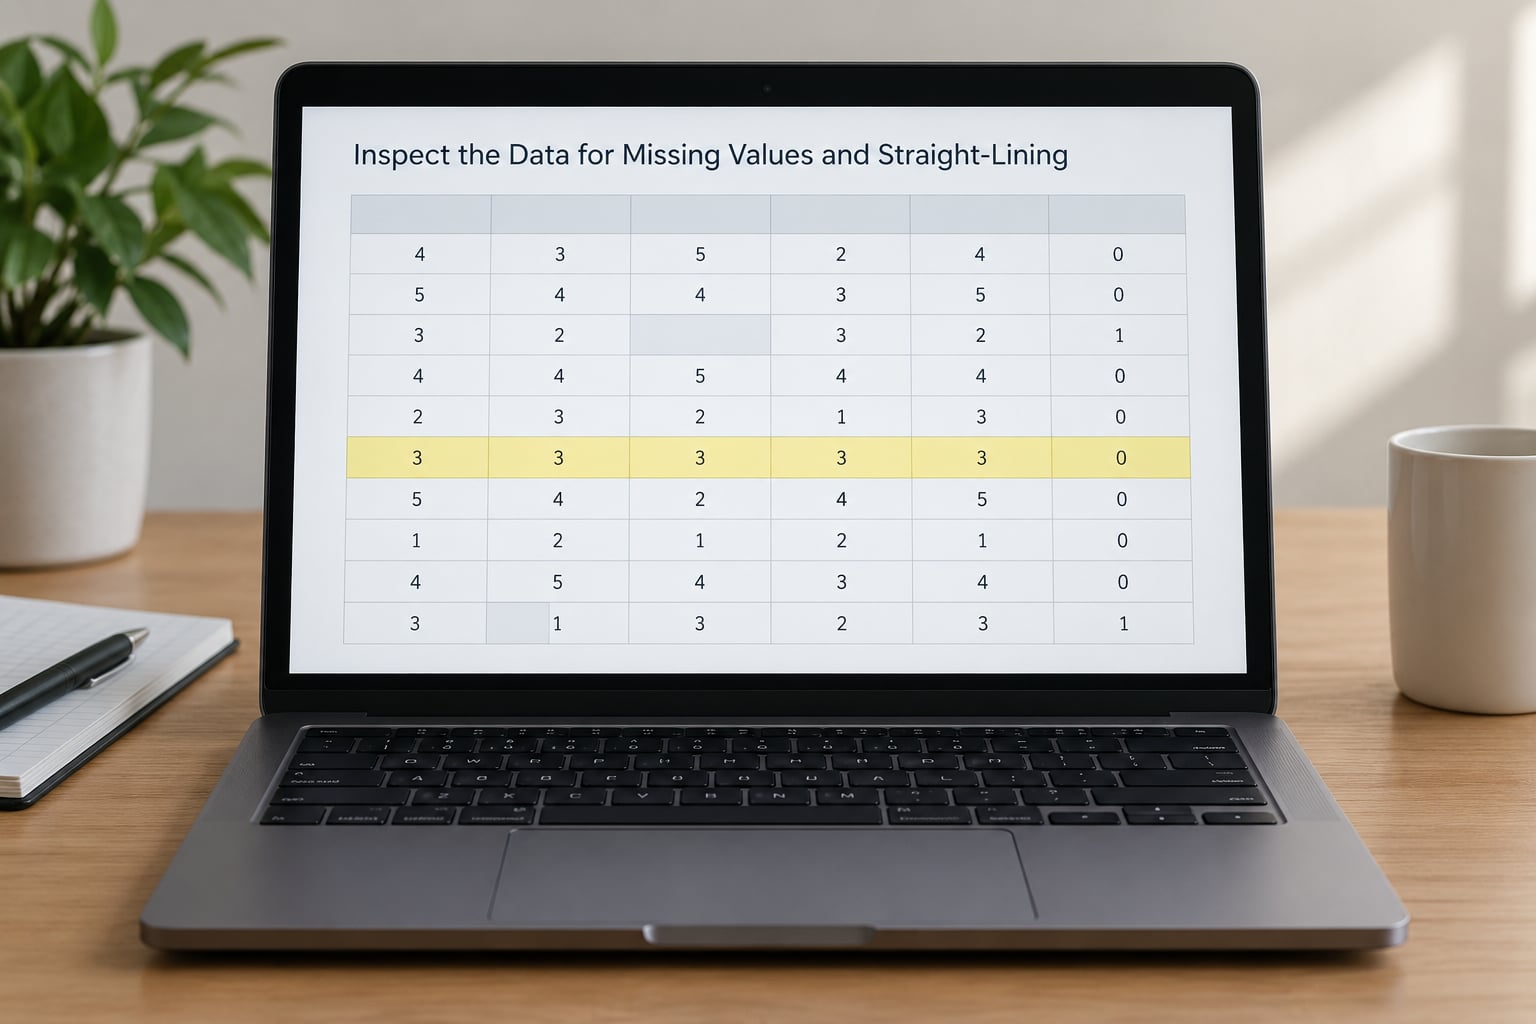
Run a frequency table on every item and read it rather than skim it. You are looking for three things: missing responses, impossible values, and response patterns that signal inattentive answering.
Missing data is normal in surveys. Decide your rule before you see how much there is, and report the rule alongside the results. Listingwise deletion is the simplest choice and wastes responses, so use it only when the missing share is small. If more than a fifth of a scale is missing for a respondent, that respondent usually has no meaningful composite score.
Straight-lining happens when someone picks the same option for every item on a multi-item scale. Compute the standard deviation across each respondent’s items; near-zero values flag these cases for inspection. My rule is to exclude a row only when several items are missing and the pattern is uniform, and to document how many rows that removed. Deleting straight-liners on suspicion alone is not defensible.
Also check completion time if your platform recorded it, and check that no respondent skipped the scale to reach the end of the survey.
3. Calculate a Composite Scale When Appropriate
Averaging items is defensible only when the items were designed to measure one construct and the data supports it. Two or three items is thin; four to ten is the usual working range. If your items measure different things, averaging them produces a number that means nothing.
Once reverse coding is done, average the valid responses per respondent. Decide and document your minimum threshold first: many analysts require at least 75% of items answered before computing a mean. Report how many respondents that excluded.
Then do a quick sanity check. Compute the correlation matrix among items. If items intended to measure the same construct correlate poorly with each other, something is wrong with the wording, the instructions, or your assumption about the construct. That is a finding worth reporting rather than hiding behind a composite score.
4. Check Reliability and Describe the Responses
Reliability is a gate, not a footnote. The r/statistics consensus is blunt about this: check Cronbach’s alpha for each scale and check individual items before you sum anything. An alpha below .70 means the items are not hanging together as a coherent measure, and averaging them produces a composite with no construct validity behind it.
Read the thresholds carefully. .70 is a common floor for exploratory work, .80 is a reasonable target for basic research, and .90 or above may indicate the items are too similar rather than unusually consistent. A high alpha is not automatically a good scale. Judge it in context, and report the number of items alongside the value, because alpha depends heavily on how many items you average.
Also look at corrected item-total correlations. An item that correlates weakly or negatively with the rest is usually the problem, not the scale. With a small number of items you can drop and re-check; with a large instrument, confirm the structure with factor analysis instead.
Now describe the data properly. For each item, report the frequency and percentage at every response option, the median, and the number of valid responses. For composite scores, report the mean, standard deviation, minimum, maximum, and n. Visualise single items with a diverging stacked bar chart centred on the neutral midpoint, which makes agreement, disagreement, and neutral mass visible at a glance. Never show a single averaged bar for one item; it hides exactly the shape you need to see.
5. Choose the Right Test for Your Data Shape

Match the test to the design, not to the test that gives you the result you hoped for. The best statistical test for Likert scale data depends on four things: whether you are working with one item or a composite, whether you have one group or several, whether observations are independent or paired, and what you are trying to detect.
| Your data shape | Test for ordinal data | Test if a composite or large sample justifies it |
|---|---|---|
| One item, two independent groups | Mann-Whitney U test | Independent-samples t-test |
| One item, same people measured twice (pre/post) | Wilcoxon signed-rank test | Paired-samples t-test |
| One item, three or more independent groups | Kruskal-Wallis H test | One-way ANOVA |
| One item, three or more repeated measurements | Friedman test | Repeated-measures ANOVA |
| Two ordinal items, asking whether they move together | Spearman rank correlation | Pearson correlation |
| Distribution of responses across categories in two groups | Chi-square test of independence | Not applicable; categorical by nature |
The classic error is treating an ordinal item as if the gap between “disagree” and “neutral” were the same size as the gap between “agree” and “strongly agree”. It usually is not, and with few points the mean of a single item is not a defensible summary.
The opposing error is to take “never use parametric tests” as absolute law. Norman (2010) showed that for balanced Likert data with five or more points, t-tests and ANOVAs on individual items hold up well against their non-parametric counterparts, particularly at larger samples. The practical rule I use: composite scores almost always justify parametric tests; single items need a large sample, a reasonably balanced distribution, and an explicit justification in your write-up. Say why you chose the test, not just which one you chose.
Watch ties and small groups. Mann-Whitney and Wilcoxon lose power with heavy ties, so report the tie-corrected statistic your software gives you. When you compare the same item across several subgroups, apply a multiple-comparison correction such as Bonferroni or Holm, or your family-wise error rate will drift well above 5% across a dozen demographic splits.
A worked example makes the mechanics concrete. Suppose a service quality scale has four items, and you want to compare a pilot group of 42 with a control group of 38. Cronbach’s alpha for the four items is .84, so the composite is trustworthy. Composite means are 3.9 (SD 0.7) in the pilot group and 3.2 (SD 0.8) in the control group. An independent-samples t-test gives t(78) = 4.12, p < .001, with a mean difference of 0.70 and a 95% confidence interval of 0.37 to 1.03. The Cohen’s d of 0.94 is a large effect. Your write-up: “Pilot group respondents reported significantly higher composite service quality (M = 3.9, SD = 0.7) than controls (M = 3.2, SD = 0.8), t(78) = 4.12, p < .001, d = 0.94.” That sentence is reportable because every number in it came from a defensible source.
6. Interpret Effects and Write the Results
A p-value tells you whether an effect is unlikely under the null, not whether it matters. Report an effect size alongside it: rank-biserial correlation for Mann-Whitney and Wilcoxon, epsilon squared for Kruskal-Wallis and Friedman, and Cohen’s d or Hedges’ g for parametric tests. Give confidence intervals wherever the test supports them, since a wide interval tells the reader the estimate is imprecise.
Write the result in plain language and stop at association unless your design supports a causal claim. “Piloted staff reported higher composite scores after training” is supportable. “Training improved morale” is not, unless you randomised and controlled everything else.
In APA 7th style, report the test statistic with its symbol, the degrees of freedom or sample size, the p-value without a leading zero, and the effect size. For non-parametric tests the degrees of freedom do not apply, so give the statistic and the n: “A Mann-Whitney U test showed that department A (Md = 4) rated workload higher than department B (Md = 3), U = 612, p = .03, r = .21.” That r is the rank-biserial correlation expressed small, and it belongs in the sentence.
Common Mistakes and How to Fix Them
Almost every methodological problem I see in student Likert analyses falls into one of these patterns.
| Mistake | Why it is wrong | Fix |
|---|---|---|
| Reporting the mean and SD for a single item | A single item is ordinal, so category gaps are not equal | Report frequencies, percentages, and the median |
| Averaging items without a reliability check | You may be averaging things that measure different constructs | Run Cronbach’s alpha and item-total correlations first |
| Computing alpha before reverse coding | Negatively worded items drag alpha down artificially | Reverse code, then compute alpha |
| Using only the mean to visualise a distribution | It hides the share of neutral responses and the spread | Use a diverging stacked bar chart per item |
| Ignoring ties in Mann-Whitney or Wilcoxon | Ties reduce power and distort the null distribution | Use the tie-corrected output and report the correction |
| Comparing many subgroups with no correction | Family-wise error inflates with every extra test | Apply Holm or Bonferroni and say so |
| Dropping neutral responses before analysis | It changes the construct and discards real opinions | Keep neutral; treat it as a genuine category |
| Reporting a p-value with no effect size | Statistical significance says nothing about practical importance | Pair every p-value with an effect size and a confidence interval |
| Comparing subgroups with very small cells | Non-parametric tests lose power, so null results mislead | Report small cells as exploratory and merge only with justification |
| Claiming causation from a cross-sectional survey | Group differences do not establish direction | Use association language unless the design is experimental |
Two extra reporting habits pay off. State how many items each alpha covers and how many respondents each test used, because reviewers check those numbers first. And run the analysis once with the neutral category removed as a sensitivity check; if your conclusion flips, that is important to disclose.
Frequently Asked Questions
Can I treat Likert scale data as interval data?
For a single item, no. The response options are ranked but the distance between adjacent categories is unknown, so treat it as ordinal. For a multi-item composite score that shows adequate internal reliability, most researchers do analyse the averaged score with means and parametric tests, and that practice is well supported in the robustness literature. State your reasoning explicitly in the methods section either way.
What is the best statistical test for analyzing Likert scale data?
It depends on the data shape. Use the Mann-Whitney U test for one item across two independent groups, the Wilcoxon signed-rank test for the same people measured twice, Kruskal-Wallis for three or more independent groups, Friedman for three or more repeated measurements, Spearman correlation for two ordinal items, and a chi-square test of independence to compare response distributions across groups. Composite scores can justify t-tests or ANOVA.
Should I report the mean or the median for Likert items?
Median and mode for single items, because those summaries do not assume equal spacing between response categories. Report the mean only for a composite score with acceptable reliability, alongside its standard deviation. Whatever you report, give the full frequency distribution first, since the shape of the responses tells the reader more than any single central tendency figure.
What Cronbach’s alpha is acceptable?
Around .70 is the usual floor for exploratory work and .80 is a reasonable target for basic research, but no single cutoff is universal. Values above .90 sometimes indicate items that are near-duplicates rather than a strong scale. Always report the number of items, since alpha rises with item count, and check corrected item-total correlations to find any item that does not fit.
How do I handle missing responses in a Likert survey?
Set a rule before you inspect the missing share, then report the rule and the number of cases it removed. Listingwise deletion is simple but wastes responses, so keep it for small amounts of missing data. Require a minimum proportion of items answered before computing a composite score, and report how many respondents that excluded.
How do I report Likert results in APA format?
Give the test statistic with its symbol, the degrees of freedom for parametric tests or the sample size for non-parametric ones, the p-value without a leading zero, and an effect size. For a single item, also report the median and the distribution of responses. Use association language unless your design is experimental enough to support a causal claim.
Conclusion
Four things to do first, in order. Verify the coding and value labels so your numbers mean what you think. Audit the raw responses for missing values, straight-lining, and impossible values. Decide whether your items form a reliable composite or must stay separate. Then pick the test that matches your design and write the result with an effect size attached.
The rest follows. If you get those four right, the software is a detail, and your conclusion will hold up to the questions a reviewer or a committee member asks about it.