
Probability sampling uses random selection, so every member of the population has a known, non-zero chance of being chosen. Non-probability sampling uses non-random selection, so inclusion depends on convenience, judgement or quota and some members have no chance at all. That single difference decides whether you can report a margin of error and generalise your findings to a wider population.
Most students meet this distinction in a research methods class and then meet it again in an exam question that asks for the difference between probability and nonprobability sampling, usually in 500 words. The answer that scores well is short and structural: define both, list the types, name the strengths and weaknesses, and say which one you would use for your own study and why.
This guide covers both approaches in that order, with worked numeric examples you can reuse in an assignment. I’ve kept the statistics in plain language, since the reasoning matters more than the formulas. The last reviewed for 2026, and nothing here depends on a specific textbook edition.
Table of Contents
- 1Difference Between Probability and Nonprobability Sampling at a Glance
- 2What Is Probability Sampling?
- 3Simple random sampling
- 4Systematic sampling
- 5Stratified sampling
- 6Cluster sampling
- 7Why the probability value matters so much
- 8What Is Nonprobability Sampling?
- 9Convenience sampling
- 10Quota sampling
- 11Purposive sampling
- 12Snowball sampling
- 13A misconception worth correcting
- 14How the Difference Between Probability and Nonprobability Sampling Affects Results
- 15Why probability samples support broader statistical claims
- 16Why nonprobability samples still produce valuable findings
- 17The four practical consequences
- 18How the Difference Between Probability and Nonprobability Sampling Affects Cost and Feasibility
- 19Which Should You Choose?
- 20Frequently Asked Questions
- 21What are the differences between probability and non-probability sampling in research?
- 22What are examples of nonprobability sampling?
- 23When should you use probability sampling?
- 24What are the four types of probability sampling?
- 25Can findings from non-probability studies be generalised?
- 26Do non-probability samples have a margin of error?
- 27Conclusion
Difference Between Probability and Nonprobability Sampling at a Glance
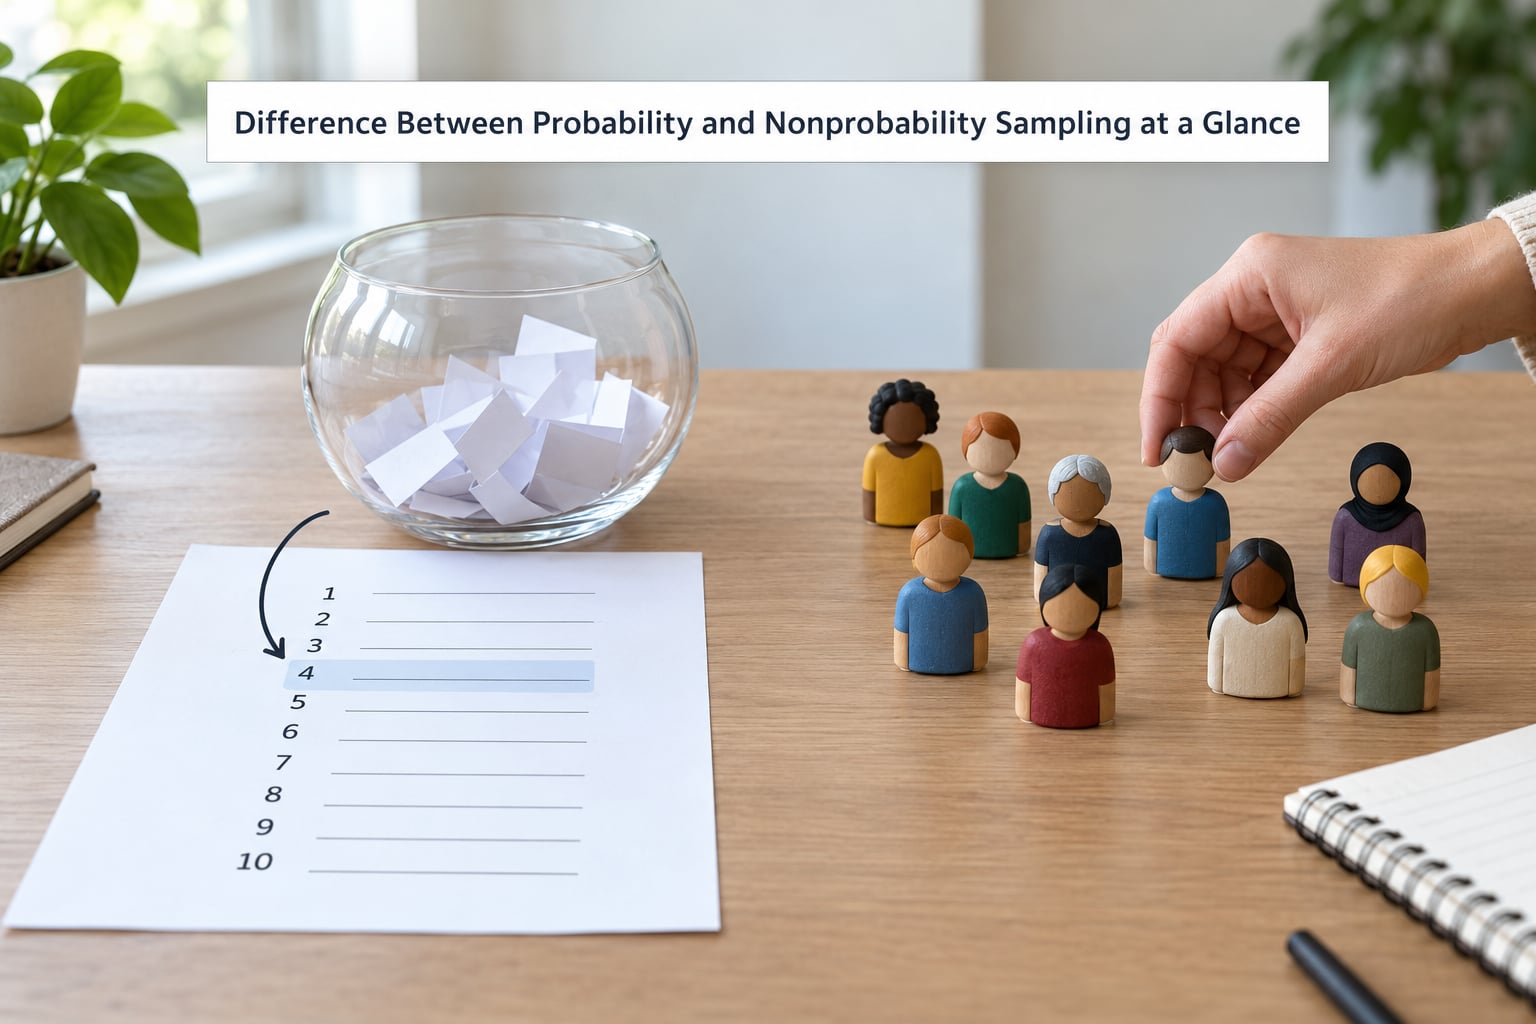
| Criterion | Probability sampling | Non-probability sampling |
|---|---|---|
| Basis of selection | Random selection using a chance mechanism | Non-random selection by convenience, judgement or quota |
| Chance of inclusion | Known and non-zero for every member | Unknown, and zero for many members |
| Sampling frame | Required, plus a randomisation mechanism | Not required |
| Margin of sampling error | Can be calculated | Cannot be calculated in the usual way |
| Generalisability | Supports inference to the target population | Limited to the people actually reached |
| Risk of sampling bias | Low, though badly built frames still cause problems | Higher, and usually hard to measure |
| Cost and time | Higher, especially for frame construction | Lower and faster |
| Role of researcher judgement | Limited to design decisions | Central, since judgement picks who is in |
| Typical use | Population estimates, prevalence studies, official statistics | Pilot studies, qualitative interviews, rare or hidden populations |
Both columns describe legitimate research designs. The difference is that the probability column supports statistical inference to a wider population, while the non-probability column supports rich description of the people and situations you were able to reach. Acknowledging that limit is what makes a nonprobability study credible rather than weak.
What Is Probability Sampling?
Probability sampling selects every member of the target population through a random mechanism, and the researcher can state each member’s probability of selection in advance. Simple random sampling with a 4,000-person population and a sample of 100 gives every person an inclusion probability of 100 ÷ 4,000, or 0.025, that is 2.5 percent. Because that number is known and non-zero for everyone, the design supports formal statistical inference.
Simple random sampling
Every member of the sampling frame is given a number, a random number generator produces 100 unique numbers, and the matching records are contacted. It is the cleanest design because no group is favoured, and the easiest to explain in a methodology section. The catch is a good one: you need a complete list of the whole population, and building that list is often the most expensive part of the study.
Systematic sampling
You calculate a sampling interval by dividing the population size by the sample size, then pick a random starting point and count through the list by that interval. With 4,000 records and a sample of 100, the interval is 40, so you contact record 27, then 67, then 107, and so on. It is faster than simple random sampling and gives the same inclusion probability. It fails when the list has hidden order, such as records sorted by age or by sales value, because that order creates a repeating pattern the interval can lock onto.
Stratified sampling
The population is split into subgroups called strata that are internally similar but differ from each other, and a sample is drawn from every stratum. Suppose a survey covers 32,000 urban residents and 8,000 rural residents; proportional stratified sampling of 400 people would draw 320 from urban areas and 80 from rural ones. You can also use disproportionate allocation and then weight the results back to the true population proportions. This design is worth choosing whenever a small but important subgroup would otherwise vanish from a simple random sample.
Cluster sampling
Instead of splitting the population into similar groups, you use groups that already exist and are internally mixed, then take everyone from some of them. A school district might have 60 schools; you randomly pick 6 schools and survey every student in those 6. It is far cheaper than sampling across the whole district, which is why governments and health agencies use it constantly. Multi-stage designs add random selection inside each chosen cluster.
Why the probability value matters so much
Inference relies on the idea that the sample could have come out differently. With a known inclusion probability, a statistic such as a mean or a proportion has a calculable standard error, which produces a margin of sampling error and a confidence interval. That is why probability samples support claims about a population and why a t-test, an ANOVA or a regression can be defended as valid for the sample you drew.
What Is Nonprobability Sampling?
Nonprobability sampling selects participants without a random mechanism, so no one can say what anyone’s chance of inclusion was. You might interview whoever is in the building today, or you might choose people because they fit a profile. The design is not a shortcut; it is the correct choice when no usable sampling frame exists, when the population is small and hidden, or when the research question is exploratory.
Convenience sampling
Participants are whoever is easiest to reach: students in your own classes, followers of a page you run, people leaving a lecture hall. It is fast and free, and it carries the largest bias risk, because the people nearby are rarely a balanced cross-section of the target population. Student samples over-represent younger, more educated and more engaged respondents, which shows up in almost every finding.
Quota sampling
The researcher sets quotas for characteristics such as age or region and fills them with anyone who fits, which controls the visible mix without randomising who is picked within each category. A market researcher might require 200 respondents, 100 men and 100 women, 50 aged 18 to 24. Quotas fix one kind of imbalance while leaving selection bias inside each group untouched, so they are usually described as a compromise rather than a probability method.
Purposive sampling
Participants are chosen deliberately because they have knowledge or experience relevant to the question. Interviewing eight hospital managers to understand a referral bottleneck is purposive sampling. So is recruiting only experienced users for a usability test. The method gives you depth on a specific issue, and the judgement about who is appropriate is part of the method rather than a flaw in it.
Snowball sampling
Each participant recruits further participants, which is how researchers reach populations with few entry points: people who use an unregulated drug, survivors of a rare condition, members of a closed professional community. The network grows through referral chains, so people with more connections are over-represented. Researchers mitigate this by asking several seeds for referrals and by checking whether new contacts resemble the original group in relevant ways.
A misconception worth correcting
Nonprobability sampling is often described as the qualitative method, but it works in quantitative research too. A market research panel, a rapid customer satisfaction tracker and an opt-in political poll are all nonprobability designs that produce numbers. The real dividing line is not soft versus hard data; it is whether the sample supports generalisation to a wider population, and only probability sampling does that by design.
How the Difference Between Probability and Nonprobability Sampling Affects Results
Why probability samples support broader statistical claims
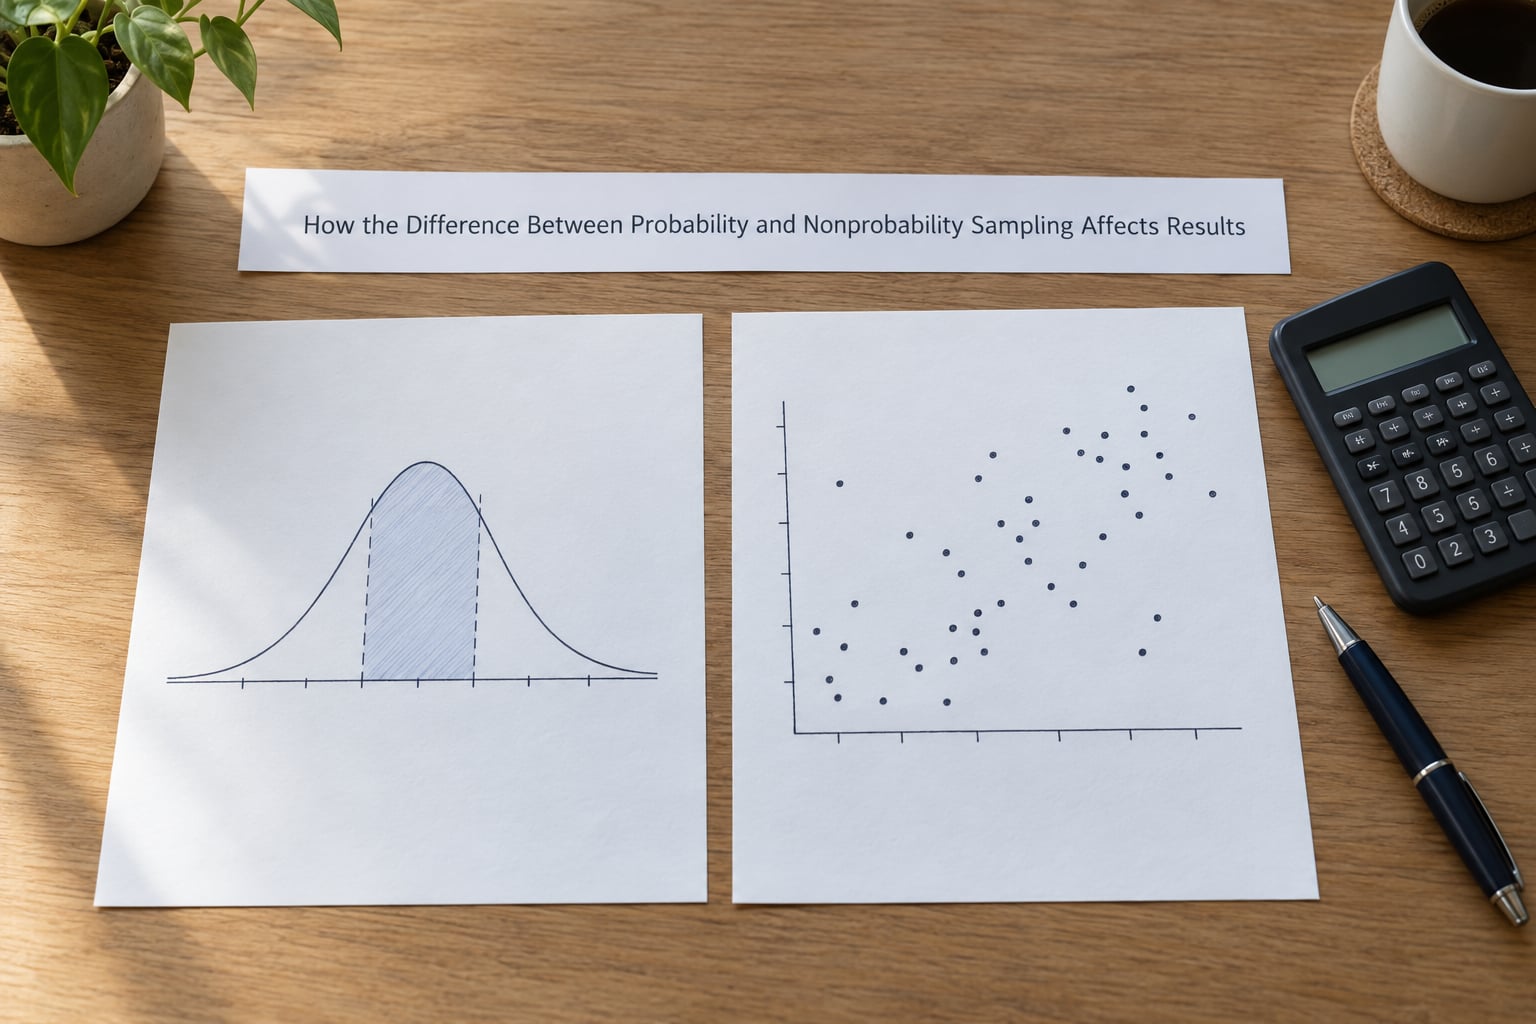
Random selection spreads systematic differences across the sample, so the sample tends to mirror the population on characteristics that matter to the study. Combined with a known inclusion probability, that produces a measurable margin of sampling error: for a 1,000-person simple random sample, a proportion near 50 percent carries a margin of roughly plus or minus 3.1 percentage points at 95 percent confidence. You can state that figure, attach a confidence interval to your estimates and defend the analysis statistically.
The catch is that the guarantee is only as good as the frame. If the list of 1,000 people excludes everyone who does not have a landline, the random sample inherits that coverage error. Frame quality has to be assessed separately from selection method.
Why nonprobability samples still produce valuable findings
Without a known inclusion probability, there is no way to calculate how far the results might have moved by chance, so a conventional margin of error does not apply. What the data does support is analysis of the people studied: patterns within the sample, themes in interviews, reasons behind a behaviour. For exploratory work, hypothesis generation and qualitative depth, that is often the more useful output.
Practitioners also use post-stratification weighting to reduce known imbalances, matching respondents to population distributions on age, sex, region and education. Weighting corrects imbalances you already know about, and it cannot repair coverage bias from people who were never reachable. Market researchers describe opt-in online panels as a workable design when coverage error is manageable, which is a fair argument even though the sample is still not a probability sample.
The four practical consequences
- Sampling bias: low and quantifiable in probability samples, present but unmeasurable in nonprobability samples.
- Representativeness: expected to mirror the population by design, versus achieved only by chance in convenience and referral samples.
- Generalisability: supports population-level conclusions, versus restricted to the sampled group or setting.
- Researcher judgement: shaped once at the design stage, versus operating continuously through every selection decision.
How the Difference Between Probability and Nonprobability Sampling Affects Cost and Feasibility
Probability sampling is expensive mainly because of the frame. Constructing an accurate list of 4,000 households, obtaining consent to contact them, chasing non-response and tracking who replied is administrative work that has nothing to do with the analysis. Random-digit dialling and address-based sampling add equipment and trained interviewers to that list. Stratified and cluster designs cut the cost by sampling from a subset of the population rather than all of it, which is why multi-stage cluster designs are standard for national household surveys.
Nonprobability sampling removes most of those burdens. There is no frame to build, no systematic non-response to chase and no need to track selection probability. A pilot questionnaire can be sent to a customer list in an afternoon, and a set of stakeholder interviews can be arranged in a week.
Sometimes the cost gap is not merely inconvenient but decisive. Hospitals may have no list of patients with a rare condition, and companies often cannot enumerate all the small firms in their sector. In those cases a probability sample is not an expensive option; it is an impossible one. Designing the nonprobability sample carefully, then stating plainly what it can and cannot support, is a better study than an abandoned attempt at random selection.
Which Should You Choose?
Choose probability sampling when you need to estimate a population figure, test a hypothesis formally or report a margin of error. Choose nonprobability sampling when the population is unknown or unreachable, when the aim is exploration or qualitative depth, or when time and budget rule out a frame. The research question should decide, not the method you find easiest.
Work through five questions in order:
- What claim will you make? If the answer is a percentage of a defined population, you need a probability sample.
- Does a usable sampling frame exist? No frame means no random selection, whatever your preference.
- Do you need inferential statistics? Confidence intervals and population tests assume known inclusion probabilities.
- What is your time and budget? Compare the cost of building and maintaining a frame against the value of the estimate.
- Is the population rare, hidden or newly formed? If so, nonprobability recruitment is the realistic option.
A worked case shows how the two coexist. A national party polling a weekly voting intention, where one wrong percentage point matters, would use a probability design such as random-digit dialling or address-based sampling so it can quote a margin of error. A new product team testing two packaging designs among existing customers before committing to production would use a nonprobability sample drawn from its customer list, because speed and full coverage of the list matter more than a population estimate.
One point of confusion is worth naming directly. Stratified sampling takes a portion from every group you created and drew; cluster sampling takes everything from some groups that already existed. You sample from all groups, or you sample whole groups, and never both at once in the same design.
Frequently Asked Questions
What are the differences between probability and non-probability sampling in research?
Probability sampling uses random selection, so every member of the target population has a known, non-zero chance of being chosen, and the researcher can calculate a margin of sampling error. Non-probability sampling selects participants by convenience, judgement, quota or referral, so inclusion probabilities are unknown, no conventional margin of error applies, and generalisation beyond the people reached is not statistically supported.
What are examples of nonprobability sampling?
Common examples include convenience sampling, where you survey people who are easy to reach such as your classmates; quota sampling, where you fill fixed quotas for age or gender; purposive sampling, where you deliberately recruit people with relevant expertise; and snowball sampling, where each participant refers others. Market panels and opt-in online polls are larger nonprobability designs.
When should you use probability sampling?
Use probability sampling when you need to estimate a population quantity, measure prevalence, produce official statistics or run inferential tests that require a confidence interval. It is also the right choice when reviewers will question whether your sample represents the population. The method requires a usable sampling frame and a randomisation mechanism, so it needs more time and money than a nonprobability design.
What are the four types of probability sampling?
The four types are simple random sampling, where each member has an equal independent chance; systematic sampling, where every nth member is chosen using an interval of N divided by n; stratified sampling, where the population is split into similar subgroups and a sample is taken from each; and cluster sampling, where pre-existing groups are chosen and every member of those groups is surveyed.
Can findings from non-probability studies be generalised?
Not in the statistical sense. Without a known inclusion probability there is no way to estimate how much the results might have varied by chance, so you cannot attach a margin of error and cannot claim the sample represents a population. You can still generalise analytically to similar settings, and weighting on known characteristics such as age or region can reduce visible imbalances.
Do non-probability samples have a margin of error?
No conventional margin of error applies, because the formula depends on the inclusion probability and the sample design, and neither is known for a non-probability sample. Reporting a figure would imply a probability-based randomisation that did not take place. Some researchers report only the sample size and the known characteristics of respondents, then discuss limits in the text instead.
Conclusion
Choose probability sampling when every member of the population should have a known chance of selection and your conclusions need to extend beyond the people you surveyed. Choose nonprobability sampling when accessibility, cost, exploration or hard-to-reach populations make random selection unrealistic, and describe your sample honestly. Start by writing down your population, your research objective and the level of generalisability you actually need, because that answer picks the method for you.