
Stratified random sampling works by splitting your target population into non-overlapping groups called strata, then drawing a simple random sample inside each one. Used correctly, it guarantees that small but important subgroups appear in your study in workable numbers and usually cuts your sampling error compared with a simple random sample. The whole procedure takes about an hour once your population list exists, and the hard part is deciding the strata before you ever touch a random number generator.
This guide walks through the practical version: building the frame, picking the strata, allocating the sample, drawing the participants, checking the result, and writing the method into your paper. Every number below can be re-derived by hand, so you can defend the design to a supervisor or a reviewer.
Table of Contents
- 1What You Need
- 2Step-by-Step: How to Use Stratified Random Sampling in a Study
- 31. Define the population and sampling frame
- 42. Choose meaningful strata
- 53. Decide how many participants to select from each stratum
- 64. Check that every stratum has enough eligible participants
- 75. Select participants randomly within each stratum
- 86. Verify the final sample
- 97. Document the sampling method in the study
- 10How to Use Stratified Random Sampling in a Study: Worked Example
- 11Common Mistakes
- 12Frequently Asked Questions
- 13Can you give me an example of a stratified sample?
- 14When should you use stratified random sampling?
- 15How do you calculate sample size for stratified sampling?
- 16What are some examples of stratified sampling questions?
- 17How do you get respondents in stratified sampling?
- 18How many strata should a study have?
- 19Conclusion
What You Need
Before sampling starts, gather six things. Anything missing here is the reason most stratified designs fall apart later.
- Your study protocol. The target population, the key variables, the subgroup analyses you plan to run, and the precision you need. The strata should follow from these, not the other way round.
- A complete sampling frame. A list of every unit in the population with enough detail to contact it: student IDs, patient records, customer accounts, parcel addresses, school registers. A frame with gaps undercuts the whole method, because missing units bias every stratum they should have belonged to.
- Population counts per stratum (Nh). You cannot allocate a sample without knowing how big each group is, and a total N on its own will not do.
- A total sample size (n). Set it before allocation, from a power calculation or a margin-of-error calculation, not from what you can afford to survey afterwards.
- A random number generator. A spreadsheet column with =RAND() or =RANDARRAY(), a free online generator, or the sampling function inside your statistical software.
- A place to record the draw. A spreadsheet with one row per unit, a codebook, and a written log of the seed or generation method. Auditors and reviewers ask about this more often than you would expect.
Statistical software helps but is not required. R, Stata, SAS and SPSS can all store a stratified design correctly, which matters later when you compute standard errors that account for the design. If you plan to report estimates for subgroups, plan the software now rather than after data collection.
Step-by-Step: How to Use Stratified Random Sampling in a Study
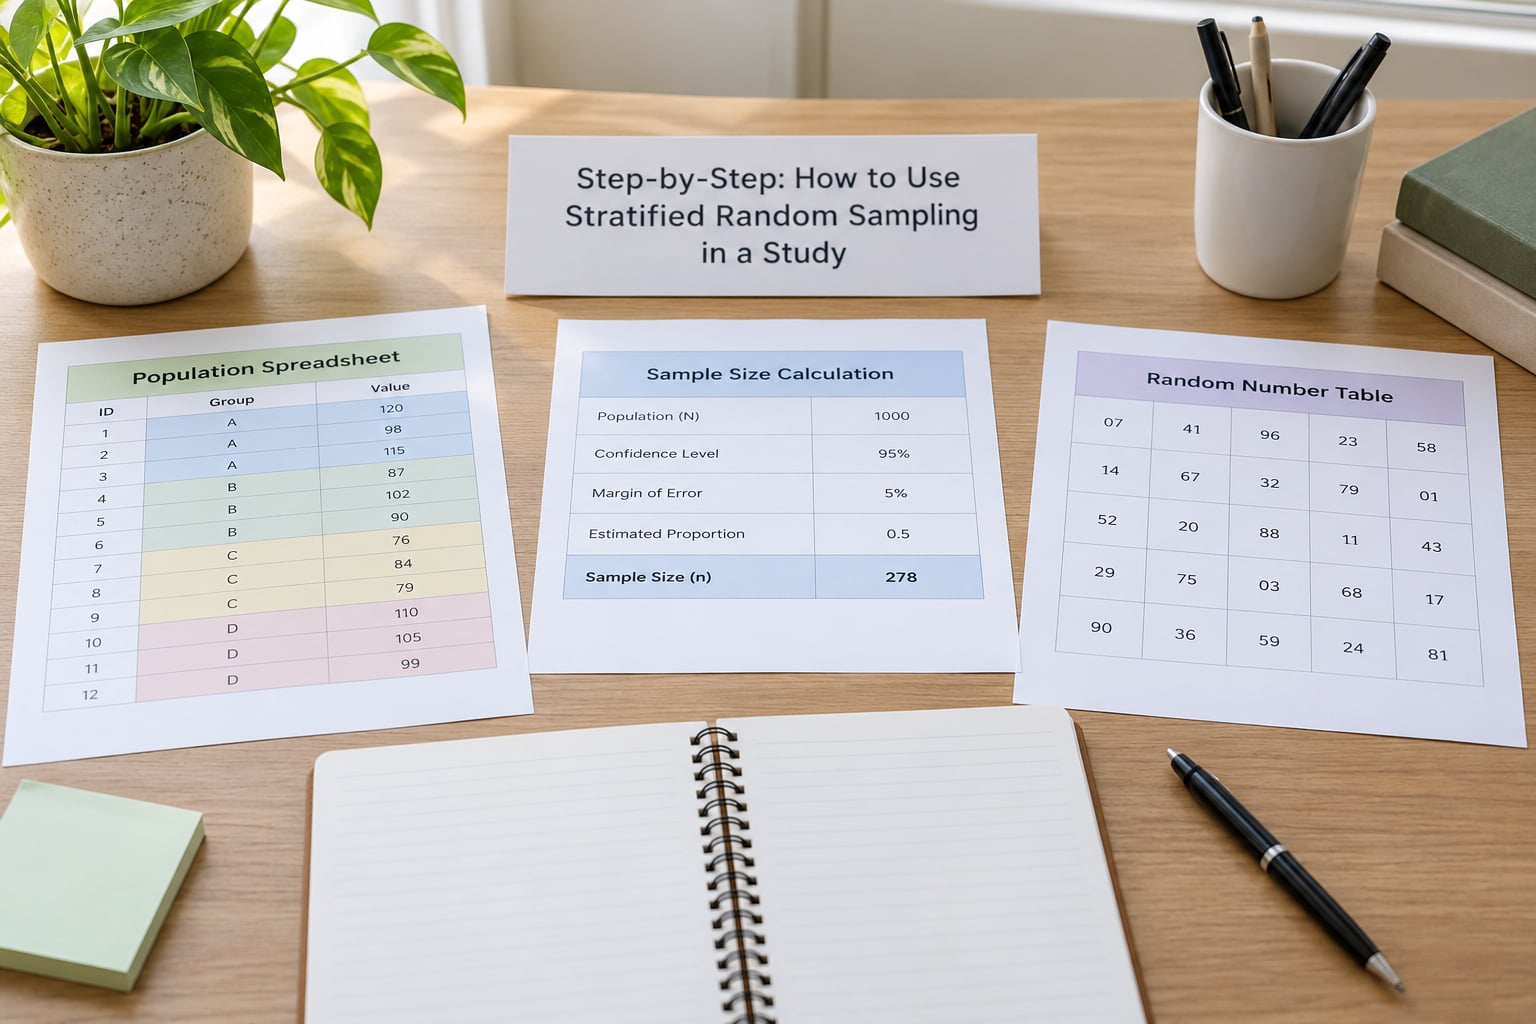
1. Define the population and sampling frame
Write the target population as a specific set of people, places or records with stated boundaries: which students, which years of enrolment, which campuses, which time period. A vague population such as “college students” cannot be sampled, because no list matches it.
Then build the sampling frame: the operational list of every unit in that population. Fix the unit of analysis at the same time, whether that is a person, a household or a classroom. Two units on the same record, a withdrawn student left in the register, or a duplicate customer account all inflate Nh and quietly distort the allocation, so de-duplicate and screen for eligibility before you count anything.
You know the frame is sound when you can state the number of eligible units, describe the source and its date, and name the units that are missing and why.
2. Choose meaningful strata
Choose strata from variables connected to the outcome or to a subgroup analysis you intend to run: age band, sex, region, clinic site, income bracket, year of enrolment, treatment arm. Typical choices in published work include age and sex for population opinion polling, hospital site for clinical trials, income band for market research, and grade level for school assessments.
The test is simple. If a stratum were dropped, would your estimate or your subgroup claim change? If not, drop it. Strata that have nothing to do with the research question only dilute the sample and force you to draw handfuls of units per group.
Two rules keep a design defensible. Every unit goes in exactly one stratum, so strata must be mutually exclusive and cover the whole frame. And define each boundary in writing, because “low income” and “under 25” mean different things to different coders.
3. Decide how many participants to select from each stratum
Set the total n first, then split it. Three allocation methods are in common use.
| Method | Rule | Use it when |
|---|---|---|
| Proportional | nh = n × (Nh / N) | The sample should mirror the population. This is the default for most survey research. |
| Neyman (optimum) | nh ∝ NhSh | Variance differs a lot between strata, for example a small stratum with extreme variability. Needs an estimate of Sh from earlier work. |
| Equal (disproportionate) | nh = n / m | Every subgroup must support its own analysis, or a rare group needs a floor. You must weight the analysis afterwards. |
Rounding will not add up on its own. Work from the raw decimals, keep the whole parts, and hand the leftover units to the strata with the largest fractional remainders. In the worked example below this gives clinic C the extra unit rather than the largest clinic.
Once counts are fixed, write them down as a sampling plan. A version that changes after invitations go out is not a plan.
4. Check that every stratum has enough eligible participants
Small strata are the usual failure point. As a working rule, a stratum holding fewer than about 30 respondents cannot support a stable subgroup estimate, and a stratum drawn from a frame of fewer than 30 units leaves you no randomness worth speaking of.
Where a group is too small, you have four honest options. Merge it with a neighbouring stratum that shares its characteristics, draw every unit in it and record that the group was a census, raise its allocation above the proportional share, or drop it and explain the loss of coverage in your limitations.
Oversampling is legitimate and common. What makes it illegitimate is oversampling and then analysing the data as if the sample were proportional, because the over-represented group then carries too much weight in every overall figure.
5. Select participants randomly within each stratum
Selection inside a stratum is a simple random sample, and it needs a real random mechanism. Filter or sort the frame to one stratum, attach a random number to every row, sort by that number, and take the top nh. Ties are broken by a second random column, not by row order, and a fixed seed makes the draw reproducible for an auditor.
Do the same for every stratum and combine the selections. Never draw once from the whole frame and then sort by subgroup, since that is an ordinary simple random sample with extra steps and none of the precision gains.
Keep the full frame file with the random column and a selected flag rather than a separate list of names. When someone asks how a particular participant entered the sample, you can answer in seconds.
6. Verify the final sample
Compare the achieved sample with the plan: counts per stratum, response rate per stratum, and missing or duplicate records. If one stratum responds at 25% and another at 70%, proportional representation has already broken and your realised sample no longer matches your design.
Compare realised shares against population shares stratum by stratum, not just overall. Track your response rates from the first wave, since chasing non-responders in the weakest stratum is far cheaper than discovering the imbalance at the analysis stage.
Replace non-responders only by drawing fresh random numbers from the same stratum and the same frame. Swapping in whoever is easiest to reach turns a probability sample into a convenience sample.
7. Document the sampling method in the study
A methods section should let a reader rebuild your draw. Record the target population and its boundaries, the source and date of the frame, the unit of analysis, the stratification variables with their cut points, the total sample size, the allocation method, the formula or rounding rule used, the random number procedure with its seed or software version, how many units were invited and how many responded per stratum, every replacement, and the software used.
Where allocation was not proportional, state the design weight and how it entered the analysis. A ready template:
A stratified random sample was drawn from [population description] using [frame source, date] as the sampling frame. Participants were stratified by [variables and cut points] into [m] mutually exclusive strata. The total sample size of [n] was determined by [power or margin-of-error calculation] and allocated to strata [proportionally to stratum population size / using Neyman allocation / equally across strata]. Within each stratum, [n_h] units were selected by simple random sampling using [random number generator and seed]. A total of [invited] units were invited and [responded] responded ([response rate]%). [Add: Because allocation was disproportionate, design weights of [weight description] were applied to all estimates, and variance estimates accounted for stratification.] Analyses were conducted in [software and version].
How to Use Stratified Random Sampling in a Study: Worked Example
Suppose a hospital network wants to survey patient satisfaction across four clinics. The frame holds 11,000 eligible patients in the last twelve months, and a power calculation gives n = 400 for estimating satisfaction within each clinic at 95% confidence.
| Clinic | Nh | Nh / N | n × share | Allocated nh | Weight Nh / nh |
|---|---|---|---|---|---|
| A | 6,000 | 0.5455 | 218.18 | 218 | 27.52 |
| B | 3,000 | 0.2727 | 109.09 | 109 | 27.52 |
| C | 1,500 | 0.1364 | 54.55 | 55 | 27.27 |
| D | 500 | 0.0455 | 18.18 | 18 | 27.78 |
| Total | 11,000 | 1.0000 | 400.00 | 400 | 27.5 |
The allocated column sums to 399, so one unit goes to clinic C, whose fractional remainder of 0.55 is the largest. Clinic D receives 18 respondents, which clears the practical floor of 30 only if you pool it with C for analysis, or you raise D deliberately and accept a disproportionate design.
Invite those 400 randomly drawn patients. Suppose responses arrive at 34% in clinic A, 41% in B, 48% in C and 17% in D: realised counts of 74, 45, 26 and 3. The sample is no longer proportionally representative, and the 3 in clinic D cannot support a clinic-level estimate. The fix is a documented second wave drawn at random from the non-responders in the same strata, plus weights reflecting the realised response pattern.
Had the study over-sampled clinic D on purpose, giving it 60 instead of 18, the overall satisfaction figure would need the design weights above, and standard errors should be computed with the strata declared. Stata’s svyset strata, psu(id) followed by svy: mean satisfaction, or R’s svydesign(ids = ~1, strata = ~stratum, weights = ~weight) in the survey package, handles this. SPSS stores the same information through Data > Weight Cases > Weight cases by PSU and strata, using the design weight variable.
Those weights are close to equal here, so the design effect m × Σwh2 / (Σwh)2 comes out near 1.0. Make one stratum heavily over-sampled and the same formula climbs above 1, meaning your effective sample size falls below the nominal 400 and your margin of error widens. Disproportionate allocation buys precision for one subgroup at the cost of the overall estimate.
Common Mistakes
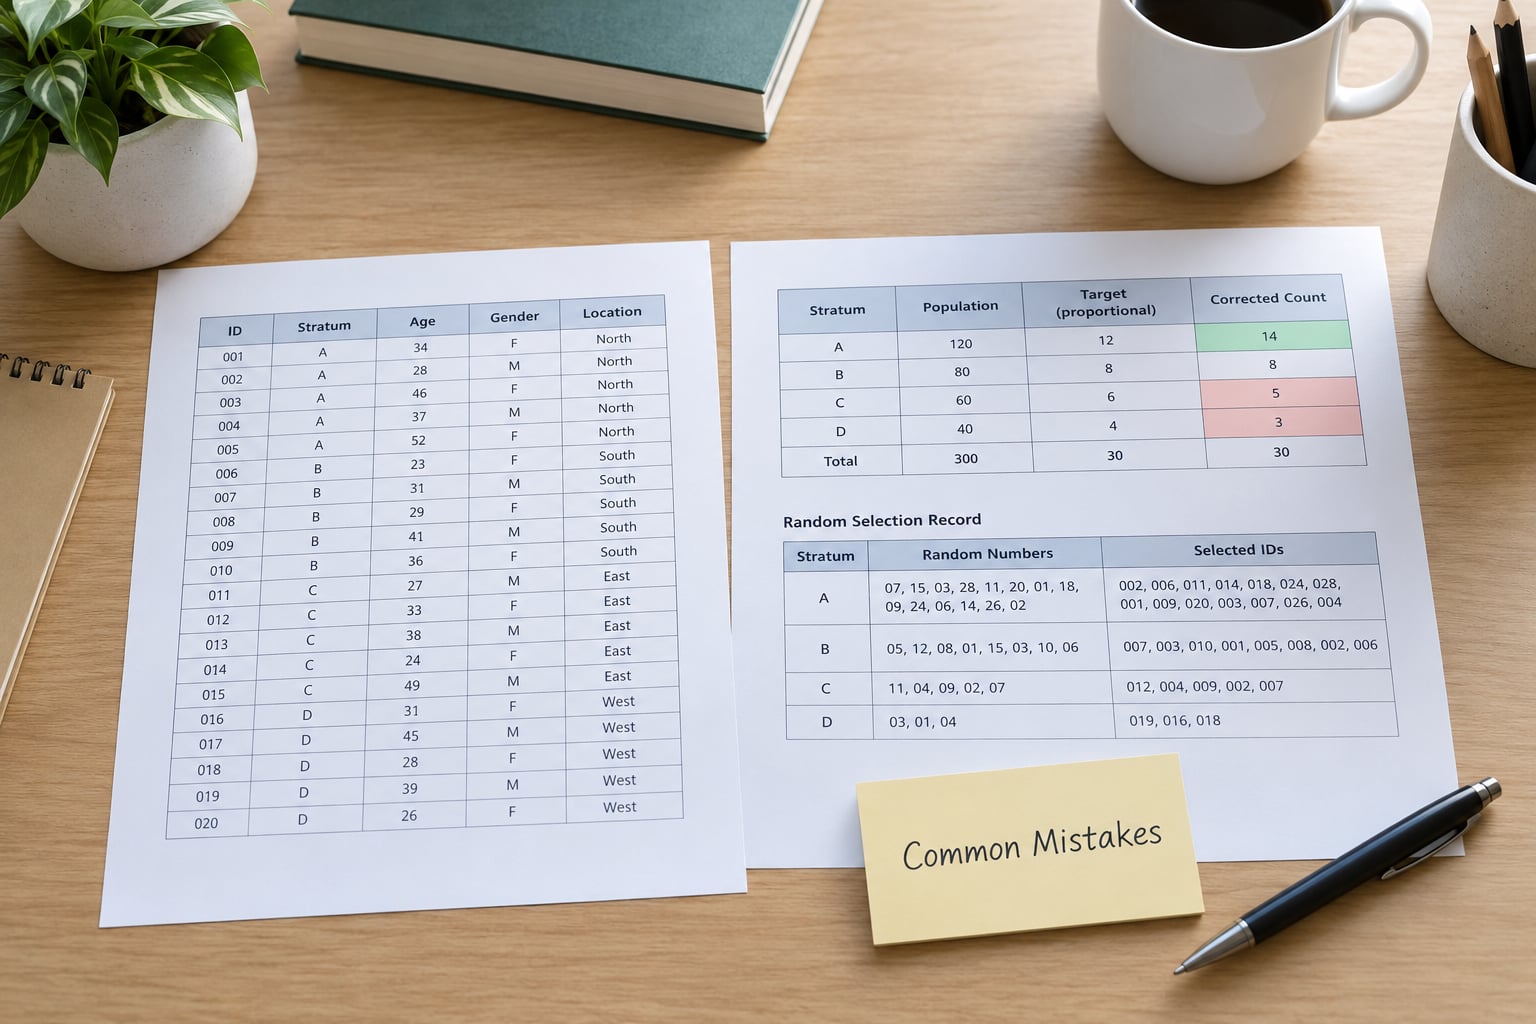
These are the errors that come up most often, each with the correction that fixes it.
- Using too many strata. Two-way breakdowns of age, sex and region quickly leave one to three units per group. Cap the number of strata so every one keeps at least about 30 selected units.
- Ignoring small or unavailable groups. Check Nh before allocating, then merge, census the tiny group, oversample it deliberately, or state that you dropped it.
- Analysing a disproportionate sample without weights. Build the weight variable before analysis and declare the strata in the software, or every overall estimate is biased toward the over-represented group.
- Replacing non-responders by convenience. Substitute by drawing the next random number in the same stratum, and log the replacement.
- Defining strata from information collected after sampling. Variable and response-based allocation is a legitimate technique, but it is post-stratification, not pre-stratification, and it must be labelled accurately.
- Using an incomplete sampling frame. A list that omits unregistered students, walk-in patients or households without internet access produces undercoverage that no allocation method can repair.
- Forgetting the finite population correction. When n is a large share of N, the standard error is smaller than the uncorrected formula suggests. With N = 11,000 and n = 400, the correction factor is about 0.964.
- Overstating what stratification delivers. It reduces sampling error for the variables you stratified on and guarantees representation for the strata you defined. It does not correct frame bias, and it says nothing about measurement error or non-response bias.
One last distinction worth making explicit. Stratified random sampling is a probability sampling design drawn from a real population of units. Stratified k-fold cross-validation is a machine learning technique that splits a dataset for model tuning, and stratified train-test splits do the same thing in code. The word is shared; the purpose is not.
Frequently Asked Questions
Can you give me an example of a stratified sample?
Survey 400 students from a university of 12,000 by splitting the frame into four age groups and drawing 80, 160, 120 and 40 students at random, so each age group appears in the same proportion as in the whole student body. The same design works for clinic sites, income bands or regions: list every unit, split the list into groups, then draw a simple random sample within each group rather than from the combined list.
When should you use stratified random sampling?
Use it when subgroups matter to your analysis and simple random sampling might leave one of them nearly empty, and when you have a reliable frame listing every population member. It suits population surveys, clinical trials across multiple sites, market research by income or age, and school assessments. Do not use it when the frame is incomplete, when subgroup estimates are not needed, or when convenience is the real constraint.
How do you calculate sample size for stratified sampling?
Start with the total sample size from a power or margin-of-error calculation, then allocate it across strata. Proportional allocation uses n_h = n u0026times; (N_h / N). Neyman allocation gives more units to strata with both large populations and high variability. Equal allocation puts the same n in every stratum, which helps small subgroups but requires weighting. Round carefully, because raw decimals will not sum to the target total.
What are some examples of stratified sampling questions?
In survey work this usually means the questions you ask within each stratum, written so they apply to every group. Examples include satisfaction with waiting time by clinic site, study completion by age band, spending by income bracket, or device preference by region. Strata can also be defined by a screening question, such as age or employment status, that classifies respondents before they answer the main battery.
How do you get respondents in stratified sampling?
Draw the sample randomly first, then recruit every selected unit using the same contact procedure across strata: the same number of reminders, the same channels, the same time window. Track response rates by stratum so a weak group is visible early. For non-responders, draw replacement numbers from the same stratum and frame rather than substituting easier-to-reach people, and keep a record of every substitution.
How many strata should a study have?
As many as your subgroups genuinely require and as many as your sample size can support, which usually means every stratum should end up with at least 30 selected units. Crossing three variables such as age, sex and region can create dozens of cells, and most of them will be too thin to analyse. Check the cell sizes before you sample, then merge small groups, census them, or accept a design with fewer strata.
Conclusion
To use stratified random sampling in a study properly, the order of operations is fixed: define the population, build a complete frame, split it into strata that matter to your research question, set the total sample size, allocate it across strata, draw randomly inside each one, then weight and verify before you analyse anything.
Start with the first three today, since they need no software. Count the population in each candidate stratum, and if any group would end up with fewer than about 30 selected units, decide now whether to merge it, census it or oversample it deliberately. Write the allocation and the rounding rule into your sampling plan, because a design you can show in three lines is the one that survives review.
Standard descriptions of this method date to Cochran’s Sampling Techniques (1977) and are set out in Lohr’s Survey Sampling; the AAPOR standard definitions cover the reporting language. As of 2026 most statistical packages handle the weighting and variance estimation once you declare the strata and the weights, but the design itself still has to be right before any of that matters.