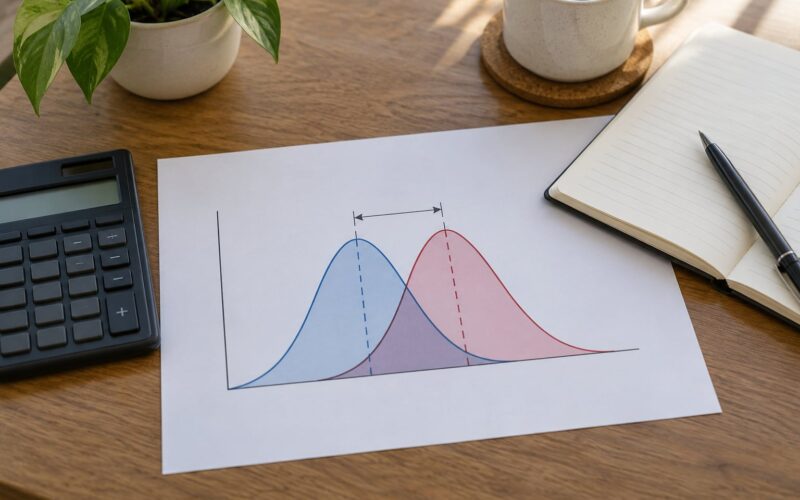
A null and alternative hypothesis are two opposing statements about a population parameter. The null hypothesis (H0) says no effect, no difference or no relationship and always contains an equality symbol (=, ≤, or ≥). The alternative hypothesis (Ha, also written H1 or H-a) states the effect you are testing for and always contains an inequality symbol (≠, <, or >).
Learning how to write a null and alternative hypothesis takes about ten minutes once you know the four pieces you need. Get those right and the symbols follow almost automatically. I’ve been through hundreds of these homework threads, and the same three words (“at most,” “no more than,” “is it true that”) account for most of the confusion.
This guide gives you a five-step process you can repeat for any study, a lookup table that turns claim words into the right comparison symbol, and worked examples for population means, proportions, chi-square tests and regression coefficients. It’s written for a statistics or research methods course, and it also works if you need to state hypotheses in a paper’s methods section. Updated for 2026.
Table of Contents
- 1What You Need Before You Start Writing
- 2Step-by-Step: How to Write a Null and Alternative Hypothesis
- 3Step 1: Identify the Population and Variable
- 4Step 2: Decide Whether the Hypothesis Is Directional
- 5Step 3: Write the Null Hypothesis
- 6Step 4: Write the Alternative Hypothesis
- 7Step 5: Check That the Hypotheses Are Testable
- 8What Happens After You Write Them
- 9Common Mistakes to Avoid
- 10Frequently Asked Questions
- 11What is the difference between a null hypothesis and an alternative hypothesis?
- 12Does a null hypothesis always mean there is no effect?
- 13How do I write a null and alternative hypothesis in plain language?
- 14When should I use a directional alternative hypothesis?
- 15Do I need to write both the null and alternative hypothesis?
- 16How do hypotheses change for a t-test, ANOVA, chi-square or regression?
- 17Conclusion: What to Do First
What You Need Before You Start Writing
You cannot write either hypothesis until you can name four things: the population, the variable, the comparison value, and the direction of your claim. Everything else in this guide is bookkeeping on top of those four.
| What you need | Where it comes from | Example |
|---|---|---|
| The research question or word problem | The prompt your instructor or study gives you | Do students who use the study app score higher on the final exam? |
| The population | The group your question is really about, not just your sample | All undergraduates at your university |
| The variable | What is being measured, and in what unit | Final exam score, in points |
| The parameter and comparison value | The symbol (μ or p) and the number your claim compares it to | μ compared with 78 points |
| The statistical test | One mean, two means, one proportion, chi-square, correlation | One-sample t-test |
| The direction of the claim | Does the claim predict higher, lower, or either? | Higher, so one-tailed |
Write those answers on scratch paper before you touch the symbols. Students who skip this step end up writing a beautiful, well-formatted hypothesis about the wrong parameter, which is the single most common way to lose marks.
One more thing worth settling early: which parameter you are talking about. A hypothesis is always a claim about a population parameter, never about the numbers in your sample.
| Population parameter (use this in a hypothesis) | Sample statistic (never use this in a hypothesis) |
|---|---|
| μ — population mean | x-bar — sample mean |
| p — population proportion | p-hat — sample proportion |
| σ — population standard deviation | s — sample standard deviation |
| ρ (rho) — population correlation | r — sample correlation coefficient |
If a problem hands you a sample mean like 84.3, that number belongs in your calculations, not in your hypothesis. Your hypothesis should read H0: μ = 78, not H0: x-bar = 78.
Step-by-Step: How to Write a Null and Alternative Hypothesis
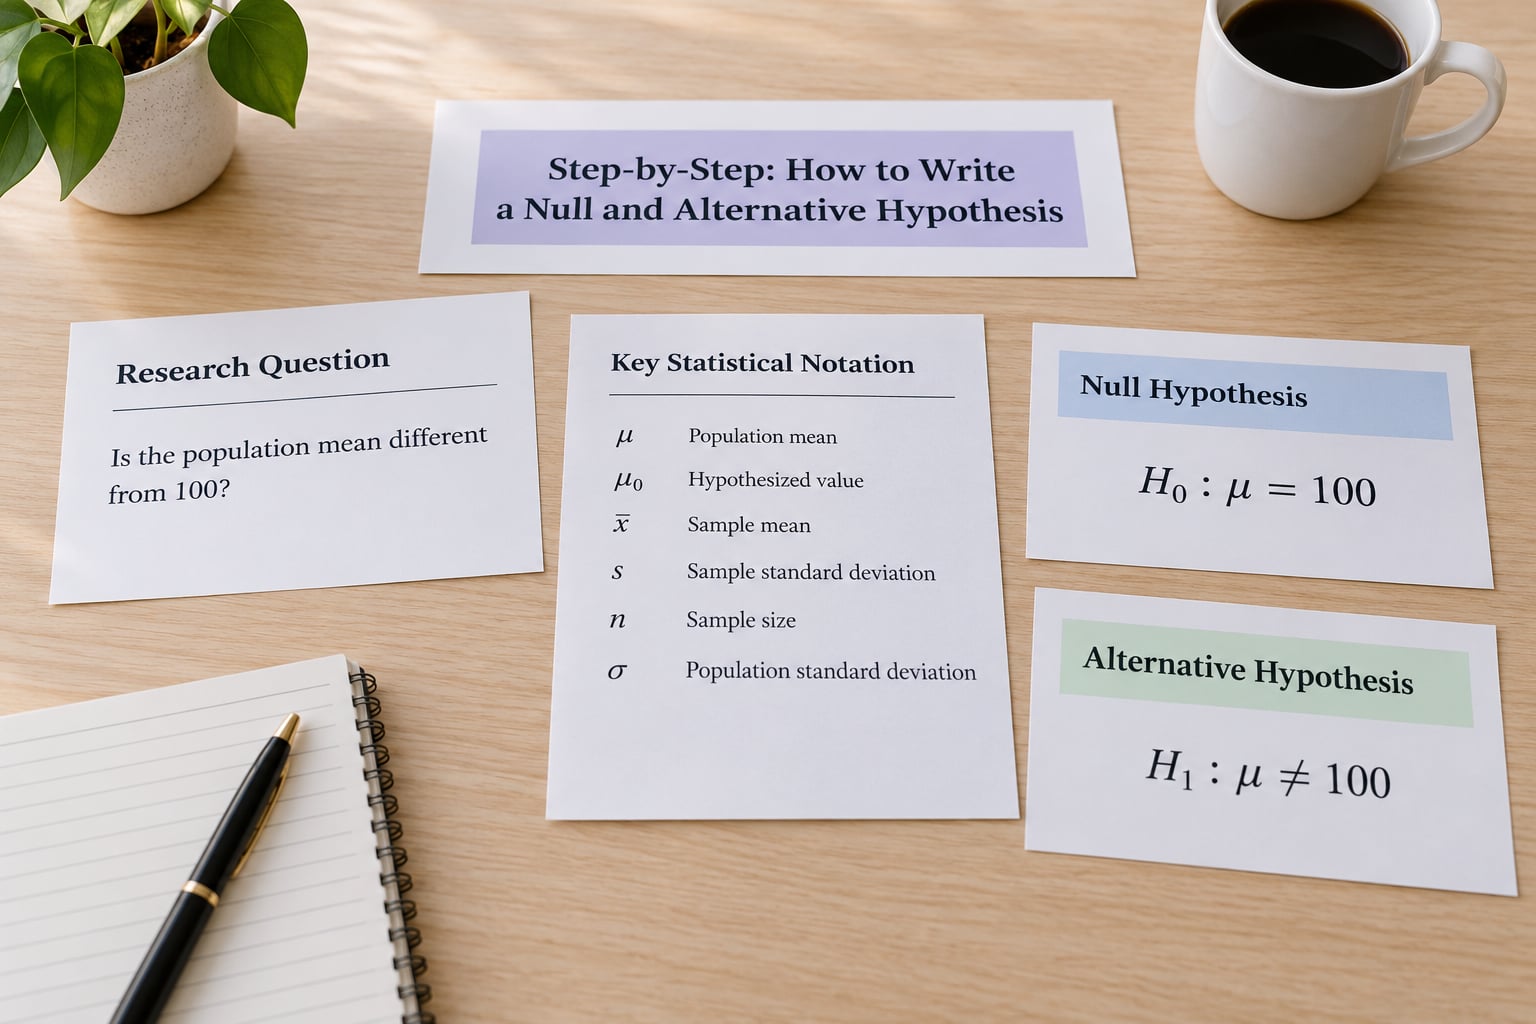
The procedure below works for any hypothesis test, from a one-sample proportion to a regression slope. Five steps, about two minutes each once you have practice.
Step 1: Identify the Population and Variable
Say, in one sentence, who the claim is about and what is being measured. Then name the symbol: μ for a mean, p for a proportion, μ1 − μ2 for a difference in means, or β (beta) for a regression slope.
Study question: Do sophomores who sleep fewer than 6 hours per night have a lower average GPA than 3.1?
Population: all sophomores at this university. Variable: GPA. Parameter: μ, the population mean GPA. Claim: lower than 3.1, compared against the value 3.1.
Check your sentence against the sample statistics you were given. If you cannot point to the parameter in it, you are describing a result rather than a hypothesis, and you should go back to the research question.
Step 2: Decide Whether the Hypothesis Is Directional
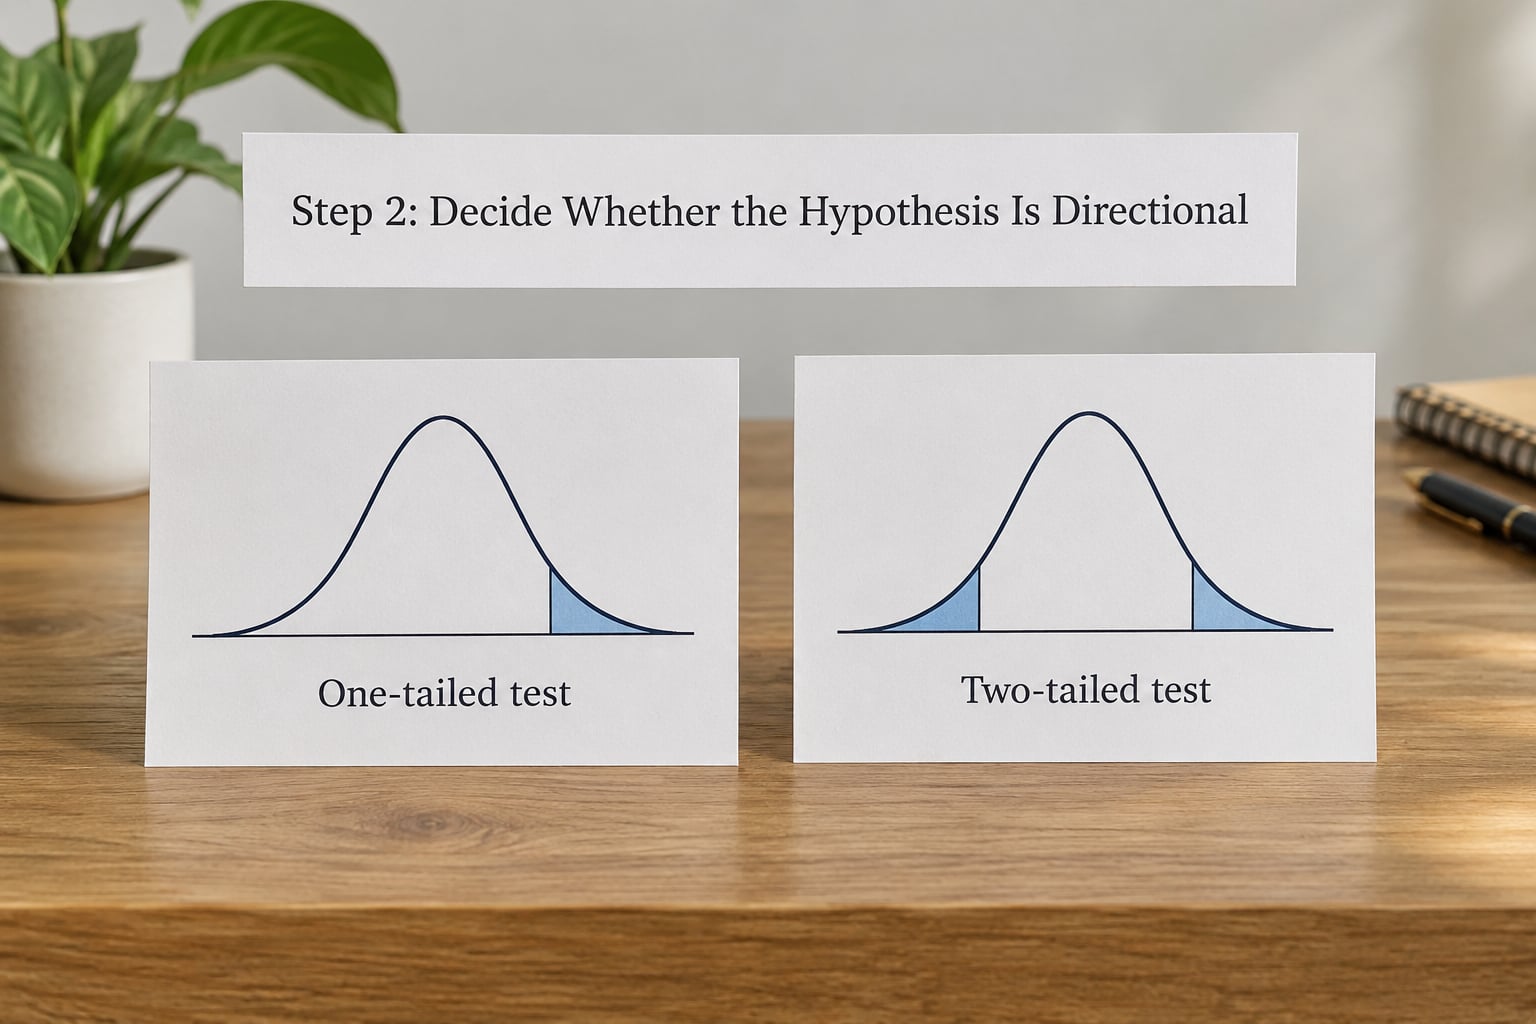
A directional claim (higher, lower, more, fewer, faster) gets a one-tailed alternative hypothesis with > or <. A claim that only predicts a difference, with no direction, gets a two-tailed alternative hypothesis with ≠.
In the GPA example the claim says “lower,” so this is a one-tailed test and the alternative will use <. If the question had asked only whether GPA “differs” from 3.1, it would be two-tailed and the alternative would use ≠.
Do not invent a direction to save yourself a decision. Choosing a one-tailed test after seeing the data inflates your chance of a false positive, and many instructors deduct marks for it. The direction has to come from the claim written before the data were collected.
Step 3: Write the Null Hypothesis
The null hypothesis states the default position: no effect, no difference, no relationship, or a specific value you are comparing against. It always contains an equality symbol, which can be =, ≤ or ≥.
The trick with directional words is that the null uses the boundary version of the claim. “Lower than 3.1” becomes μ ≥ 3.1. “Higher than 78” becomes μ ≤ 78. “Different from 78” becomes μ = 78.
For the GPA example: H0: μ ≥ 3.1, in words, the population mean GPA of sophomores who sleep under 6 hours is at least 3.1.
Step 4: Write the Alternative Hypothesis
The alternative hypothesis states the meaningful research claim, the one you would be able to report as a finding. It always contains an inequality symbol and it must be the exact logical opposite of the null.
For the GPA example: Ha: μ < 3.1, in words, the population mean GPA of those sophomores is less than 3.1.
Here is the lookup table I give my own students, because the wording-to-symbol step is where almost everyone stalls:
| Words in the claim | Null hypothesis symbol | Alternative hypothesis symbol | Test type |
|---|---|---|---|
| is equal to, is exactly, no change from | = | ≠ | Two-tailed |
| differs from, is not equal to, changed | = | ≠ | Two-tailed |
| higher than, more than, greater than, increases | ≤ | > | One-tailed |
| lower than, less than, fewer than, decreases | ≥ | < | One-tailed |
| at most, no more than, at or below | ≤ | > | One-tailed |
| at least, no less than, at or above | ≥ | < | One-tailed |
| no difference, no effect, no relationship, independent of | = (or = 0 for a difference or correlation) | ≠ (or ≠ 0) | Two-tailed |
| related, associated, affects, predicts | ρ = 0 or β = 0 | ρ ≠ 0 or β ≠ 0 | Two-tailed unless directed |
Read that table as a set of pairs, because the two hypotheses are locked together. The equality form in the middle column always determines the inequality form in the column beside it.
| Null hypothesis | Alternative hypothesis | Plain meaning |
|---|---|---|
| μ = 78 | μ ≠ 78 | The true average is exactly 78, or it is not. |
| μ ≤ 78 | μ > 78 | The true average is at most 78, or it is higher. |
| μ ≥ 78 | μ < 78 | The true average is at least 78, or it is lower. |
| p = 0.40 | p ≠ 0.40 | The true rate is exactly 40 percent, or it is not. |
| p ≤ 0.40 | p > 0.40 | The true rate is 40 percent or lower, or it is higher. |
Here are four full pairs, written the way you would put them in an assignment.
Example 1, population mean, two-tailed. A manufacturer claims a new router has an average download speed of 100 Mbps. H0: μ = 100 Mbps. Ha: μ ≠ 100 Mbps. The claim gives no direction, so this is a two-tailed test.
Example 2, population mean, one-tailed. A nutrition study asks whether a new supplement lowers average blood pressure below 120 mmHg. H0: μ ≥ 120 mmHg. Ha: μ < 120 mmHg.
Example 3, population proportion, one-tailed. A quality manager suspects more than 4 percent of parts from a line are defective. H0: p ≤ 0.04. Ha: p > 0.04.
Example 4, population proportion, two-tailed. A survey asks whether the proportion of students who work part-time differs from 30 percent. H0: p = 0.30. Ha: p ≠ 0.30.
Step 5: Check That the Hypotheses Are Testable
Before you submit, run these five checks. They take thirty seconds and catch nearly every mistake.
- Parameter check. Does each statement use μ, p, ρ or β rather than x-bar, p-hat or r?
- Symbol check. Does the null contain =, ≤ or ≥, and does the alternative contain ≠, < or > with no equality?
- Complement check. Take the null and negate it. Does it give you exactly the alternative you wrote?
- Match check. Is the wording of your claim consistent with the test you plan to run and the alpha level your instructor set?
- Wording check. Would a classmate reading only your two sentences know what population, what variable, and what comparison value you used?
Some textbook authors write the null with a plain equals sign even when the alternative is > or <, so H0: μ = 78 paired with Ha: μ > 78. That version is common and generally accepted, and your software will test it the same way. Just be aware that with = the rejection region is split across both tails, which is a different procedure from the one-tailed test the wording implies.
Different tests take different parameter shapes. Here is the same logic applied to the analyses you are most likely to meet:
| Analysis | Null hypothesis | Alternative hypothesis |
|---|---|---|
| One-sample t-test or z-test | μ = μ0 | μ ≠ μ0 (or > or < if directed) |
| Two independent means | μ1 − μ2 = 0 | μ1 − μ2 ≠ 0 |
| Paired means | μd = 0, where μd is the mean of the differences | μd ≠ 0 |
| One proportion | p = p0 | p ≠ p0 |
| Two proportions | p1 − p2 = 0 | p1 − p2 ≠ 0 |
| One-way ANOVA | μ1 = μ2 = … = μk | At least one mean differs |
| Chi-square test of independence | Variable A and variable B are independent | Variable A and variable B are associated |
| Correlation | ρ = 0 | ρ ≠ 0 (or ρ > 0, ρ < 0) |
| Simple linear regression slope | β = 0 | β ≠ 0 (or > 0, < 0) |
Note that the ANOVA and chi-square alternatives are written in words because there is no single parameter to put a symbol on. That is correct, not lazy: the hypothesis is about the whole set of means, or about the relationship between two categorical variables.
What Happens After You Write Them
Writing the hypotheses is the easy part; the decision rule that follows trips up a lot of students. You set a significance level alpha in advance, usually 0.05, compute a test statistic, and compare the resulting p-value to that alpha.
If the p-value is at or below alpha, you reject the null hypothesis. If it is above alpha, you fail to reject the null hypothesis. Note the wording: fail to reject, not accept. A non-significant result means the evidence was too weak to rule out the null, not that you have proven it true.
| Your decision | Actually true about the population | Name of the error | Chance of making it |
|---|---|---|---|
| Reject H0 | H0 is actually true | Type I error (false positive) | alpha, often 0.05 |
| Reject H0 | Ha is actually true | Correct decision | 1 − beta, the power of the test |
| Fail to reject H0 | H0 is actually true | Correct decision | 1 − alpha |
| Fail to reject H0 | Ha is actually true | Type II error (false negative) | beta |
Which error matters more depends on the setting. A drug screen that misses a real case is a Type II problem you would want to minimise. A smoke alarm that triggers on steam is a Type I problem you would rather accept. Your hypothesis wording should reflect that, and picking a one-tailed test is usually a decision about which error you are more willing to risk.
Your statistical software prints the hypotheses for you, which is useful for checking your work. SPSS output for a t-test shows a one-tailed significance value and a two-tailed one side by side, so you can confirm which tail your direction implies. R’s t.test() and cor.test() print an “alternative hypothesis” line stating whether the test was two-sided, less than, or greater than, and chisq.test() does the same for association. Stata reports the hypothesized alternative directly in the output header. Match those lines to what you wrote before you interpret anything.
Common Mistakes to Avoid
These are the errors that show up again and again in homework threads and in marked assignments. Each one has a straight fix.
- Putting an equals sign in the alternative hypothesis. Ha: μ = 80 and Ha: μ ≠ 80 are contradictory. If your alternative has an equality in it, it is a null. Fix: swap the two.
- Writing the hypothesis you want to prove as H0. Students see the claim stated first in the problem and assume that is the null. The claim is the alternative unless the wording genuinely says “no difference” or gives you a value to compare against. Fix: identify the parameter and comparison value first, then let the symbols fall out.
- Using sample numbers. H0: x-bar = 84.3 is not a hypothesis about a population. Fix: write μ = 84.3 if 84.3 is the published comparison value, or x-bar = 84.3 is not a hypothesis at all.
- Using “prove” or “reject” inside the hypothesis. Hypotheses are claims, not verdicts. Fix: “Ha: μ > 78” rather than “Ha: μ > 78, so we prove the drug works.”
- Writing a research question as a hypothesis. “Do students who use the app score higher?” is a question. Fix: convert it to “Ha: μ_app > μ_nonapp” and keep the question in your introduction.
- Choosing one-tailed after seeing the result. Fix: decide the direction from the claim. If you must look at the data first, report a two-tailed test.
- Saying “accept the null hypothesis.” This is the single most criticised phrase in the field and instructors mark it down. Fix: “fail to reject the null hypothesis.”
- Mixing notation across sources. You will see H-a, Ha, H1 and H-A all used in different textbooks and software output. They are labels, not different hypotheses. Pick one and be consistent; H0 with Ha is the most common convention.
- Leaving the two hypotheses overlapping. If both statements could be true at the same time, one is wrong. Fix: negate the null and check you get exactly the alternative.
One more trap worth naming, because it comes up in every stats forum: problems that say “is it true that the average is 78?” Here the statement to test is the null, so you write H0: μ = 78 and Ha: μ ≠ 78. The phrasing “is it true that” is the giveaway. When the problem instead says “does the new program increase scores?”, the claim goes in the alternative.
And a fair caveat. Some experienced researchers argue that this whole ritual misrepresents how evidence accumulates, and there is a real critique of significance testing along those lines. The mechanics still work for a course assignment and for reporting a single result, but a non-significant p-value is not proof of nothing, and one rejected null is not a discovery.
Frequently Asked Questions
What is the difference between a null hypothesis and an alternative hypothesis?
The null hypothesis is the default claim that there is no effect, no difference or no relationship, and it always contains an equality symbol such as =, less than or equal to, or greater than or equal to. The alternative hypothesis is the claim you are testing for, and it always contains an inequality symbol such as not equal to, less than, or greater than. The two are exact opposites, which is what lets a test compute a single p-value.
Does a null hypothesis always mean there is no effect?
No, and this trips people up. A null hypothesis can also state a specific value being compared against, such as a mean of 78 or a proportion of 0.30. Those are equality statements about a population parameter, not statements of no effect. The consistent rule is simpler: the null always contains an equality symbol, while the alternative never does.
How do I write a null and alternative hypothesis in plain language?
Write the null first as no difference, no effect, no relationship, or the specific comparison value, then write the alternative as the opposite with an inequality. For a mean of 78, the plain-language null is that the true average equals 78 and the alternative is that it is higher than 78. Put the symbols on the same line as the words so a reader can check both at once.
When should I use a directional alternative hypothesis?
Use a directional alternative when the claim names a direction, such as higher, lower, more or fewer, and that direction was fixed before any data were collected. The alternative then uses greater than or less than and the test is one-tailed. If the claim only says the value differs, or you are reporting a result you did not predict, use a two-tailed test with not equal to.
Do I need to write both the null and alternative hypothesis?
In most coursework you write both, because the pair defines the test and they must be exact logical opposites. In practice the software only ever needs the null and the alpha level, since the alternative is implied by it. But a written report or assignment should state both, so the reader can see which tail of the distribution was checked and why.
How do hypotheses change for a t-test, ANOVA, chi-square or regression?
Only the parameter changes, not the logic. A one-sample t-test compares a mean with a value, so H0 is mu equals the value. Two-group t-tests compare a difference in means against zero. ANOVA compares all group means for equality. Chi-square tests independence between two categorical variables, so the null says they are independent. Regression tests whether a slope equals zero.
Conclusion: What to Do First
Start with the population, the variable, the comparison value and the direction of your claim, written out in words. Everything after that is mechanical: put an equality symbol in the null, an inequality symbol in the alternative, and make sure the two are exact logical opposites.
If you take one habit from this guide, take the complement check. Negate your null hypothesis and see whether you get your alternative back word for word. That single test catches flipped pairs, wrong symbols, overlapping statements and mismatched tails, and it is the fastest way to know your answer is right before you submit.
Once the pair is written, write it in the methods section in the order null then alternative, add your alpha level, and state which tail the test checks. Then read your two sentences back as if you were the marker: population named, variable named, value named, direction clear. If a classmate can tell what you are claiming from your wording alone, how to write a null and alternative hypothesis is solved.