
To describe your study population and sampling frame, you need four things in writing: the group your study is about, the criteria that decide who belongs in it, the actual list you will draw participants from, and an honest account of who that list misses. Examiners read that paragraph looking for one thing, which is whether your claims about the wider population are supportable.
A sampling frame is the practical list or operational representation of every unit in your target population that you could realistically select from, and it is the pool your sample is actually drawn from. Your target population is the wider group your findings are meant to describe.
Three features carry most of the weight in a good description:
- It is a list of real, contactable units, not a description of a group in the abstract.
- It has a named source and a date, so somebody else could rebuild it.
- Its gaps are stated openly, with the resulting bias named alongside them.
If you are writing a dissertation or thesis methodology chapter, this section usually sits inside a larger research methods chapter and runs for roughly 400 to 700 words. It comes directly after your research design and before the sampling technique, because the technique only makes sense once the reader knows what it was selecting from.
Table of Contents
- 1What You Need
- 2Step-by-Step: How to Describe Your Study Population and Sampling Frame
- 31. Define the target study population
- 42. Separate the population from the sample
- 53. Identify the sampling frame
- 64. Check eligibility and coverage
- 75. Connect the frame to the sampling method
- 86. Write the methods paragraph
- 9Common Mistakes
- 10Frequently Asked Questions
- 11What is the difference between a study population and a sampling frame?
- 12Can a convenience sample be described as representing a wider population?
- 13What should I write when I do not have a complete list of the population?
- 14Is a survey respondent pool a sampling frame?
- 15How do I describe a sample recruited from a school, hospital or workplace?
- 16Should the sampling frame include people who do not respond?
- 17Conclusion
What You Need
Before you write a single sentence, gather the documents that let you describe the population and frame accurately. Most students who struggle with this section simply do not have the source list in front of them.
- Your research protocol or proposal, which already contains most of your eligibility rules in some form.
- Your inclusion and exclusion criteria, written as conditions rather than adjectives. A condition can be checked; a description cannot.
- The sampling method you used, since probability and non-probability designs require different claims.
- The actual list, register, database or roster you selected from, with the date you accessed it.
- Your recruitment materials, the invitation email, poster or message, since they shape who actually responds.
- A population size figure with a citable source, such as a published register or an official statistics release.
- Permission to use the administrative list, either institutional or through your ethics approval.
If you used somebody else’s data, add the dataset documentation and a note on the year it covers. A frame you did not build yourself still has to be dated and described, and its owner may know things about its quality that you do not.
Step-by-Step: How to Describe Your Study Population and Sampling Frame
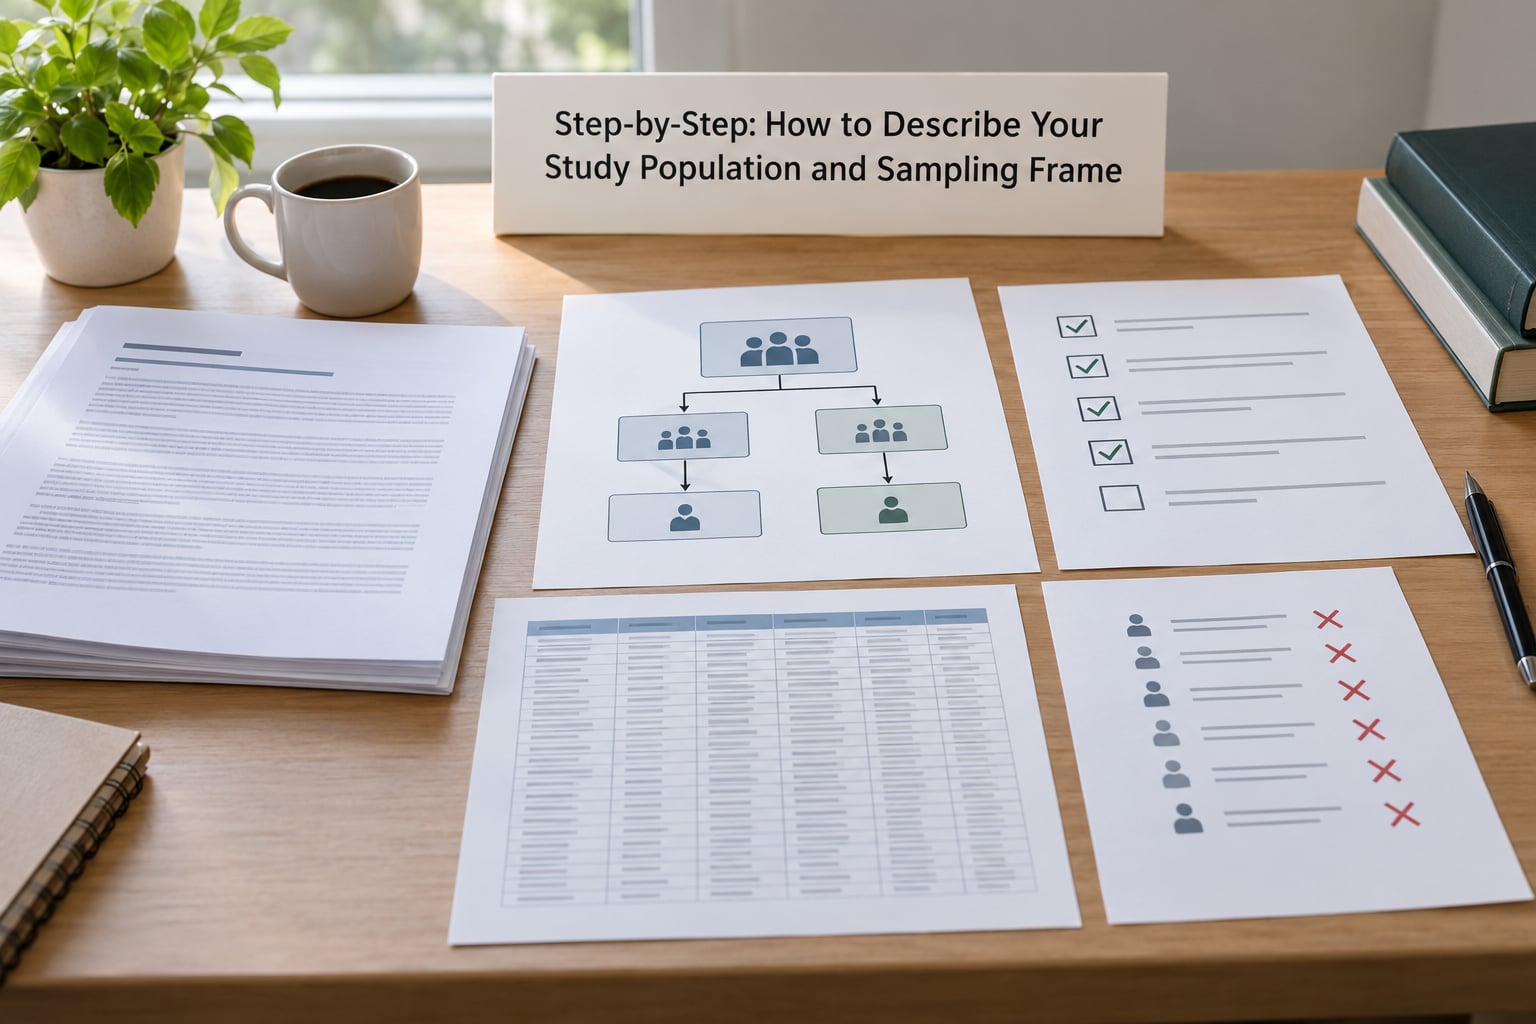
The process runs in six moves, from the unit of analysis through to a finished paragraph you could paste into Chapter Three. Work them in order, because each one constrains the next.
1. Define the target study population
Start with the population as an idea, then convert it into a set of conditions somebody could check. A target population is every person, case, record or geographic unit your study aims to describe, bounded by place and time.
Use three boundary types. Geographic boundaries name the place: one hospital trust, three secondary schools, a single postcode district. Temporal boundaries name the period: enrolled at any point between September and December, or records created in the financial year running to 2026. Substantive boundaries name the defining characteristics of a unit: currently practising, holds a registration number, has completed at least two years in post.
Now attach the eligibility rules. Write each one so it can be answered yes or no by someone who has never met the participant. “Experienced practitioner” fails that test; “registered with a professional body and in practice for five or more years as of the data collection date” passes.
Any group you can define with enough precision that a reader could, in principle, have counted or described it counts as a target population. If your definition depends on an opinion, it is not finished.
Template: “The target population for this study was [population description], defined as all [unit of analysis] that [substantive boundary], located in [geographic boundary], during [temporal boundary].”
2. Separate the population from the sample
The population is who you want to describe. The sampling frame is who you can reach. The sample is who you actually got. Examiners conflate these constantly, and the fix is a table rather than another paragraph.
| Element | What it is | How it is defined | When it is required | What to write |
|---|---|---|---|---|
| Target population | The group your findings are meant to describe | Conceptually, from your research question | Always | Boundaries and eligibility conditions |
| Accessible population | The part of the population you could realistically contact | By what access you have | When access is limited | The reason access is limited |
| Sampling frame | The operational list of units you could select from | From a named source and date | For any probability sample | Source, date, and coverage gap |
| Sample | The units actually selected or recruited | By your technique applied to the frame | Always | Numbers selected, approached and responding |
The difference between population and sampling frame is one of possibility, not of size. If a member of your population could never appear on your list, they are outside the frame, no matter how large the population is. One easy-to-reach person in a small group is a bigger coverage problem than a thousand people on an out-of-date register.
Template: “The target population and the sampling frame were not identical. The frame excluded [groups], who constituted approximately [share] of the target population, because [reason].”
3. Identify the sampling frame
Name the frame precisely enough that somebody could obtain the same list. A frame is normally a register, an enrolment roster, a patient list, an administrative database, a household directory, a professional membership list, a random-digit dialling database, or an opt-in panel file.
Give four details every time: the source, the date of access, the unit of analysis, and the total number of entries. “The university enrolment register” is incomplete. “The university’s enrolment register for the academic year ending in 2026, accessed on 14 January, listing 2,340 enrolled postgraduate students, one record per student” is what an examiner wants.
So can you give an example of a sampling frame? Here are three. A hospital trust’s outpatient appointment system for a named quarter, filtered to first-time attenders over 18. A local authority’s register of all licensed childcare providers on a given date. A state licensing board’s register of currently registered pharmacists, each with a unique licence number.
Template: “The sampling frame was [source], generated on [date], containing [number] [units]. Each entry represented [unit of analysis] and included [identifying fields].”
4. Check eligibility and coverage
Work through the frame and count what should have been removed, what could not be reached, and what was never on it. This is the part students skip, and it is the part examiners read twice.
- Duplicates. How many entries are the same person twice under two spellings or two record numbers?
- Out-of-date entries. How many people have left the group since the list was generated?
- Unknown eligibility. How many entries carry no data on the variable you need for screening?
- Undercoverage. Which groups in the population appear nowhere on the list?
- Uncontactable cases. How many have no usable contact details or an out-of-date address?
- Overcoverage. How many are on the list but no longer meet your criteria?
Say what you did about each one. Deduplicating, cross-checking against a second source, or excluding a whole segment because the list contains no eligibility data are all defensible moves, provided you write them down.
You can state a coverage rate when you have a defensible population figure. “The register lists approximately 82% of the target population” is useful, provided you cite where the total comes from. Where you cannot verify the total, say so rather than reaching for a plausible number.
Template: “Of the [number] entries, [number] were duplicates and [number] were no longer active at the access date. The frame excluded [group], who were not recorded on the source list, giving undercoverage of the target population.”
5. Connect the frame to the sampling method
The method determines what you are entitled to claim. In a probability sample, every member of the frame must have a known, non-zero chance of selection, and you report the technique you applied to the frame: simple random, systematic with a stated interval, stratified, or multistage cluster.
In a non-probability design, there is no known selection probability for members of the population, and the frame is descriptive rather than exhaustive. Say that plainly. Claiming randomness for a sample taken from a course mailing list, a friendship network or a social media post is the fastest way to lose marks, and it is the most common self-inflicted wound in student methods chapters.
Correct labelling matters as much as the technique. If participants chose to take part, that is a voluntary response design whatever list you sent the link to. If you picked people because they were reachable, that is convenience sampling, and you report it under that name.
Template (probability): “A stratified random sample was drawn from the frame, with [strata] proportional to their share of the frame. Every member of the frame had a known non-zero probability of selection.”
Template (non-probability): “Participants were recruited through [mechanism], a non-probability convenience design. No random selection was applied, so the sample cannot be treated as representative of the target population.”
6. Write the methods paragraph
Assemble the six pieces in a fixed order: unit, population, frame with source and date, frame-population gap, selection process, final numbers with limitations. Past tense for what you did, present tense for the definitions.
Here is a weak version:
“Participants were students at a UK university. A survey was sent to some of them and 112 responded. The results represent UK students generally.”
It fails because there is no unit of analysis, no frame, no source, no date, no coverage statement, and a generalisation claim that nothing supports.
Here is a strong version of the same study:
“The target population was all postgraduate students enrolled at a single UK university during the academic year ending in 2026. The unit of analysis was the individual student. The sampling frame was the university’s enrolment register for that academic year, generated on 14 January 2026 and containing 2,340 records, one per enrolled student. The frame did not cover students registered after that date, and it contained no information on nationality or home postcode, so neither variable could be screened in advance. A stratified random sample of 400 was drawn using the faculty as strata, with sampling intervals calculated within each faculty. Invitations were sent by email to the university accounts listed on the register, and 112 complete responses were returned, a response rate of 28% within the approached sample. Because coverage of the frame was limited to students enrolled at one institution and to the date of extraction, and because nonresponse was not assessed against frame characteristics, the findings are generalised only to enrolled postgraduate students at that university, not to UK postgraduate students as a whole.”
That paragraph runs about 180 words and it covers every point an examiner is likely to raise. Note the last sentence: the boundaries of generalisation are stated rather than implied, which is what turns a description into a defensible design.
For qualitative work the frame concept softens but does not disappear. You still describe who could have participated, where participants were drawn from and why those people fit the criteria; what you drop is the claim of known selection probability and the sampling fraction. Criterion and purposive sampling are usually justified against the research questions rather than a list.
Common Mistakes
Most marks lost in this section come from the same handful of errors. Each has a straightforward fix.
Calling volunteers representative. A voluntary response sample tells you about people who chose to respond, not about the population. Fix: label the design as voluntary response or convenience, and state that generalisation is limited to the respondents and the setting.
Confusing the frame with the sample. These are different things and students frequently swap them. Fix: the frame is what you could have selected from, the sample is what you did select, and sample size is simply a count, not a list.
Omitting boundaries. Without a place and a time, the population is a moving target and no comparison is possible. Fix: name the geographic area and the period in the same sentence as the population.
Leaving the frame undated. Registers change weekly, and an undated frame cannot be reproduced. Fix: give the source and the date of access every time.
Hiding a coverage problem. A frame that omits a group is a real limitation, and stating it protects you rather than exposing you. Fix: name the excluded group and the bias it creates, then confine your claims accordingly.
Claiming a population size you cannot cite. Invented totals are easy to spot and hard to defend in a viva. Fix: either cite a published source for the figure or describe the size qualitatively.
Using vague eligibility criteria. “All students” is too broad, and over-specified criteria describe a population that does not exist. Fix: one checkable condition per line, tied to a data source that can verify it.
A short frame-quality check before you submit: is the unit of analysis named, is the source dated, are duplicates and stale entries counted, is the gap between frame and population stated, is the sampling technique labelled correctly, and does the last sentence limit your claims to what the design supports?
Frequently Asked Questions
What is the difference between a study population and a sampling frame?
The study population is every unit your study aims to describe, defined conceptually. The sampling frame is the actual list of units you could select from, which may include some of the population and exclude others. If a member of the population could never appear on your list, they sit outside the frame. That gap is the difference, and it is the source of any coverage problem.
Can a convenience sample be described as representing a wider population?
Not honestly. A convenience sample has no known selection probability, so it cannot be treated as representative of the population. You can still report what it represents: the respondents in that setting at that time. State the design under its real name, explain how participants were reached, and confine your generalisation to the group you actually sampled.
What should I write when I do not have a complete list of the population?
Say so directly and describe what you did instead. A good sentence names the absence, states the reason, names the group your selection therefore covers, and limits your claims to match. For example: no complete list of the population exists publicly, so recruitment used a campus society mailing list, which reaches only society members. Findings are therefore described for that group and are not generalised to the wider student population.
Is a survey respondent pool a sampling frame?
Only if you selected from it deliberately. A panel or respondent pool is a frame when every member had a known chance of selection through your sampling procedure. If you posted an open link and took whoever responded, the pool is the sample, not the frame, and the design is voluntary response. Labelling it correctly matters more than the label you would prefer.
How do I describe a sample recruited from a school, hospital or workplace?
Name the institution, the department or ward and the date you accessed the list, then count the group that meets your criteria. State how many entries were ineligible or duplicated and how you handled them. Because a single site limits coverage, finish by saying that findings apply to that setting. Single-site sampling is normal; claiming beyond it is not.
Should the sampling frame include people who do not respond?
Yes. The frame is everyone who could have been selected, whether or not they later participated. Non-response happens after selection, so it is a separate issue and produces nonresponse bias rather than coverage bias. Report both numbers: how many you approached from the frame, and how many actually responded, with the rate between them.
Conclusion
Start with three sentences on a page. Write who the study is about and how that group is bounded, write where the list of potential participants came from and when you accessed it, then write who that list could not reach and what that means for your claims. Everything else, the eligibility rules, the coverage count, the sample size, belongs underneath those three.
Getting this right takes about an hour with your source list open, and it removes the single most common source of examiner criticism in a methods chapter.