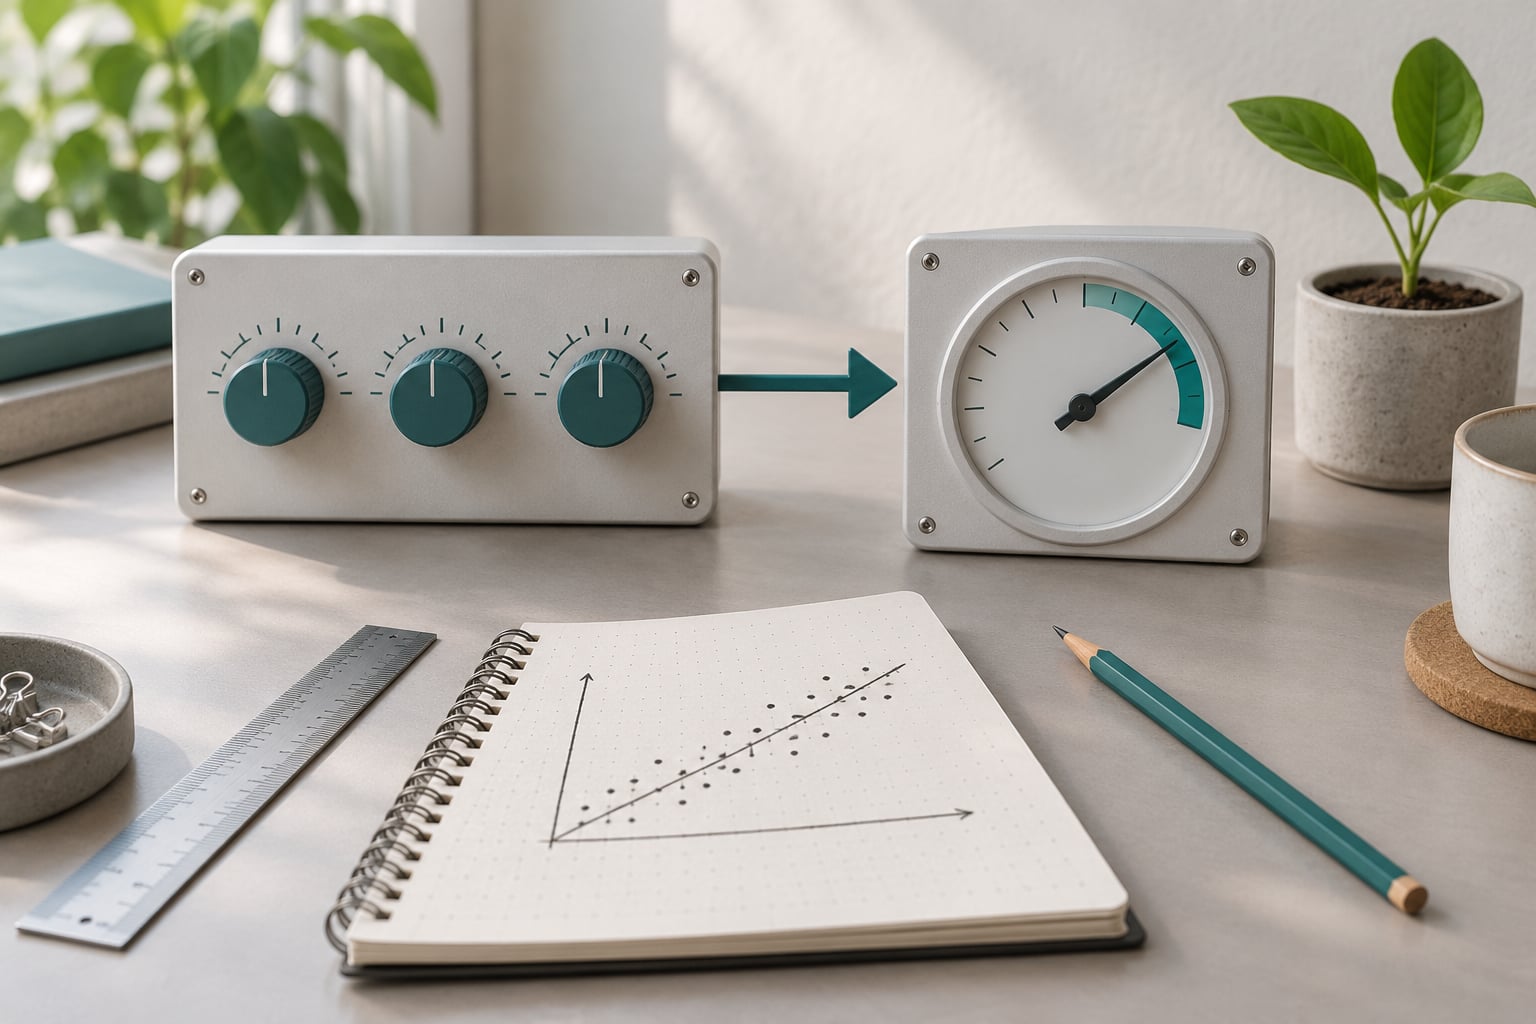
The difference between independent and dependent variables comes down to direction. An independent variable is the factor a researcher deliberately changes or sets, and a dependent variable is the outcome that gets measured to see whether it responds. Put simply: the independent variable is the input you control, and the dependent variable is the output you record.
That single idea fixes almost every confusion students hit in intro stats, AP Psychology and lab classes. Once you can say which one you are changing and which one you are measuring, everything else — the graph axes, the choice of statistical test, the wording of your hypothesis — follows from it.
This guide works through the difference with worked examples from education, marketing, social research and laboratory science, then gives you a repeatable three-step procedure for labelling variables in your own study.
Table of Contents
- 1Difference Between Independent and Dependent Variables at a Glance
- 2What Is an Independent Variable?
- 3Synonyms you will see for the independent variable
- 4Independent variables can be categorical or continuous
- 5The independent variable in an observational study
- 6What Is a Dependent Variable?
- 7Synonyms you will see for the dependent variable
- 8What makes a useful dependent variable measurement
- 9How Independent and Dependent Variables Work Together
- 10The y = f(x) view, and why the notation causes trouble
- 11Prediction is not causation
- 12Writing a hypothesis that names both variables
- 13Examples of Independent and Dependent Variables in Research
- 14Education: hours of study and exam performance
- 15Business and marketing: price and purchase conversion
- 16Social research: education of parents and voting preference
- 17Laboratory science: temperature and reaction rate
- 18How to Identify Independent and Dependent Variables
- 19How to identify the difference between independent and dependent variables
- 20The ‘is X dependent on Y’ test
- 21‘Independent variable’ and ‘statistically independent’ are not the same idea
- 22Four mistakes that swap them
- 23Independent and Dependent Variables in Statistical Analysis
- 24Which Should You Choose?
- 25Frequently Asked Questions
- 26Can a variable be both independent and dependent?
- 27What is the easiest way to tell which variable is independent?
- 28Is time an independent or dependent variable?
- 29What is the difference between a control variable and a dependent variable?
- 30Can correlation determine which variable is independent or dependent?
- 31How do I write a hypothesis using independent and dependent variables?
- 32Conclusion
Difference Between Independent and Dependent Variables at a Glance
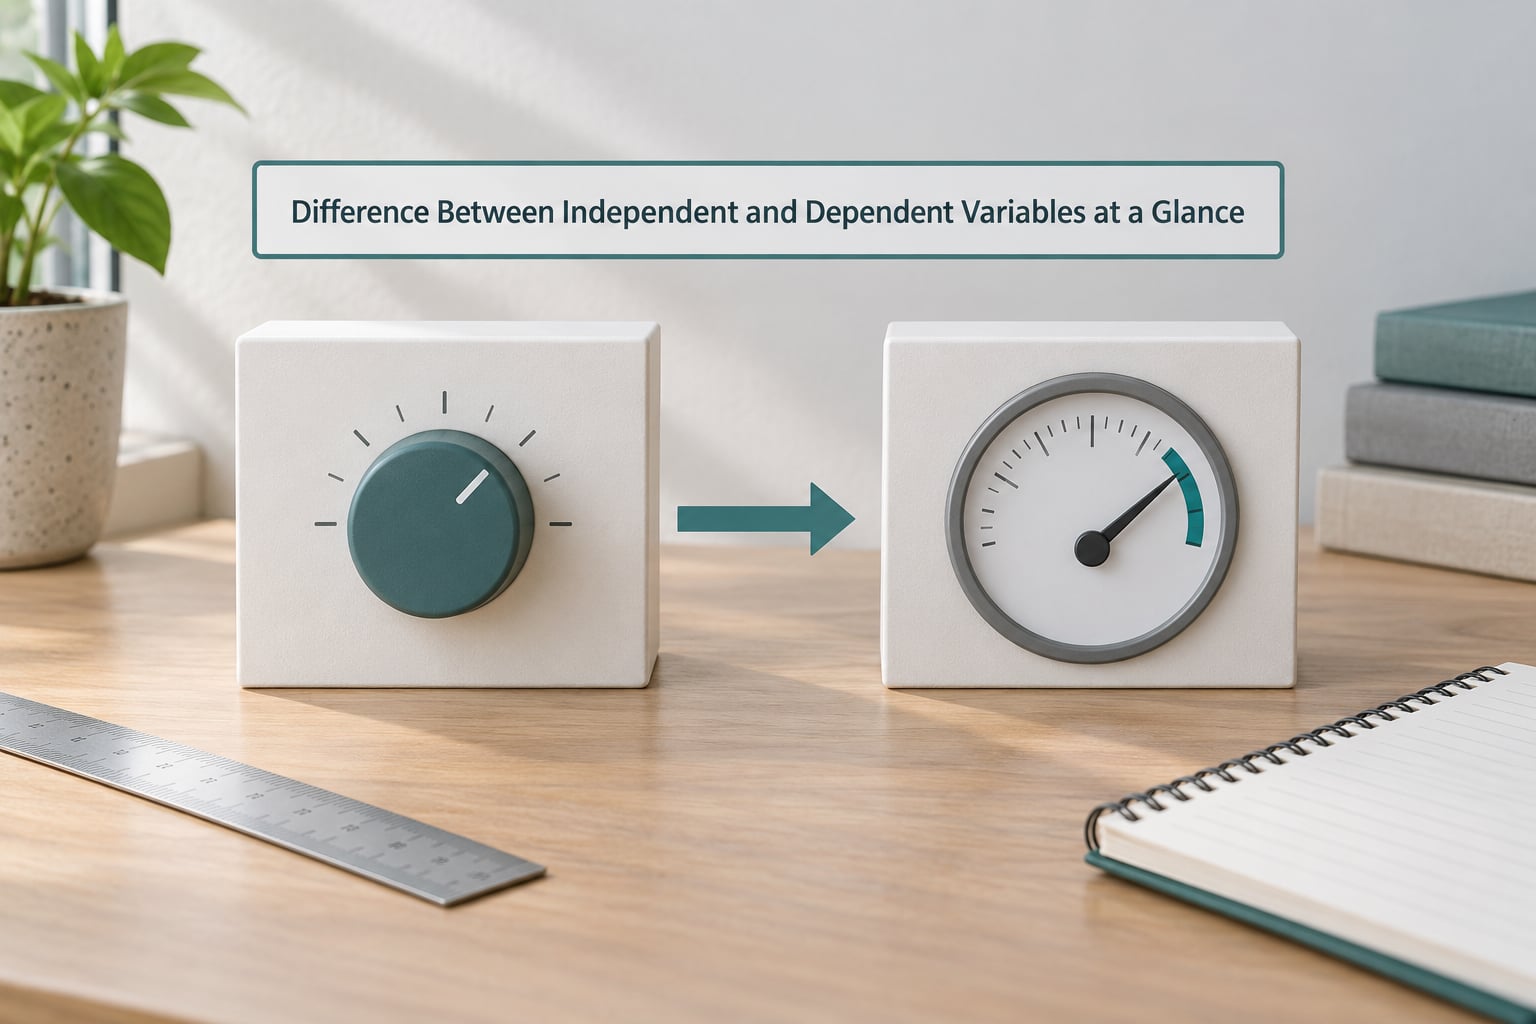
The table below is the shortest version of the answer. Read across one row at a time and the contrast becomes obvious.
| Criterion | Independent variable (IV) | Dependent variable (DV) |
|---|---|---|
| Definition | The factor you deliberately change, set or select | The outcome you measure to see how it responds |
| Who changes it | The researcher, by design | It changes on its own in response to the IV |
| Role | Cause, input, predictor | Effect, output, outcome |
| Direction of influence | Points toward the DV | Points back toward the IV |
| Graph position | X-axis, horizontal | Y-axis, vertical |
| Key question | What am I changing? | What am I measuring? |
| Synonyms | Predictor, explanatory, manipulated | Response, responding, criterion |
| Example | Hours of study per week | Exam score out of 100 |
One caveat sits behind every row of that table: the labels describe a role in a research design, not a permanent property of the variable. Sleep duration is a dependent variable in a study of caffeine and is an independent variable in a study of memory performance. Keep that in mind as you read on.
What Is an Independent Variable?
An independent variable is the factor a researcher deliberately changes, sets or selects between conditions. It is the thing you hold in your hand and set to a level before you start measuring anything else.
In a randomised experiment, you might vary a plant’s watering frequency across three levels — daily, every three days, weekly — and then record growth. The watering schedule is the independent variable, because you chose the levels and assigned them.
The word independent here means that you set it independently of the measurement process. It does not mean the variable stands alone, and it has nothing to do with the probability idea of statistical independence, which is a separate concept entirely.
Synonyms you will see for the independent variable
Textbooks and papers rarely use one label consistently. You may see the same variable called a predictor variable in a regression chapter, an explanatory variable in economics, a factor in a design-of-experiments paper, or a manipulated variable in a lab report. All of them point at the input side.
If your assignment uses predictor and outcome, that pair maps onto independent and dependent, and you can translate it either way without changing the analysis.
Independent variables can be categorical or continuous
A categorical IV splits groups into named conditions, such as treatment versus placebo, or first-year versus fourth-year students. A continuous IV takes a range of numeric values, such as 2, 4 or 8 hours of sleep. Both are valid independent variables; the difference determines which tests you can run.
Students often worry that two levels is too few. Two levels is fine for a straightforward comparison. More levels simply let you look at the shape of a trend rather than only whether two conditions differ.
The independent variable in an observational study
In an observational study nothing is manipulated, so there is no input you set. Researchers still label one variable the predictor and the other the outcome, based on which one they argue comes first theoretically and which one is measured downstream in time.
The terminology shifts in this setting, and it is worth saying so plainly: without manipulation you have a predictor, not a proven cause. That distinction is the difference between saying sleep predicts memory and saying sleep causes memory.
What Is a Dependent Variable?
A dependent variable is the outcome you measure to find out what the independent variable did. Its value is expected to move when the independent variable moves, which is why it is called dependent — it depends on the other variable.
Go back to the plant example: the independent variable is watering frequency, and the dependent variable is growth in centimetres, measured after a fixed number of weeks. The height is the dependent variable because you did not set it; you recorded whatever happened.
A dependent variable can be continuous, like height or reaction time in milliseconds. It can also be categorical, like whether a customer churns, whether a patient recovers, or whether a student passes. Nobody has to name the outcome first, which is exactly why it is dependent.
Synonyms you will see for the dependent variable
You will meet response variable, outcome variable, criterion variable and measured variable used for the same role. In machine learning the outcome is usually called the target or the label.
When you move between fields, these synonyms are the only change. The logic of which one you set and which one you record stays identical.
What makes a useful dependent variable measurement
Good dependent variables need an operational definition, meaning a precise statement of how the concept will be measured. “Engagement” is too vague. “Sessions per user per week” is usable.
Useful outcomes are also measured on a consistent scale, recorded with the same instrument across all conditions, and sensitive enough to move if the independent variable genuinely has an effect. An outcome that never changes across conditions tells you little about whether your manipulation worked.
How Independent and Dependent Variables Work Together

The two variables form a directed relationship. You set the independent variable across conditions, you measure the dependent variable in each condition, and then you compare the results to see whether the outcome responded.
If the dependent variable tracks the independent variable in a consistent direction, you have evidence of a relationship. The reason you can look for that direction at all is that you fixed the order in advance, rather than deciding afterwards which variable looks more interesting.
The y = f(x) view, and why the notation causes trouble
Mathematicians write a function as y = f(x), and that convention is why independent variables end up on the x-axis and dependent variables on the y-axis. The naming lines up with the algebra: x is supplied, y is produced.
The trouble starts when a spreadsheet or a statistics package uses x and y as generic column labels unrelated to research design. A column called x in your export is not automatically your independent variable, and confusing those two is a common source of reversed analyses.
Prediction is not causation
An association between two variables does not establish which one causes which. In observational work both variables are recorded, so the direction of influence is a theoretical claim you are making, not something the data can verify on its own.
Randomisation is what earns you causal language. Assigning conditions at random balances known and unknown differences across groups, so a difference in the dependent variable can be attributed to the independent variable with far more confidence.
Writing a hypothesis that names both variables
A directional hypothesis names both variables and predicts the relationship, for example: students who study more than eight hours per week (IV) will score higher on the final exam (DV) than students who study fewer than four hours.
A null hypothesis states that the dependent variable will not differ across levels of the independent variable. Whichever you write, naming both variables explicitly tells your reader exactly what was manipulated and exactly what was measured.
Examples of Independent and Dependent Variables in Research
The mechanics are easiest to see in worked cases. Each example below labels the independent variable, the dependent variable, what needs controlling, the relationship you would expect and the analysis that fits.
Education: hours of study and exam performance
In a study of study habits, the independent variable is weekly study hours, set at two or three levels, and the dependent variable is the final exam score. Controlled variables would include total class hours, subject difficulty, prior attainment and time of day of revision, since any of those could move the score independently of study time.
You would expect a positive relationship, and the usual analysis is a one-way ANOVA across three levels or an independent-samples t-test across two. A good operational definition for the dependent variable is a scored exam out of a fixed total, marked with the same rubric for everyone.
Business and marketing: price and purchase conversion
In a pricing test, the independent variable is the price shown to visitors, and the dependent variable is whether they complete a purchase, measured as conversion rate. You would control the product page layout, the traffic source, the advertising spend running during the test and the time of day, since those all affect conversion.
Here the dependent variable is categorical rather than continuous, so a chi-square test or a logistic regression fits better than a t-test. This pairing comes up constantly in A/B testing, where the IV is the variant and the DV is the behaviour you hope to shift.
Social research: education of parents and voting preference
In an observational survey, parental education level is the predictor and voting preference is the outcome. Nothing is manipulated, so you are estimating an association, and the phrasing of your write-up should reflect that.
Confounders are a real risk here. Age, income and region all track with parental education and with political preference, so without adjustment you may be measuring income rather than schooling. Ordered responses like a five-point preference scale call for a suitable ordinal method or a categorical model.
Laboratory science: temperature and reaction rate
In a chemistry practical, temperature is the independent variable, set across levels in a water bath, and the dependent variable is reaction rate, measured as the time for a colour change to appear. Controlled variables include reactant concentration, volume, the specific reaction and the measuring method, all of which affect the timing.
The expected relationship is that rate rises with temperature, and a straight line of reaction rate against temperature across the range you tested supports that. Here the dependent variable is often derived from a duration, so document the operational definition carefully.
How to Identify Independent and Dependent Variables
Identification gets reliable once you use a procedure instead of a definition. Read the design, find what was deliberately varied, and find what was recorded afterwards.
How to identify the difference between independent and dependent variables
First, ask what was deliberately changed or set by the researcher. That is your candidate independent variable. If nothing was manipulated, the study is observational and the predictor role comes from your theory instead.
Second, ask what was recorded as the result of that change. That is your dependent variable. If several things were recorded, pick the one the study is designed to explain, and treat the rest as secondary outcomes.
Third, ask what else was kept constant or measured for comparison. Those are control variables, and they are not candidates for either role. Anything left unmeasured that could explain the outcome is a potential confounder you should name in your write-up.
The ‘is X dependent on Y’ test
Say the sentence out loud with each candidate: “Is the exam score dependent on study hours?” If the sentence makes grammatical and scientific sense, study hours is independent and exam score is dependent. Swap them and the sentence should not make sense.
This works because the test carries the temporal order built into the design. The thing you set comes first in time, and the thing you record comes second.
‘Independent variable’ and ‘statistically independent’ are not the same idea
Statistical independence is a probability concept. It says that knowing the value of one variable gives you no information about the other, which is the opposite of a relationship between an IV and a DV.
The same word carries both meanings across textbooks, so it is worth keeping them apart in your own work. An independent variable in a design is an input you set. Two statistically independent variables are variables that do not influence each other, and you would not normally put them on opposite axes of one plot.
Four mistakes that swap them
The most common error is reading the sentence order of the research question and assuming the first variable is the independent one. Order in a sentence carries no design information.
The second is treating a control group as an independent variable. A control group is a condition of the design with a deliberately neutral level, not a variable in its own right. The treatment versus control comparison defines the levels of your independent variable.
The third is calling anything measured in a control condition a control variable. Variables held constant across every condition are control variables. The measurement taken in the control group is the dependent variable for that condition.
The fourth is claiming a direction from correlation alone. A significant correlation tells you the two variables move together, not which one you set. Direction comes from your design, and causal language needs randomisation behind it.
Try these five scenarios on yourself before checking the answers. Which is independent and which is dependent?
- A gym compares weekly training sessions against resting heart rate.
- A school tests whether a new revision timetable changes test anxiety scores.
- A manufacturer compares material type against the durability rating of a panel.
- A retailer compares discount size against units sold per week.
- A researcher records screen time and sleep quality in adults without intervening.
The answers: training sessions are independent and resting heart rate is dependent, although in a design like this you would usually frame the sessions as the intervention and the heart rate as the outcome. Timetable is independent and anxiety score is dependent. Material type is independent and durability is dependent. Discount size is independent and units sold is dependent. In the last scenario nothing was manipulated, so screen time is the predictor and sleep quality is the outcome, with direction resting on theory rather than on the design.
Independent and Dependent Variables in Statistical Analysis
The choice of analysis follows directly from how many levels the independent variable has and what kind of dependent variable you recorded. The variable labels do the deciding.
Two levels of the IV and a continuous DV point to an independent-samples t-test. Three or more levels point to a one-way ANOVA, which tests whether any group mean differs. Both cases assume two separate groups of participants.
Repeated measures on the same participants change the test rather than the labels. With one IV and two levels you use a paired-samples t-test, and with three or more levels you use a repeated-measures ANOVA. The variables are still the IV and the DV; only the structure of the data differs.
Correlation uses neither label, and that is a source of confusion worth naming. A correlation coefficient is symmetric and gives no direction. You can still describe one variable as the predictor and the other as the outcome for your hypothesis, but the coefficient itself will not tell you which is which.
Regression is where the labels reappear in force. The independent variable enters as a predictor on the right-hand side of the equation, and the dependent variable sits on the left as the response. In a linear model the fitted values are written as y, which is why x and y show up in the output.
A categorical dependent variable needs a different family of models. Logistic regression handles binary outcomes such as pass or fail, and multinomial or ordinal models handle outcomes with several ordered categories. Chi-square tests cover the simplest two-by-two tables.
Machine learning uses the same logic under different names. Features are the independent variables and the target is the dependent variable. Feature engineering means choosing which inputs to vary and measure, and data leakage happens when an input already contains information about the target, which is a design problem rather than a coding problem.
One point closes this section: the same variable can be independent in one study and dependent in another. Attendance predicts grades in one project, and an intervention on attendance becomes the outcome in another. Always read the design before you trust a label.
Which Should You Choose?
The question usually resolves itself. Researchers label both variables rather than choosing one, and what varies is how firmly the design supports the causal story attached to those labels.
In a controlled experiment you can name the manipulated factor as independent with confidence, because randomisation and manipulation are on your side. This is the design where causal language is appropriate.
In a comparative study where two existing groups are compared, such as two schools or two products, the grouping variable is the independent variable and the measured outcome is dependent, but any difference may be partly explained by how groups were formed. Covariate adjustment helps but does not create randomisation.
In a survey, the predictor is whatever your model positions on the right-hand side, and the outcome is what you are modelling. Word your claims about the relationship in language that fits the design, such as associated with rather than leads to.
In a regression model the choice is explicit and consequential. It decides which coefficient you interpret, which variable you can hold constant, and which one your model is built to predict. Pick the predictor you have a defensible reason to argue about, not the one that makes the biggest coefficient.
In a repeated-measures or longitudinal design the same variable can wear both hats. In a study that measures stress at three time points during an intervention, time can act as the independent variable and stress as the dependent variable, while the baseline measurement of stress also serves as a covariate.
In designs with a reciprocal relationship, such as exploring whether stress affects sleep quality and sleep quality affects stress, the labels are symmetric and neither side is truly independent. Report it as a two-way relationship and say so in your limitations, rather than forcing a single direction.
Frequently Asked Questions
Can a variable be both independent and dependent?
Yes, but only in specific designs. In a longitudinal or repeated-measures study, a variable measured early can act as the dependent variable at baseline and later become the independent variable in a follow-up phase. The same variable is playing the outcome role in one comparison and the predictor role in another. The label describes a role in a specific comparison, not a permanent identity, so always state which comparison you mean.
What is the easiest way to tell which variable is independent?
Ask what the researcher deliberately changed or set. Whatever was manipulated or selected in advance is the independent variable; whatever was recorded afterwards as the result is the dependent variable. If nothing was manipulated, the study is observational, and the variable you argue comes first theoretically becomes the predictor. Say the sentence ‘Is X dependent on Y’ to check: if it makes sense, Y is independent.
Is time an independent or dependent variable?
It depends on the design. When researchers vary the length or timing of an intervention and measure the result, time is the independent variable, often with several levels such as baseline, week four and week twelve. When time is measured passively in an observational study and something else is the focus, it can be a covariate or a predictor. Time as a dependent variable is rare because it is rarely the outcome being explained.
What is the difference between a control variable and a dependent variable?
A dependent variable is the outcome you measure to see the effect of your independent variable. A control variable is anything else you deliberately hold constant across all conditions so that it cannot explain your results. A dependent variable differs across conditions as a result; a control variable stays the same on purpose. Note that a control group is a condition of the design, not a control variable.
Can correlation determine which variable is independent or dependent?
No. A correlation coefficient is symmetric, so it cannot tell you which variable comes first. Direction comes from your research design and your theory, not from the strength of the association. In an experiment the manipulated variable supplies the direction. In an observational study you decide which variable to model as the predictor, and your write-up should use association language rather than causal language.
How do I write a hypothesis using independent and dependent variables?
Name both variables in one sentence and state the direction you expect. For example: students who study more than eight hours per week will score higher on the final exam than students who study fewer than four hours. The null hypothesis says the dependent variable will not differ across levels of the independent variable. Naming both explicitly tells the reader what was manipulated and what was measured.
Conclusion
The difference between independent and dependent variables is a difference in role, not in kind. You set the independent variable; you measure the dependent variable. Everything else, from graph axes to the choice between ANOVA and logistic regression, follows from that one distinction.
Here is the first step for your own study: write down your research question, then under it list one line for what was manipulated or predicted and one line for what was recorded afterwards. Then check the sentence “Is X dependent on Y” to confirm the direction.
If anything you wrote stays constant across every condition, move it to your list of control variables. And if nothing was manipulated at all, describe your predictor and outcome without claiming cause.