
Working out how to treat Likert data as ordinal or interval comes down to what you actually built. Individual response items carry a meaningful order, but nothing guarantees the gap between disagree and neutral is the same size as the gap between agree and strongly agree. Approximate interval treatment becomes defensible only when you sum or average several items into a composite score, the scale offers enough points to make averaging meaningful, and that composite is close to symmetric. The sections below give you a decision procedure, the matching tests, and wording you can copy into a methods section.
Table of Contents
- 1Ordinal or Interval? The Direct Answer
- 2What Counts as Likert Data?
- 3Why the Ordinal-versus-Interval Debate Exists
- 4How to Decide Which Treatment Is Defensible
- 5How to Treat Likert Data as Ordinal or Interval in Practice
- 6Defensible ordinal workflow
- 7Approximate interval workflow
- 8Worked example
- 9Which Statistical Tests Fit Each Treatment?
- 10How to Code and Analyze Likert Data in SPSS, R, and Stata
- 11How to Report the Treatment in a Thesis or Paper
- 12Common Errors and Better Alternatives
- 13Frequently Asked Questions
- 14Can a five-point Likert scale be treated as interval data?
- 15Should each Likert item be analyzed separately or combined into a scale?
- 16Do Likert scores have to be normally distributed for a t-test or ANOVA?
- 17Should I report means or medians for a Likert scale?
- 18Can SPSS, R, or Stata tell me whether Likert data are ordinal or interval?
- 19Conclusion: Start With the Scale You Actually Built
Ordinal or Interval? The Direct Answer
Individual Likert items are ordinal. Summed or averaged multi-item scales may be treated as approximately interval, and only under conditions you state out loud in your write-up.
Four things settle it in practice: the research question, whether the items were built and validated as a scale, the shape of the score distribution, and the statistical method your design calls for. A supervisor who asks “is this ordinal or interval?” usually wants to hear the scoring logic, not a slogan.
| Feature | Ordinal treatment | Approximate interval treatment |
|---|---|---|
| What it assumes | Categories are ordered; distances between them are unknown | Distances between adjacent score points are roughly equal |
| Typical variable | A single agreement item scored 1 to 5 | A summed composite score with many possible values |
| Central tendency | Median, mode, percentage in each category | Mean, with a confidence interval |
| Dispersion | Interquartile range, full response distribution | Standard deviation |
| Distribution | Report counts and percentages, no normality claim | Check skewness and kurtosis before parametric tests |
| Group comparison | Mann-Whitney U, Kruskal-Wallis, Wilcoxon signed-rank | Independent or paired t-test, one-way or repeated-measures ANOVA |
| Association | Spearman rho, Kendall tau, gamma | Pearson correlation, linear regression |
| Reporting | Valid response base, full distribution, median and IQR | Mean, SD, N, and the assumption you are making |
Pick the column on the right only when the last row of the left column, “typical variable,” is a composite rather than a lone item. That single fact resolves most of the argument you will have with a reviewer.
What Counts as Likert Data?
Five different things get called Likert data, and mixing them up causes most of the errors I see in student analyses.
A Likert item is one statement with ordered response options, from strongly disagree to strongly agree. A Likert scale is a planned set of related items scored to measure one construct. A response category is one option within an item. A composite score is the sum or mean of several items, which is the only version of Likert data that carries any claim to interval treatment. A valid response base is everyone who actually answered, which is often smaller than your total sample because of N/A and not sure options.
| What you built | Example | Measurement level | How you read it | Suitable analysis |
|---|---|---|---|---|
| Single item | “The course workload was manageable”, strongly disagree to strongly agree | Ordinal | Counts, percentages, median category | Mann-Whitney U, ordinal logistic regression |
| Five-item composite | Five workload items, each 1 to 5, summed to a 5 to 25 score | Approximately interval if reliability is adequate and skew is low | Mean, standard deviation, distribution | t-test, ANOVA, linear regression |
The reason the distinction matters traces back to Stevens’ typology of levels of measurement, which sorts variables by the operations you can legitimately perform on them. Nominal variables support counting only, ordinal variables add ranking, interval variables add equal differences, and ratio variables add a true zero. Likert items earn their place on the ordinal rung because ranking is all the wording guarantees.
Other ordinal variables you already work with include class rank, satisfaction with income in bands, age bands like 18 to 24 and 25 to 34, number of children, and a course grade letter.
Why the Ordinal-versus-Interval Debate Exists
The dispute is not noise. It goes back to the equal-interval assumption, and honest answers have to concede that the literature genuinely disagrees.
Likert himself, writing in 1932, described the summed scale as interval-level. Stevens’ 1946 typology treats summed scores as interval when the summation itself produces equidistance, but treats a single rating as ordinal. Later work split the room: Bishop and Herron found that many tutorials recommended nonparametric methods for ordinal data, while Norman reported that the overwhelming majority of published papers treat summed Likert scales as interval and that such treatment performs acceptably. Jamieson argued for the median and nonparametric tests on Likert items, and Harpe pushed toward decision criteria tied to scale structure rather than a blanket rule.
Three practical problems keep the argument alive.
Verbal anchors are not physical distances. Nothing on the questionnaire proves that the subjective jump from strongly disagree to disagree equals the jump from agree to strongly agree. Respondents may also use the middle categories heavily, which compresses the ends.
Ceiling and floor effects distort any distance claim. When most people pick the top two boxes, the top category absorbs real variation that a mean silently hides. A composite that piles up at the maximum is not interval data in any useful sense.
Small samples make rank-based tests noisy. With 12 people per group, the Mann-Whitney U test loses resolution, and reviewers start asking why you did not use the more familiar parametric route.
Get this wrong in one direction and you report a mean of 4.1 on a five-point item as though the scale were a thermometer. Get it wrong in the other direction and you throw away real power and end up with a p-value of .06 on a difference that is plainly there. The cost of each mistake is different, which is why the decision deserves a procedure rather than a preference.
How to Decide Which Treatment Is Defensible
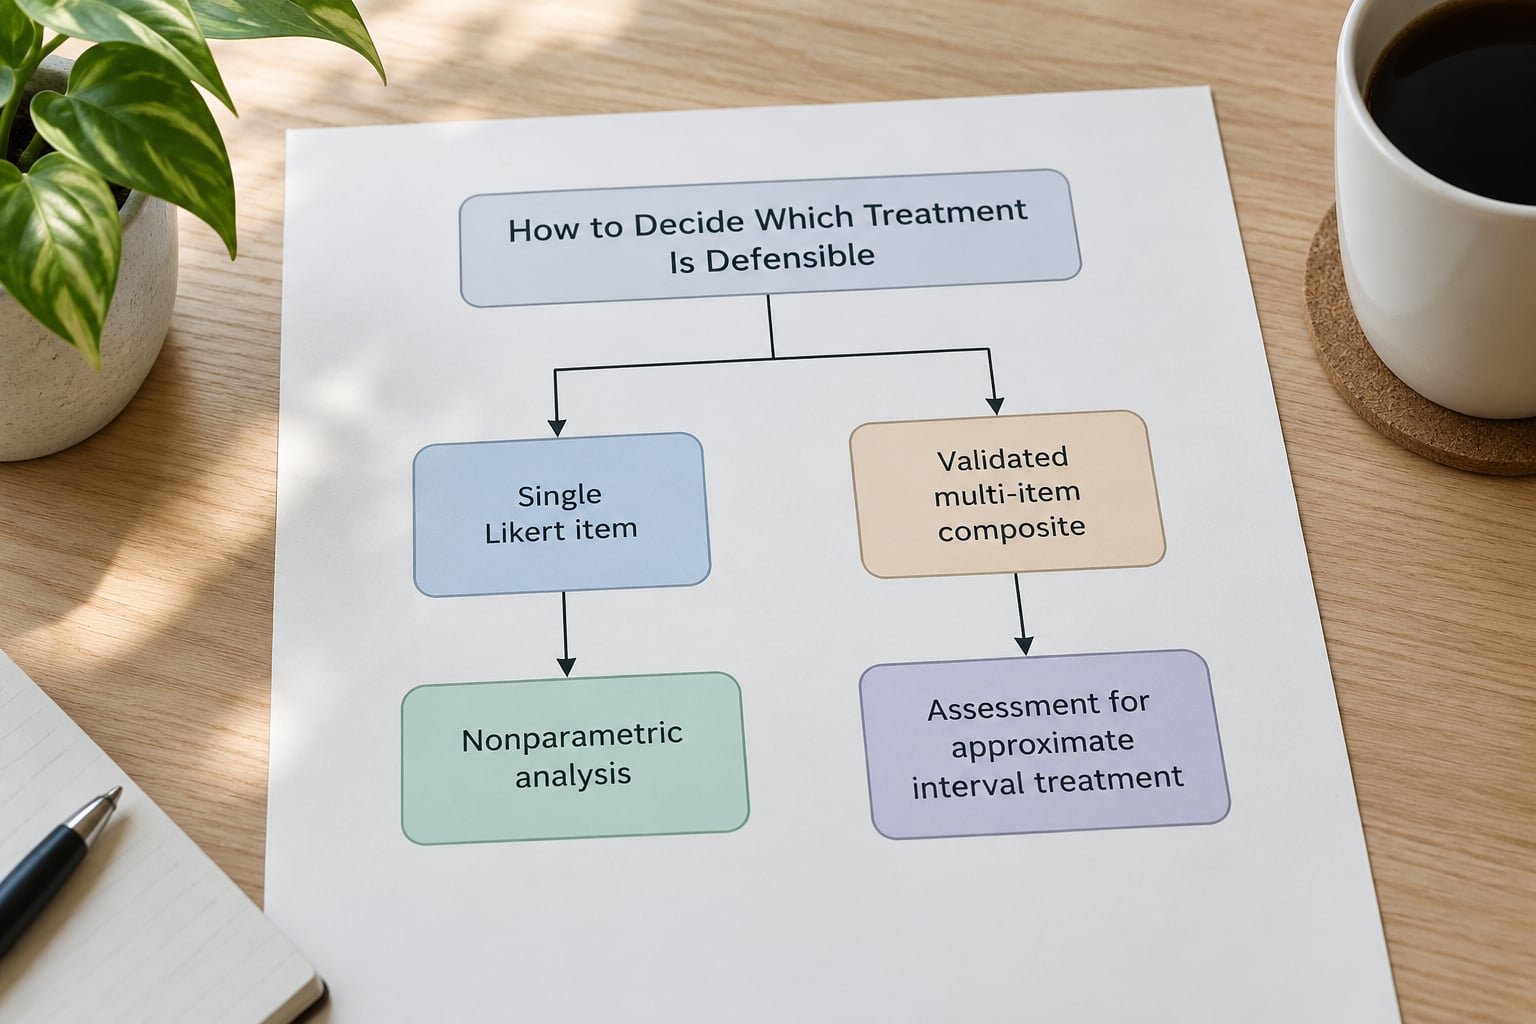
Work through these five questions in order and stop at the first one that fails. If the first answer is no, your treatment is ordinal and the rest of the analysis follows from that.
1. Is the variable a single item or a composite of at least three items that measure one construct? A lone agreement item stays ordinal. Summed or averaged items may qualify. Three is the usual floor, and the items need a stated rationale for belonging together.
2. Is reliability of the composite adequate? Report Cronbach’s alpha, or KR-20 if the items are dichotomous. Around .70 is the usual floor for exploratory work, .80 for anything you want to generalise. If alpha is low, you do not have a scale yet, so interval treatment is not on the table regardless of symmetry.
3. Does the score offer enough points for averaging to be meaningful? Five items on a five-point scale give a 5 to 25 composite with 21 possible values. A single 5-point item gives five values, where the spacing between categories is doing all the work. Seven-point items widen the range further.
4. Is the composite distribution acceptably symmetric? Inspect the histogram, the skewness statistic, and a normal Q-Q plot. A common working threshold is absolute skewness below about 0.5, with up to 0.75 tolerated for moderate asymmetry. Heavy piling at one end, visible ceiling effects, or a bimodal split between satisfied and dissatisfied respondents all count as failures.
5. Do the sensitivity checks agree with the parametric result? Run the rank-based alternative on the same data. If the Mann-Whitney U and the t-test disagree in sign and rough magnitude, report both and say why. Divergence usually means distribution problems you should fix in the write-up rather than hide.
The default when the answers are mixed. If you cannot clear questions 1 through 4, treat the data as ordinal, report medians and the full response distribution, and use rank-based tests. That default is defensible on its own merits and does not need a justification paragraph beyond naming the response scale.
One more question that comes up constantly: does a large sample rescue you? Past roughly 30 to 40 valid responses per group, parametric and rank-based tests on Likert data tend to give similar conclusions, so the choice rarely changes a conclusion. It still changes which descriptions and claims you can make honestly, and reviewers keep asking about the method regardless of the sample size, so answer the question on design grounds rather than sample size.
How to Treat Likert Data as Ordinal or Interval in Practice
Two workflows, one per treatment. Most projects need the ordinal one for individual items and the interval one for composites, sometimes in the same results section.
Defensible ordinal workflow
Code each item from 1 for strongly disagree to 5 for strongly agree, and leave N/A as a genuine missing value rather than a low score. Report the valid response base for every item, because it rarely matches your total N.
Show the full distribution: counts, percentages, and cumulative percentages for each category, with median and interquartile range for the summary. A top-two-box percentage is a useful addition for satisfaction items, and a diverging stacked bar chart displays the response pattern better than a bar of means.
Use rank-based tests for comparisons. Add an effect size such as Cliff’s delta or the rank-biserial correlation, because a p-value alone tells a reader nothing about size. When an ordinal variable is the outcome, ordinal logistic regression (proportional odds) is the natural model, and you must test the proportional odds assumption.
Approximate interval workflow
Reverse-code the items that point the other way. For a five-point item, recode 1 to 5, 2 to 4, 3 to 3, 4 to 2, 5 to 1. This changes the direction of the scale, not the values themselves; reversing item wording in the questionnaire and failing to reverse the numbers is a common and embarrassing error.
Compute the composite with a mean, not just a sum, so respondents who skipped one item do not get a low score. Then check reliability, examine the histogram and skewness, and only then run parametric tests.
Worked example
Suppose 100 respondents answer five items scored 1 to 5 and you build a 5 to 25 composite. If the individual items are reliable and the composite histogram is unimodal and roughly symmetric, the mean is a fair summary and you can report mean = 18.4, SD = 4.1, alongside a median of 18 and an IQR of 15 to 22. If the same composite shows 62 percent of respondents choosing the top two categories on nearly every item, you have a ceiling effect, so report the distribution and the median, and treat the mean with a caveat rather than as your headline number.
Both descriptions are honest. Only one of them is honest about which number the data can carry.
Which Statistical Tests Fit Each Treatment?
Match the test to your design and your treatment, then check the stated assumption before you report anything.
| Your research design | Ordinal route | Approximate interval route | Assumption to check | Effect size to report |
|---|---|---|---|---|
| Two independent groups | Mann-Whitney U | Independent-samples t-test | Similar shapes of both distributions | Cliff’s delta or rank-biserial r |
| Three or more independent groups | Kruskal-Wallis | One-way ANOVA | Homoscedasticity; post-hoc adjustment | Epsilon squared or eta squared |
| Two related measurements | Wilcoxon signed-rank | Paired t-test | Symmetric differences, no extreme outliers | Matched-pairs rank-biserial r |
| More than two related measurements | Friedman test | Repeated-measures ANOVA | Sphericity, Mauchly test | Kendall’s W |
| Association between two ordered variables | Spearman rho or Kendall tau | Pearson correlation | Linearity and absence of influential outliers | The correlation itself |
| Ordinal outcome with predictors | Ordinal logistic regression | Multiple linear regression | Proportional odds assumption | Common odds ratios with 95% confidence intervals |
| Single item, category frequencies | Chi-square test of independence | Not recommended for a lone item | Expected cell counts at least 5 | Cramer’s V |
Two warnings that come up repeatedly in forum threads. First, the Mann-Whitney U test is not a test of medians; it tests whether one group tends to hold higher ranks than another, and with shapes of different spread it can be significant while medians are identical. Second, an approximately interval composite is not automatically normal, which is why step 4 of the decision procedure exists at all.
If you also collected demographics like age band or education level, you are running chi-square or Spearman as the predictor side of the analysis, and both are happy with ordinal inputs regardless of how you treat the outcome.
How to Code and Analyze Likert Data in SPSS, R, and Stata

Menu paths and command names move between releases, so check the labels your version actually shows. What does not change is the sequence: code the items, build the composite, declare the measurement level, check reliability, then test.
SPSS. Open Variable View and set the Measure cell for each item to Ordinal. SPSS frequently auto-detects survey items as Scale, which is why t-tests and ANOVA appear in the menus before you have thought about the question. Define missing values under Variable View so N/A is excluded from computing. Use Transform, then Recode into Different Variables for reverse coding, and Transform, then Compute Variable to build the composite with MEAN rather than SUM so partially completed respondents are handled. Reliability lives under Analyze, then Scale, then Reliability Analysis, where you switch the model to KR-20 for dichotomous items. Mann-Whitney U sits under Analyze, then Nonparametric Tests, then Legacy Dialogs. For ordinal logistic regression you need the extension modules installed from the Extensions Hub.
R syntax you can adapt directly:
library(ordinal)
clm(agree ~ group + age_band, data = d)   # proportional odds model

d$r3 <- 6 - d$q3                          # reverse a 1-5 item
d$total <- rowMeans(d[c("q1","q2","r3","q4","q5")], na.rm = TRUE)

library(likert)
likert(d[c("q1","q2","r3","q4","q5")])    # item frequencies and item-total correlations

wilcox.test(total ~ group, data = d)      # rank-based
t.test(total ~ group, data = d)           # parametric, only if the decision rule passed
Stata. Build the composite with egen rowtotal, then tabstat it by group with statistics for n, mean, standard deviation, and p50. The rank-based commands are ranksum for two groups, kruskalwallis for three or more, and wilcoxon for paired data. For an ordinal outcome use ologit and follow it with prtest to check the proportional odds assumption. Declare a variable ordinal with label variable, or change it with recode.
None of these tools will decide the measurement level for you. They take the label you give the variable and offer you the tests that go with it, which is exactly why the decision has to be made in your notes rather than in the menu.
How to Report the Treatment in a Thesis or Paper
Report the scoring rule, the treatment, and the assumption in the same paragraph. Here are two templates you can adapt.
Ordinal treatment. “Responses to the five workload items used a five-point scale from strongly disagree (1) to strongly agree (5). Items were reverse-coded where necessary. Because the response categories are ordered but not equidistant, item responses were analysed as ordinal data. Descriptives are reported as the valid response base, median and interquartile range, with the full category distribution in Table 1. Group differences were tested with the Mann-Whitney U test, and effect size is reported as Cliff’s delta with a 95% confidence interval.”
Approximate interval treatment. “The five workload items were reverse-coded and averaged into a composite score ranging from 1 to 5. Internal consistency was acceptable (Cronbach’s alpha = .84). The composite distribution was unimodal and approximately symmetric (skewness = -.21), so it was treated as approximately interval and analysed with parametric methods. Group means are reported with standard deviations and 95% confidence intervals, and a sensitivity analysis using the Mann-Whitney U test produced the same pattern of results.”
For a single item, your results table wants the count and percentage in every category, the median category, the top-two-box percentage, and the valid response base. For a composite, you want N, mean, standard deviation, median, interquartile range, and a line stating the assumption you are making. Report both a mean and a median for composites so the reader can see whether the central tendency is doing any hiding.
If a reviewer objects, respond with the decision procedure rather than an assertion. State which of the five criteria you assessed, give the numbers, and point to the sensitivity analysis.
Common Errors and Better Alternatives
| Common error | Why it is a problem | Better alternative |
|---|---|---|
| Treating every category as a continuous value | Assumes equidistance that single items never guarantee | Report the distribution; analyse the item as ordinal |
| Analysing a composite item by item | Throws away the reliability you built and inflates Type I error | Analyse the composite once, then report item frequencies descriptively |
| Claiming Likert data are always ordinal or always interval | Neither blanket rule survives a reviewer’s third question | Apply the five criteria and state which ones you met |
| Reporting a mean for a single item with no justification | Implies a 3.6 sits between 3 and 4 in a measurable way | Use median and category percentages, or justify the composite scoring |
| Reversing item wording but not the numbers | Produces a composite where half the items point the wrong way | Reverse-code the values in the dataset and name the reverse items in the methods |
| Coding N/A or not sure as 0 or as the lowest scale point | Silently drags every mean and composite down | Declare them missing and report the valid response base per item |
| Using a sum score when respondents skipped items | Makes non-completion look like disagreement | Use the mean of completed items and state the minimum-completion rule |
| Skipping reliability before claiming a scale | Summed items that do not correlate are not one construct | Report alpha or KR-20 and the corrected item-total correlations |
| Reading Mann-Whitney U as a difference in medians | The test compares rank distributions, not centres | Report medians separately and give Cliff’s delta as the effect |
| Reporting a p-value with no effect size | With survey samples, significance is easy and magnitude is the finding | Add an effect size and a 95% confidence interval |
One more that shows up in journals rather than student work: treating ordinal results as if they were causal. A rank-based test tells you the two groups ordered their responses differently, nothing about why.
Frequently Asked Questions
Can a five-point Likert scale be treated as interval data?
A five-point item on its own should stay ordinal, because the wording does not guarantee equal gaps between categories. A set of five or more such items summed or averaged into a composite with adequate reliability, enough score points and a roughly symmetric distribution can be treated as approximately interval. The treatment must be justified in your methods, not assumed. A seven-point scale gives a wider range but does not by itself solve the equidistance problem.
Should each Likert item be analyzed separately or combined into a scale?
Combine them when the items were written to measure one construct, they correlate adequately, and your research question is about that construct. Then run a reliability check and analyse the composite. Keep items separate when you want to describe specific statements, when item content differs in tone or difficulty, or when reliability is poor. The most common student error is running a test on every item and reporting whichever result looks best.
Do Likert scores have to be normally distributed for a t-test or ANOVA?
The normality assumption applies to the outcome variable in the model, not to each individual item. A summed or averaged composite score with enough points often approaches normality, but you still have to check it with a histogram, a skewness statistic and a Q-Q plot. If skew is large, or the responses pile up at one end, switch to the rank-based alternative and report that assumption instead.
Should I report means or medians for a Likert scale?
Report the median and the full category distribution for single items, since a mean there implies distances the scale does not guarantee. For a validated composite, report the mean and standard deviation, and include the median alongside them so readers can see whether the distribution is skewed. Reporting both costs one extra line and removes most reviewer objections before they start.
Can SPSS, R, or Stata tell me whether Likert data are ordinal or interval?
No. Software takes the measurement level you declare and offers the tests that match it, which is why SPSS often presents t-tests and ANOVA for survey items by default. The decision is yours and rests on the scale structure, reliability, the number of score points and the distribution shape. Software helps you inspect those things, but it does not make the call for you.
Conclusion: Start With the Scale You Actually Built
Begin with the raw response format. Look at what you actually collected: a single agreement item, or several items that were designed to measure one thing. That answer settles most of the argument before any test is chosen.
Then apply the five criteria in order, check reliability before you claim a scale exists, and choose a method that matches the treatment you can defend. If the criteria are mixed, the ordinal route with medians, full distributions and rank-based tests is the safer answer, and it needs no apology.
Whatever you choose, write the scoring rule and the treatment into your methods section while the decision is still fresh, because that is the paragraph a reviewer will read first and the one a viva committee will ask you to explain. It also keeps the analysis reproducible for whoever picks the dataset up next, which in student projects is usually you in six months.