
To explain your statistics to a non statistical committee, change the order you present them in: say the finding in plain English first, give only the numbers that support it, say how sure you are, then state what you want the committee to decide. Most presentations fail because they open with sample size and the test used, and by the time the point arrives the room has already stopped following.
That is usually the whole problem. Committees are not assembled to assess your mathematics. They are assembled to approve a study, fund the next phase, adopt a recommendation, or sign off on a policy, and they will decide that based on what they can follow, not on what your software produced.
Everything below is built around that reality. It works the same for a thesis defense, an IRB or ethics committee, a grant panel, a clinical audit meeting, and a board briefing, because the underlying problem is identical in all of them: turning a correct analysis into a sentence a decision-maker can act on.
Table of Contents
- 1What You Need
- 2Step-by-Step: How to Explain Your Statistics to a Non Statistical Committee
- 31. Start with the decision or research question
- 42. Describe the sample and variables without unnecessary detail
- 53. Choose statistics that answer the committee’s question
- 64. Report the result in plain language
- 75. Connect the evidence to a cautious conclusion
- 86. Prepare for questions about assumptions and limitations
- 9Pick the visual that matches the question you are being asked
- 10Which Committee Are You Talking To?
- 11Plain-English Translations of the Terms Committees Ask About
- 12Questions Committees Ask and Answers That Hold Up
- 13Common Mistakes
- 14Frequently Asked Questions
- 15How do I explain statistics to someone with no statistics background?
- 16How do I explain a p-value without using statistics jargon?
- 17How do I tell a committee my results were not statistically significant?
- 18How should quantitative data be presented to a non-technical audience?
- 19Is it possible to over-explain statistics to a lay audience?
- 20How do I answer questions from a committee that does not understand statistics?
- 21Conclusion
What You Need
Assemble these seven items before you draft a single slide. If you cannot produce them, your analysis is not finished, and finishing the analysis is easier than defending an incomplete one in the room.
- The decision the analysis informs. One sentence, in the committee’s language, describing what they will vote on or approve.
- The key result in one sentence. Written with no statistical terminology in it at all.
- A supporting table or chart where the relevant number is the one the eye lands on first, not a grid of forty cells.
- The assumptions behind the result, with a note on which ones you checked and which ones you could not check.
- An effect size that describes the size of the difference or relationship, not just whether one was detectable.
- An uncertainty measure, usually a confidence interval, so you can say how wide the plausible range is.
- A one-sentence practical conclusion that names the action, not the topic.
Add one more thing that almost nobody prepares: a technical appendix with the full model output, assumption checks, and code. Somewhere in most committees sits one person who will actually read it, and giving that person something real to read converts your most dangerous critic into a reasonable one.
Hand the summary out at least 48 hours before the meeting. A committee that arrives having read your one-pager spends its time on the decision, not on decoding your structure.
Step-by-Step: How to Explain Your Statistics to a Non Statistical Committee
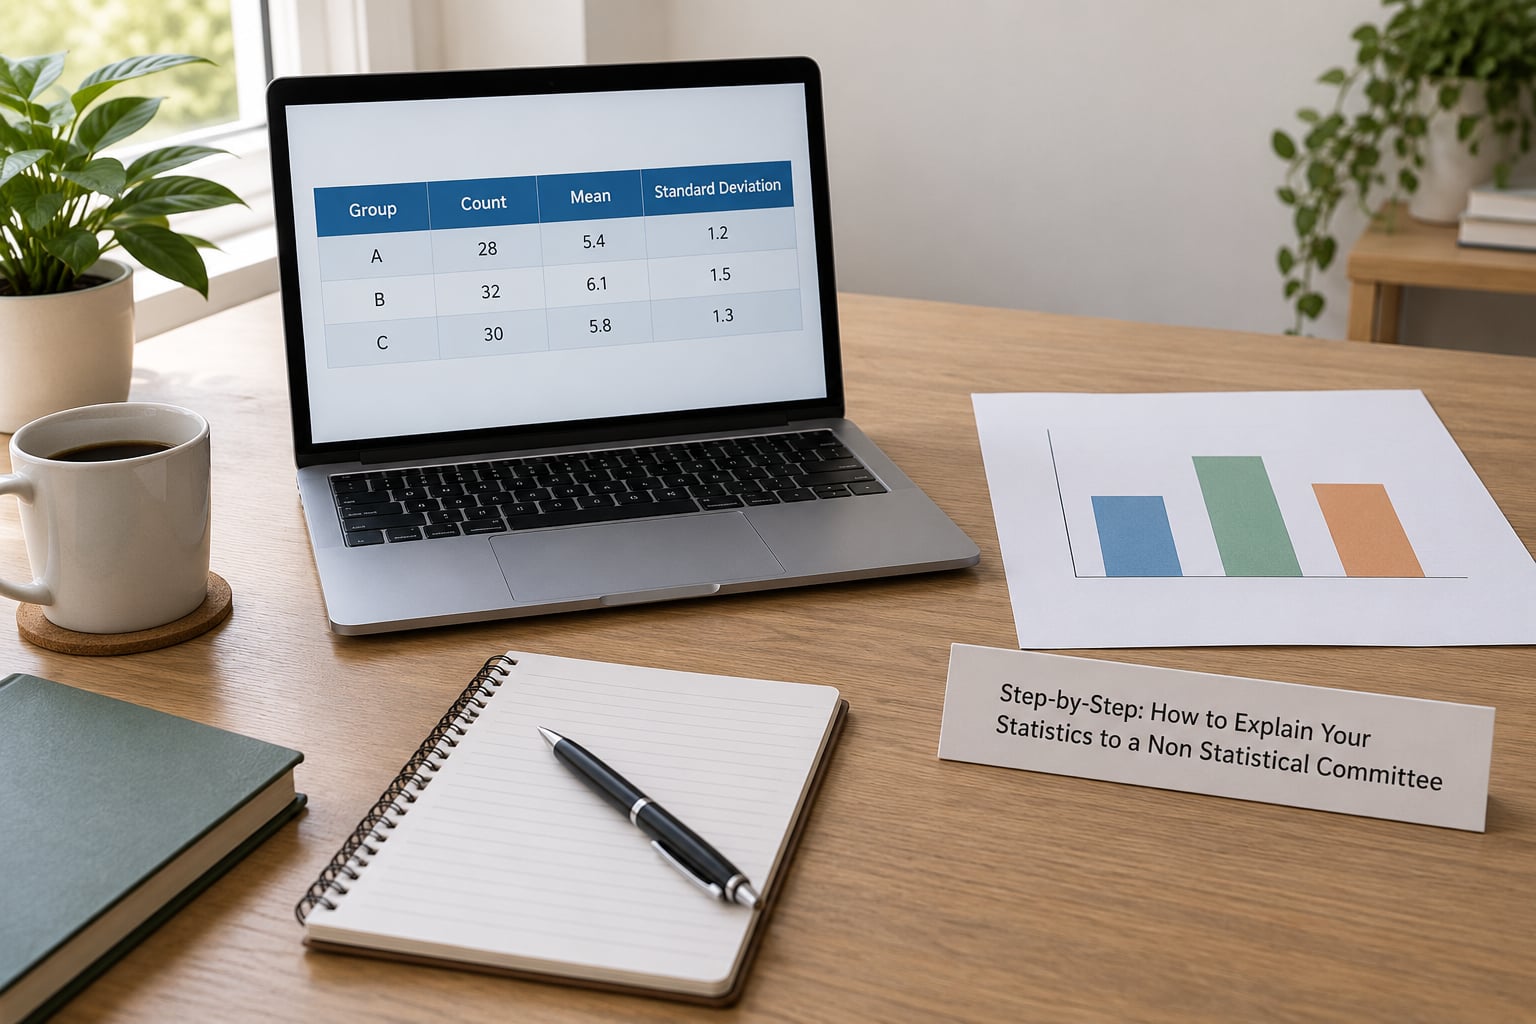
Six steps, in this order, will carry almost any analysis into a committee room that works. Work through them in order because each one sets up the next.
1. Start with the decision or research question
Open with what the committee is being asked to decide, not with what you did. A dissertation candidate who says “I ran a chi-square test on 214 responses” has lost the room before finishing the sentence. The same candidate saying “we tested whether students who attended the workshop scored higher on the final, and they did” has kept it.
Then define your variables in everyday words. If your outcome is a “Clinical Severity Index”, call it a severity score and add three words on what a high number means. If your predictor is “treatment arm”, say which group got which version. Aim for a definition anyone in the room could repeat correctly after hearing it once.
2. Describe the sample and variables without unnecessary detail
Give the committee four things: who or what you studied, how many, how you measured the main variables, and how the groups were formed. Everything else about the sample belongs in the appendix.
Size matters more than proportion to a non-statistician, so give the raw count. “We surveyed 412 staff across four departments” lands; “a representative sample was selected” does not. Where coverage is incomplete, say so in the same sentence. Committees forgive narrow samples far more readily than they forgive discovering a narrow sample on their own.
3. Choose statistics that answer the committee’s question
Match the statistic to the question the committee actually has, and explain its purpose rather than its formula. Comparing two groups needs a difference and its uncertainty. Asking what predicts an outcome needs a model you describe as “which factors move the number, and in which direction”. Looking for an association between two measures needs a correlation you can put in words: “as one goes up, the other tends to go up too”.
Say why you picked it in one sentence: “We used a comparison of group averages because we have two independent groups and one continuous outcome.” Committees rarely challenge a reasonable choice, and they almost always challenge an unexplained one.
4. Report the result in plain language
Each key finding gets one sentence that names the comparison, the direction, the size, the uncertainty, and what it means. Compare a technical sentence with a committee-ready one:
Before: “A Mann-Whitney U test was conducted and the result approached significance, p = .049, indicating a marginally significant difference between conditions on the delayed recall measure.”
After: “The intervention group scored about four points higher on delayed recall. That gap is small, our data are consistent with a gap anywhere from one to seven points, and the evidence sits right at the edge of what we would call reliable, so we treat it as a promising signal rather than a settled finding.”
The rewrite changed no numbers. It removed the test name, translated the p-value, and attached a meaning to the size of the gap.
Introduce each number with a short sentence of context. “On a five-point scale” tells the committee the four-point claim from an hour ago was impossible, and it prevents the misquoting that so often follows the meeting.
5. Connect the evidence to a cautious conclusion
Split your conclusion into two short parts: what the evidence supports, and what it does not. The first tells the committee what they can act on. The second tells them what would be a mistake to assume, which is where you earn trust for the next study you propose.
Then name the action. “Approve the pilot and fund the second phase” is a conclusion. “The results are promising and suggest further investigation is warranted” is a hedge, and committees are busy. If the evidence is genuinely thin, say what would change that: a larger sample, a second site, a follow-up at six months.
6. Prepare for questions about assumptions and limitations
Know which assumptions your result rests on, and rank them by how much they would matter if they failed. A non-normal distribution in a large sample is a footnote. A convenience sample of volunteers is the whole story, and it belongs in your opening rather than your limitations slide.
Have three limitations ready, each phrased as a limit plus a mitigation. “These were self-reported, so responses may reflect what participants wanted to seem like; we checked for social desirability skew on three items and it was low.” That answer does more work than ten minutes of reassurance.
Finally, decide in advance which requests you will decline live. If a committee member asks you to run a different analysis in the room, agree on what question it would answer and offer to do it after the meeting, when you can check it properly rather than guess.
Pick the visual that matches the question you are being asked
Committees are not evaluating your chart design. They are trying to answer one question, and the right chart answers it before you speak.
| The question in front of the committee | Use this | The trap to avoid |
|---|---|---|
| Which group did better? | Bar chart with two or three bars | A table of every group’s mean, standard deviation and sample size |
| Did this change over the year? | Line chart with one line per group | Fourteen separate monthly columns nobody can trace |
| Do these two things move together? | Scatter plot with one trend line | A correlation coefficient with no picture behind it |
| What drives the outcome? | Ordered bar chart of effect estimates with confidence intervals | Full regression output pasted into the slide |
| How confident are we? | Interval plot or an error bar on the key estimate | A single point estimate with no range |
| What exactly are the numbers? | Short table, three to five rows | Raw data export with forty columns |
Put the sentence you want remembered in the chart’s title rather than in your narration. Titles are read silently while you talk over them, which makes them the only part of the visual most of the room actually absorbs.
Which Committee Are You Talking To?
The same six steps apply everywhere, but what each group is deciding changes your opening sentence and how much detail you owe them. Two minutes spent working out which row below describes your room saves a long afternoon of answering the wrong question well.
| Committee | What they decide | What they care about most |
|---|---|---|
| Thesis or dissertation defense | Whether the candidate has done defensible work | Methodological soundness, and whether you understand your own analysis |
| IRB or ethics committee | Whether participants are protected | Risk to participants, consent, data handling, and any change that increases risk |
| Grant review panel | Whether to fund the next phase | Feasibility, team capability, and what the funding buys |
| Clinical audit meeting | Whether practice should change | Patient and safety implications, and whether the finding is actionable now |
| Board or budget committee | Whether to commit money or approve a policy | Cost, exposure, and the recommendation itself |
| Policy committee | Which policy to adopt | Whether the evidence supports the specific policy being debated |
Two rules follow from that. Never simplify past the point where the group’s actual mandate becomes unclear, because an ethics committee needs enough detail to judge participant risk and a board needs none of it. And in clinical, safety, or legal contexts, keep the uncertainty language in the summary itself rather than in a footnote, since that is the part people quote later without the rest of the document.
Plain-English Translations of the Terms Committees Ask About
Committee members rarely ask about statistics generally. They ask about a handful of specific terms, usually because a well-meaning colleague mentioned them. Having a clean translation ready saves several minutes of fumbling in the middle of a decision.
| Term | What it actually means | What to say to the committee |
|---|---|---|
| p-value | How surprising the result would be if there were no real relationship | “If there were no effect at all, a difference this large would turn up by chance about 3 times in 100.” |
| Statistical significance | A threshold was crossed, nothing more | “This result is unlikely to be chance alone. It does not tell us the effect is large or important.” |
| Confidence interval | A plausible range for the true value | “Based on our data, the real value is likely somewhere between these two numbers.” |
| Effect size | How big the difference is in real units | “The gap is four points on a five-point scale, which is the part that matters for practice.” |
| Sample size | How much evidence you gathered | “We measured 412 people, so small differences would not show up reliably.” |
| Standard deviation | How spread out individual scores were | “Individual scores varied a lot around that average.” |
| Null result | You found no reliable effect | “We looked carefully and did not find a dependable difference, which is a real answer, not a failed study.” |
| Correlation | Two things move together | “These rise and fall together. That is a pattern, not proof that one causes the other.” |
| Regression coefficient | How much the outcome moves per unit of a factor | “Each additional hour of contact was associated with about two points of improvement.” |
| Outlier | One unusual value that can distort averages | “One response was far outside the range; we ran the analysis with and without it and the conclusion held.” |
| Margin of error | The wobble around your estimate | “Our estimate is plus or minus about three points.” |
| Assumption | Something your method needs to be true | “This method assumes the groups are independent, and they were.” |
Questions Committees Ask and Answers That Hold Up
Six questions come up in nearly every session. Answering them in a fixed, calm shape saves you from improvising under pressure.
Why did you choose that method? Answer with the design, not the technique. “We have two groups and one score per person, so we compared the group averages” is a complete answer and satisfies most rooms.
Why not just show us the raw numbers? Raw numbers are in the appendix and you are glad to walk through them. The chart exists because forty individual scores hide the pattern that forty individual scores cannot show.
Is the result significant? Give the plain-language version: unlikely to be chance, small in size, and what you are therefore doing about it. If the honest answer is no, say the evidence did not clear the bar and describe what you would need.
Does this cause that? Only if your design supports it. Otherwise: “These move together. I cannot tell you from this design whether one drives the other or something else influences both.”
Why is the sample so small? Explain the constraint honestly, then explain what you did about it: the precision of your estimate, the checks you ran, and whether the conclusion is sensitive to sample size.
Can you run a different analysis right now? Take the question, not the request. “That comparison would tell us whether the difference holds in the second site, which is a good question. Give me until Thursday and I will bring you the answer properly checked.”
Common Mistakes
Leading with the method. The committee forms its judgment in the first ninety seconds, and it is forming one about whether you have a point. Move the method to the appendix and open with the finding.
Reporting significance and nothing else. A p-value without an effect size tells the committee you found something detectable and nothing about whether it matters. Always pair the two, in that order of usefulness to them.
Treating a p-value as a probability your result is true. A p-value of .03 does not mean there is a 97% chance the effect is real. Say what it actually is: how surprising the result would be if there were no effect. This is the most common overclaim in the room and the easiest to fix in one sentence.
Using causal language for an association. “Improved,” “led to,” and “caused” all assert more than a comparison can support unless the design earns it. Stick to “was higher in,” “was associated with,” and “we cannot tell direction.”
Hiding the uncertainty. Reporting a single number as if it were exact invites the question that ends your credibility. Give the range every time, even when it is inconvenient.
Dumping jargon. Test names, variable labels, and software output belong in the appendix. If a term is on your slide, you should also be able to say what it means in one sentence a non-expert would repeat.
Presenting results with no practical interpretation. Numbers without a consequence leave the committee to invent one, and they will invent a different one. End every finding with “which means” and a sentence about action.
Overloading the meeting with detail. Two or three findings presented clearly beat twelve findings rushed through. Put the rest in the handout and say so, so nobody thinks you buried a problem.
Guarding limitations instead of offering them. Committees find limitations anyway, usually in the discussion rather than in your summary. Naming the important ones first is what turns a weakness into a sign that you understand your own work.
Frequently Asked Questions
How do I explain statistics to someone with no statistics background?
Start with the decision they need to make, then state your finding in one ordinary sentence. Add only the numbers that support it, attach the scale so a number like four points means something, and finish with what you recommend. Push the test names and the model output into a technical appendix. Most audiences follow this comfortably, because the structure matches how decisions actually get argued.
How do I explain a p-value without using statistics jargon?
Say how surprising the result would be if there were no real relationship. A p-value of .03 means that a difference that large would turn up by chance roughly three times in a hundred. Then say plainly that this is not the probability that your result is true, which is the mistake almost every audience assumes. Finish by pairing it with the size of the effect so significance never travels alone.
How do I tell a committee my results were not statistically significant?
Report it as a finding rather than a failure, and keep the tone flat. Say that you looked carefully and did not find a dependable difference, give the range your data can rule out, and explain what that range still permits. Then state what evidence would settle the question. Committees handle honest null results well; they handle discovered overclaims very badly.
How should quantitative data be presented to a non-technical audience?
Match the visual to the question. Use a bar chart for comparing a small number of groups, a line chart for change over time, a scatter plot for a relationship between two measures, and a simple table for exact values. Annotate the chart so the point you are making is written on it in words. Remove gridlines, legends, and any axis that does not carry meaning for the decision.
Is it possible to over-explain statistics to a lay audience?
Yes, and the usual cause is honesty taken too far. Reciting every test, assumption, and diagnostic tells a non-technical room that you want credit for complexity rather than help with a decision. The right depth is the smallest set of facts that lets someone judge the conclusion, plus a technical appendix for the one member who wants to verify it.
How do I answer questions from a committee that does not understand statistics?
Translate the question first, because a statistical objection is usually a practical one wearing a technical coat. If a member asks about a normality assumption, the real question is often whether one unusual value drove the result. Answer the practical version, mention the technical name once so they know you understood the original, and offer the full detail in the follow-up. Never let a technical question turn into a jargon contest.
Conclusion
Begin with the decision the committee has to make, then report the smallest set of statistics that lets them judge it. Give every number a scale, a size, and a range, translate the terminology before it is asked about, and put the full output in an appendix for the reviewer who will check it anyway.
Close by naming your important limitations yourself, so nobody discovers them first, and end with a specific ask. If you take one habit from this, make it the before-and-after rewrite of your own results paragraph. It is the fastest way to see how much of your explanation the method was doing for you, and how much of it your words have to do on their own.