
Cleaning survey data before analysis means turning a raw questionnaire export into an analysis-ready dataset: drop duplicates and low-quality responses, code missing values on purpose, standardise formats, validate ranges, and record every change you made. Work through it in a fixed order, keep the raw export untouched, and your results will hold up under review.
The steps, in short:
- Preserve the raw export and work on a copy.
- Audit the file structure and compare it with the codebook.
- Remove duplicates and invalid records.
- Screen for speeders, straightliners, and fraudulent responses.
- Standardise answers and recode values into consistent codes.
- Check numeric ranges and data types.
- Handle missing values with a documented method.
- Validate, log, and save a reproducible analysis-ready file.
Cleaning is where most of the hidden time goes. Practitioners routinely put it at 60 to 80 percent of an analysis project, and none of it shows up in the final report even though every defect left in the raw file spreads into every frequency table, cross-tab, and significance test that follows.
What follows is the workflow I use, in the order that keeps decisions defensible: audit first, exclusions second, recoding third, missing data last.
Table of Contents
- 1What You Need
- 2Step-by-Step: How to Clean Survey Data Before Analysis
- 3Step 1: Preserve the Raw Survey Export
- 4Step 2: Inspect Variables, Rows, and Coding
- 5Step 3: Remove Duplicates and Invalid Records
- 6Step 4: Standardize Answers and Recode Values
- 7Step 5: Check Numeric Ranges and Data Types
- 8Step 6: Handle Missing Values Deliberately
- 9Step 7: Validate, Document, and Save the Final File
- 10The Eight Core Survey Data Problems and How to Fix Them
- 11Which Tool Handles Which Step
- 12Common Mistakes to Avoid When You Clean Survey Data
- 13How to Clean Survey Data Without Losing Good Respondents
- 14Frequently Asked Questions
- 15What are the steps involved in cleaning data before analysis?
- 16Can you give me an example of data scrubbing?
- 17How do I deal with missing values in data cleaning?
- 18What counts as a duplicate survey response?
- 19How do I detect straightlining and speeding without removing good responses?
- 20How do I know when my survey data is ready for analysis?
- 21Conclusion
What You Need

Start with five things before you touch a single cell.
- The raw survey export, downloaded fresh from Qualtrics, SurveyMonkey, Google Forms, or your panel provider, in CSV format if it is offered.
- The questionnaire and the codebook: question text, value codes, skip logic, and the survey version respondents actually saw.
- A working tool: Excel or Google Sheets for a first look, then SPSS, R, Python, or a visual preparation layer once the cleaning gets real.
- A decision log, whether a text file, a spreadsheet tab, or a section in your thesis appendix.
- A backup copy of the original, on a separate drive or cloud folder, that never gets opened for editing.
That codebook matters more than people expect. Survey software exports usually strip the labels, so a column headed q7 might hold 1 to 5, or 0 to 10, or four text categories, and the export itself will not tell you which.
Cleaning has to happen before frequency tables, significance tests, regression, or reporting, because those steps assume the file is already tidy. A single unlabelled 9 sitting in a 1 to 5 scale will quietly distort a mean, and no chart will show you where it came from.
Step-by-Step: How to Clean Survey Data Before Analysis
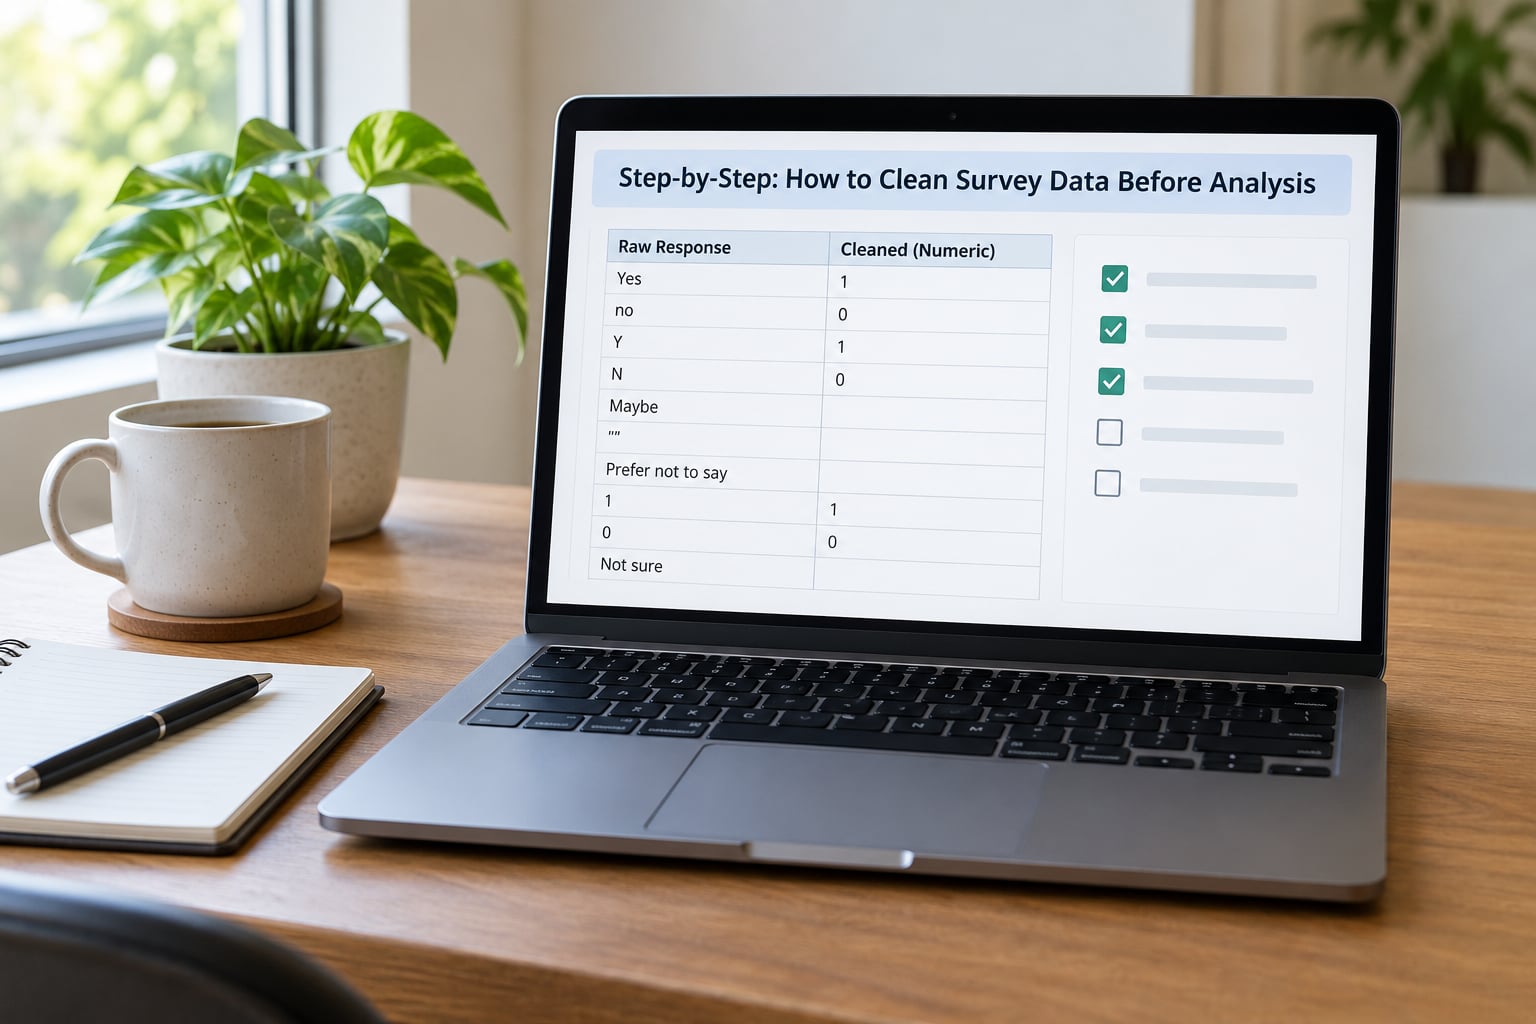
Seven steps, in this order. Write the exclusion rules before you look at the data, not after, and you will avoid the accusation of cleaning your way to a preferred result.
Step 1: Preserve the Raw Survey Export
Download the export again from the survey platform, keep it untouched, and record the collection dates and the survey version in the decision log. Then copy it and rename the working file with something like analysis_v1_working.csv so the original is never at risk.
To confirm the backup is real, open it, count the rows and columns, and check that the first and last few records match the platform’s own response summary. If those numbers disagree, re-download before you continue; it is far easier to fix now than after two hours of edits.
From this point on, every cleaning action runs on the working copy, ideally as a script you can re-run rather than manual edits you cannot reproduce.
Step 2: Inspect Variables, Rows, and Coding
Open the export and identify the rows, which are respondents, and the columns, which are questions. Then map the labels: value codes, missing-value codes, skip patterns, and any multi-select fields that exported as one dummy column per option.
Compare the export against the questionnaire side by side. You are looking for three things: questions that exist in the instrument but not the file, questions with a different wording than you remember, and value labels that differ from what the codebook says.
Check the header row for platform junk too. Exports often carry metadata rows above the real header, timestamp columns with mixed formats, and respondent metadata such as IP address, device, and panel member ID mixed in with the answers. Decide now which of those you need for screening and which you drop from the analysis copy.
A 30-minute pre-flight audit is worth it. In the raw file, count rows, count columns, and compare both with the platform’s response summary. Then look at missingness per column, the range of each numeric variable, and the first twenty rows. Any number that disagrees with what you expect at this stage is still cheap to fix; the same problem discovered after recoding costs you the whole morning.
Step 3: Remove Duplicates and Invalid Records
What counts as a duplicate is not the same as two identical rows. A duplicate usually means one person, two submissions, and you need more than one signal to confirm it: a repeated email or panel ID, the same device or IP address, submission timestamps seconds apart, or a byte-identical response string.
Reddit respondents on cleaning survey data almost always recommend triangulating IP address, email, and completion time rather than trusting any single one. Panels and offices share IPs, and legitimate retakes look identical on one field and different on the others, so require agreement between at least two signals before you remove a case.
Also screen for records that fail the design rather than the data: respondents outside the eligibility screen, partial responses below your completion threshold, and impossible timestamps such as a submission recorded before the survey opened. For anything unusual but not clearly invalid, flag it for review instead of deleting on sight. Deleting first and investigating later is how good respondents end up gone.
Step 4: Standardize Answers and Recode Values
Consistent coding is what makes a cross-tab readable. Decide how blanks, don’t-know responses, “other” text, and refusals are represented, and apply the same rule to every variable that means the same thing.
Watch for the usual traps: negative numbers used as missing markers, “Yes” and “yes” and “Y” and “1” all meaning the same answer, and open-text categories that could sit under three labels. A new code is justified when a genuine category appears that the instrument did not anticipate, and only when you keep the original text so the decision can be audited later.
Sequencing matters here. Open-ended and other-specify answers are usually recoded in the wrong order. The usual sequence is: verify the export, remove duplicates, validate ranges, then standardise and recode. Recoding first and validating afterwards means you spend your time fixing values you were always going to delete. The steps here run in the order that wastes the least effort; if you prefer a different sequence, keep the same logic and document it.
Step 5: Check Numeric Ranges and Data Types
Compare every numeric variable with its plausible minimum and maximum: age, scores, income bands, and each Likert item against its scale points. Anything outside those bounds is either a coding error, a mistyped entry, or a value that needs a decision recorded in the log.
Convert text numbers only when the conversion is unambiguous. “45” becomes 45; “forty-five”, “45 yrs”, “45.0 USD”, and “4-5” need human judgment, and guessing turns a recoverable answer into a fabricated one.
Handle reversed Likert items next. Recode the reversed scale to match the others, label it clearly, and only then compute scale totals. Outliers deserve the same care: a genuine extreme value is a finding, while a value outside the possible range is an error, and they need different treatment.
Step 6: Handle Missing Values Deliberately
There are at least four kinds of missing data in a survey file, and they are not interchangeable. Structural missingness happens when a question was never shown to that respondent. Item nonresponse is a shown question left blank. Skipped cells appear where a skip pattern routed someone past a question. Lost values are technical failures where the platform dropped an answer.
Code each type separately, and never replace a missing value with an arbitrary number. A blank in an income question is information about the respondent; a zero is an answer they never gave.
| Method | When it fits | What it costs |
|---|---|---|
| Listwise deletion | A small number of items is missing and cases are lost cheaply | Throws away entire respondents and shrinks the base for every analysis |
| Pairwise deletion | Missingness is scattered and you want to keep sample size | Each statistic uses a different sample, so comparisons get awkward |
| Single imputation | Missingness is under about 5 percent on a key variable | Understates variance and shrinks standard errors |
| Multiple imputation or FIML | Missingness is moderate or your method assumes it | More work, and it needs the analysis model specified up front |
A common rule of thumb is that more than 5 percent missing on a key variable warrants imputation or a documented exclusion decision rather than silent deletion. Whichever route you take, report the final analysed sample size for every question, because base sizes change once exclusions and skips are applied.
Step 7: Validate, Document, and Save the Final File
Recheck the row count against your exclusion log, list missingness per variable, and scan the frequency tables for codes that should no longer exist. Confirm value labels survived the export, that filters did not hide any rows, and that every derived variable, such as a scale total, has a documented formula.
Maintain the change log as you go: what you removed, what you recoded, what you renamed, and why. Then save three files with unmistakable names, a raw export that never changes, a cleaned file with all corrections applied, and an analysis-ready file with derived variables and labels in place.
If you weight your data, cleaning and weighting are not separate worlds. Confirm the weight variable survived the export with valid values, and run your checks both weighted and unweighted, because heavy weights amplify every remaining defect.
The Eight Core Survey Data Problems and How to Fix Them
Eight problems account for nearly everything analysts hit in a raw export. This table is the fastest triage list I know of, and it doubles as a quality-control checklist for the export your panel just delivered.
| Problem | How to detect it | How to fix it |
|---|---|---|
| Duplicate responses | Repeated email, panel ID, device or IP; identical response strings; timestamps minutes apart | Require two matching signals, keep the earliest complete submission, log each removal |
| Missing or blank answers | Empty cells, N/A, -99, or a 9 in a scale that stops at 5 | Assign one missing code per variable, record its meaning, exclude it from frequencies |
| Speeders and straightliners | Completion time far below the median; the same answer chosen across a whole matrix | Set thresholds before analysis, flag, review, and exclude with the count reported |
| Out-of-range values | Age 14 or 212, a 7 on a 1 to 5 item, a score above the scale maximum | Check against the codebook, correct the entry or recode to missing, never silently clamp |
| Inconsistent formats | Yes, Y, 1, and true all used for one question; dates in several formats | Pick one code per variable and recode the rest, keeping the original column |
| Inattentive responses | Failed attention check items, pattern answers, long repeated strings in text boxes | Use instructed-response items, screen on them, and report the exclusion rate |
| Bot and panel fraud | Impossible completion times, identical metadata, uniform straight-lining, promotional text | Cross-check IP, device, timestamps, and duplicate text, and apply conservative exclusion thresholds |
| Open-text noise | Single-word answers, the same sentence repeated across respondents, spam and promotions | Apply a minimum-length rule, drop repeated strings, then code the remainder into a frame |
Which Tool Handles Which Step
The steps do not change with the software. What changes is how much of the work you can automate and how easily you can re-run it next month when a second wave arrives.
| Tool | Best for | Cleaning steps it handles well |
|---|---|---|
| Excel or Google Sheets | Small exports and a first look | Row and column counts, spotting blanks, quick frequency tables, manual review of open text |
| SPSS | Students and researchers who want a fixed, auditable sequence | Value labelling, missing-value declarations, recoding, range checks, weighting, all in saved syntax |
| R (dplyr, tidyr) | Reproducible pipelines and multi-select reshaping | Chained cleaning steps, deduplication, pivot from wide to long, scripted checks |
| Python (pandas) | Large exports, merging with CRM or behavioural data | Type casting, bulk recodes, joins, validation rules that run in a loop |
| Tableau Prep or Power Query | Hands-off recurring refreshes and visual audit | Pivoting, splitting columns, join cleanup, and a visible before-and-after step list |
Here are the same two operations in three tools, so you can pick the one that fits your project. The goal is a script you can re-run, not a set of clicks you have to trust.
Remove duplicates in SPSS, R, and Python:
/* SPSS: sort so the earliest submission comes first */
GET FILE='survey_raw.sav'.
SORT CASES BY email(A) starttime(A).
SAVE OUTFILE='survey_sorted.sav'.
EXECUTE.
library(dplyr)
raw <- read_csv("survey_raw.csv")
clean <- raw |>
  arrange(email, start_time) |>
  distinct(email, .keep_all = TRUE)
import pandas as pd
raw = pd.read_csv("survey_raw.csv")
clean = (raw.sort_values(["email", "start_time"])
            .drop_duplicates(subset="email", keep="first"))
Declare a missing-value code in all three:
/* SPSS */
MISSING VALUES q3 (9).
RECODE q3 (9 = SYSMIS).
clean <- clean |> mutate(q3 = na_if(q3, 9))
clean["q3"] = clean["q3"].replace(9, pd.NA)
For click-all-that-apply questions, the export usually arrives wide, with one dummy column per option. Pivoting to long format, one row per respondent and per option with a selected flag, makes cross-tabs and regression much easier to write, at the cost of a longer file. Keep the respondent ID through the pivot or you lose the ability to join anything back.
long <- clean |>
  pivot_longer(cols = starts_with("q12_"),
               names_to  = "option",
               values_to = "selected")
Common Mistakes to Avoid When You Clean Survey Data
These are the errors I see most often, and the fix is usually smaller than the mistake.
Overwriting the raw file. Fix: keep the untouched export in a folder you do not work in, and never open it for editing. If your cleaning is manual, work on the copy only.
Deleting unusual responses without investigating. A 62-year-old in a student panel or a 400 on a satisfaction scale may be the most informative case in the file. Review flagged records against the response text and metadata before excluding anything.
Treating every blank as zero. Fix: code missing as missing. Zeros in survey data usually mean a real answer, and mixing the two corrupts every average downstream.
Changing the original codes. If your instrument used 1 to 5 and you recode to 0 to 4, keep both columns, or record the mapping in the codebook. Reviewers and future you will need it.
Coding open text without a frame. Build the coding categories first, then assign each response to one. Free text is the messiest part of any survey file: nonsense, all-same-words answers, and promotional spam usually dominate the manual effort. A minimum-length rule, dropping strings that repeat verbatim across respondents, and a documented coding frame cut that work substantially.
Checking scale totals but not the individual items. A total can look reasonable while one item is backwards. Verify each item’s range, then reverse-code, then check reliability with Cronbach’s alpha before you build anything on the scale.
Two more habits pay off. Report how many cases were removed and what share of the sample that is, since the base changes at every stage of exclusion. And prefer conservative exclusion rules; the survey-methods literature on panel fraud recommends erring toward keeping borderline responses rather than deleting on a single weak signal.
How to Clean Survey Data Without Losing Good Respondents
Over-cleaning is the quiet risk. Every threshold you set is a decision to remove real people, and the ones that hurt most are the impatient, the honest outliers, and anyone whose device looked unusual to your fraud filter.
Three habits keep that in check. Write the exclusion rules first, so they describe the design rather than the data. Prefer two independent signals over one before excluding a case. And keep every removed record in a quarantine file with its reason attached, so a decision can be reversed later without re-running the whole workflow.
What cleaning cannot fix is worth stating plainly: it repairs structure, coding, and completeness. It cannot repair a badly worded question, an unrepresentative sample, a survey that went out to the wrong people, or a response pattern you never measured. And it does not remove errors outright; it surfaces them, and a human decides.
Frequently Asked Questions
What are the steps involved in cleaning data before analysis?
The steps are: preserve the raw export, audit the file structure and coding, remove duplicates and invalid records, screen for speeders and low-quality responses, standardise and recode values, check numeric ranges and data types, handle missing values with a documented method, then validate and log the result. Keep the raw file untouched, write exclusion rules before inspecting the data, and save separate raw, cleaned, and analysis-ready copies.
Can you give me an example of data scrubbing?
A raw row might read age = 14, satisfaction = 7 on a 1-to-5 scale, country = united states, and income = blank. Scrubbing sets age to missing pending verification, recodes satisfaction to missing, standardises country to a single code, leaves income as missing rather than zero, and records all four decisions in a cleaning log. The cleaned row then behaves correctly in every frequency table and test.
How do I deal with missing values in data cleaning?
First classify the missingness: never shown, skipped, item nonresponse, or technically lost. Then pick a method. Listwise deletion is simplest but shrinks your base, pairwise keeps more cases but complicates comparisons, and imputation or FIML suits moderate missingness. As a rule of thumb, more than 5 percent missing on a key variable warrants imputation or a documented exclusion decision. Never fill a blank with zero or an arbitrary number.
What counts as a duplicate survey response?
One person submitting twice. Treat it as a duplicate when at least two signals agree: the same email or panel ID, the same device or IP address, submission timestamps minutes apart, or a byte-identical response string. No single signal is enough, because offices and campuses share IPs and legitimate retakes look identical on one field. Keep the earliest complete submission and log every removal.
How do I detect straightlining and speeding without removing good responses?
Look for completion times far below the median for the survey, and for respondents who chose the same option across a whole response matrix or who answered open-text items with a long repeated string. Set those thresholds before you inspect the results, combine at least two signals before excluding anyone, and keep removed cases in a quarantine file with reasons attached. Report the exclusion rate so the loss of sample is visible.
How do I know when my survey data is ready for analysis?
It is ready when the row count matches your exclusion log, missingness per variable is known and within your stated thresholds, all values fall inside their codebook ranges, value labels survived the export, and every recode and derived variable is documented in a change log that someone else could follow. If you cannot describe how a cell came to hold its value, it is not finished.
Conclusion
Cleaning survey data before analysis follows one sequence: preserve the raw export, audit it against the codebook, remove duplicates and invalid records, screen for low-quality responses, standardise and recode, validate ranges, handle missing data deliberately, then document and save.
Start today by downloading a fresh export, storing an untouched copy, and writing your exclusion rules before you open the data. From there, work through the steps and keep a log of every change, and the analysis you run afterwards will be reproducible, defensible, and worth the time.