You classify a variable by asking one question: what do its values genuinely support? If you can only name the values, the scale is nominal. If you can also rank them, ordinal. If equal gaps between values mean the same thing throughout, interval. If zero means the complete absence of what you measured, ratio. That test, applied honestly, decides how to measure variables on nominal, ordinal, interval and ratio scales and which statistics you are allowed to run afterwards.
The classification itself takes about a minute per variable. What takes longer is resisting the urge to treat every number as a quantity, which is where most student analyses go wrong.
Table of Contents
- 1What Are the Four Levels of Measurement?
- 2How to Identify the Measurement Level of a Variable
- 3How to Measure Variables on Nominal, Ordinal, Interval and Ratio Scales
- 4Nominal Variables: Categories Without an Ordered Ranking
- 5Ordinal Variables: Categories With Meaningful Order
- 6Interval Variables: Equal Intervals Without a True Zero
- 7Ratio Variables: Equal Intervals With a Meaningful Zero
- 8How to Code and Enter Measurement Variables in SPSS, Stata, or R
- 9Which Statistical Methods Fit Each Measurement Scale?
- 10How to Report Measurement Levels in a Research Paper
- 11Common Mistakes That Distort the Analysis
- 12Quick Self-Test for Naming the Scale
- 13Frequently Asked Questions
- 14Is a Likert scale interval or ratio?
- 15What differentiates interval from ratio scales of measurement?
- 16Can you take the mean of ordinal data?
- 17Is a 4-point or 5-point Likert scale better?
- 18What is the difference between qualitative and quantitative variables?
- 19Why can a variable never be upgraded to a higher measurement scale?
What Are the Four Levels of Measurement?
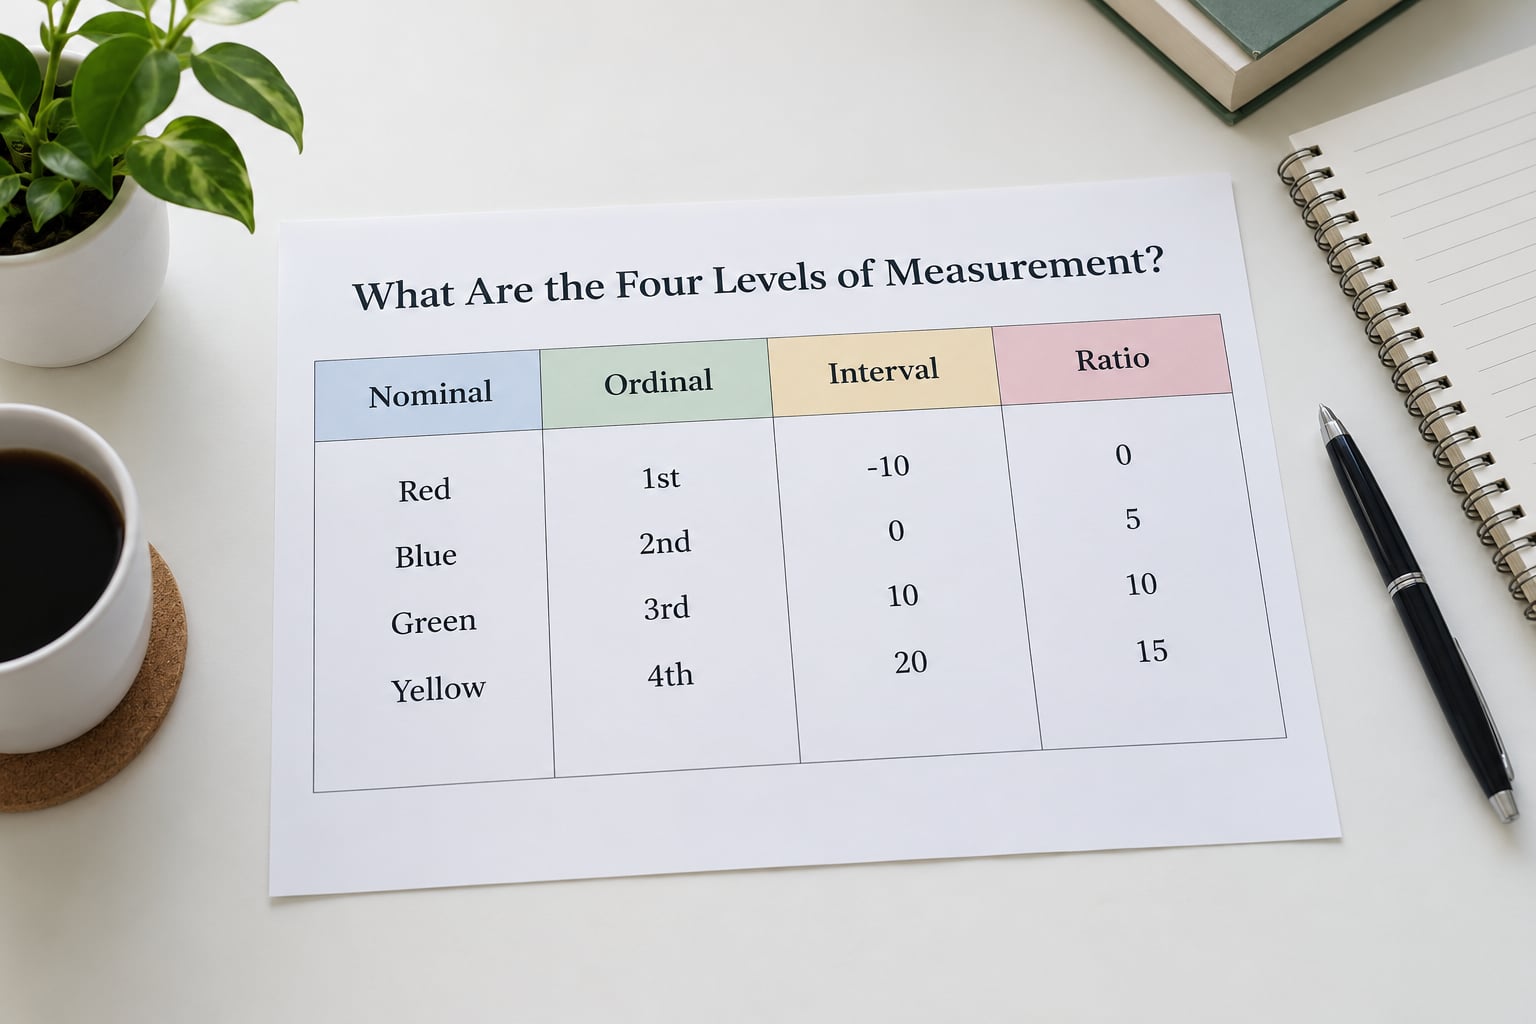
Stanley Smith Stevens proposed the four levels of measurement in 1946, and they form a nested hierarchy rather than four unrelated categories. Each level adds one property to the one below it.
- Nominal is naming only. Blood type, study group, zip code.
- Ordinal adds meaningful order. Likert responses, income bands, class rank.
- Interval adds equal intervals. Temperature in Celsius, IQ scores, pH.
- Ratio adds a true zero. Weight, duration, revenue, age.
The property table is the fastest reference once you understand the logic behind it.
| Property | Nominal | Ordinal | Interval | Ratio |
|---|---|---|---|---|
| Meaningful order | No | Yes | Yes | Yes |
| Equal intervals | No | No | Yes | Yes |
| True zero | No | No | No | Yes |
| Mode | Yes | Yes | Yes | Yes |
| Median | No | Yes | Yes | Yes |
| Mean | No | Not without justification | Yes | Yes |
| Add and subtract | No | No | Yes | Yes |
| Multiply and divide | No | No | No | Yes |
| Ratios and percentages | No | No | No | Yes |
Read that table downward and you get the rule that matters most: arithmetic permission grows with the level, and it never shrinks. A mean computed on a nominal variable is not a weak result, it is a meaningless number.
How to Identify the Measurement Level of a Variable
Work through these five steps in order for each variable in your dataset. Stop at the first yes.
- Can you only label the values? If one category is never “more” than another, it is nominal.
- Can you rank the values? If greater-than and less-than statements are true, you have ordinal. Ask whether the gaps are equal; if not, stop here.
- Are the intervals equal? If the distance from 1 to 2 always equals the distance from 7 to 8, you have interval.
- Does zero mean the complete absence of the property? If zero degrees means no temperature whatsoever, ratio. If zero degrees Celsius still allows liquid water, interval.
- Can you state a ratio? If 20 kg is genuinely twice 10 kg, ratio arithmetic is valid.

Four quick walk-throughs show how the steps land.
Zip code 90210. You can name it and you can sort it, but is 90210 “greater than” 10001 in any meaningful sense? Distance between two zip codes is not the distance between two places. Nominal.
“Somewhat satisfied” coded 3. Ordering is real: 4 outranks 3. But is the gap from 3 to 4 the same size as the gap from 1 to 2? No way to know, and no standard scale guarantees it. Ordinal.
Temperature of 20 degrees Celsius. Every 10-degree step is the same physical change. But 0 degrees Celsius is not an absence of temperature, it is a specific point on the scale. Interval.
Reaction time of 400 milliseconds. Equal steps, and zero milliseconds means the response did not happen at all. Ratio.
Two traps sit in step two. A number is not a measurement level, and a code is not a value. Coding “female” as 1 and “male” as 2 lets you enter the data; it does not make 2 twice as much as 1.
How to Measure Variables on Nominal, Ordinal, Interval and Ratio Scales
Each scale gets handled differently at the coding stage and at the analysis stage. Here is the practical version.
Nominal Variables: Categories Without an Ordered Ranking
A nominal variable is any variable whose values are mutually exclusive labels with no inherent ranking. Blood type, treatment group, gender, marital status, and the survey site a respondent came from all qualify. A nominal scale offers you exactly one measure of central tendency, the mode, because every other summary assumes an order that does not exist.
Code nominal variables as integers with value labels, keep the labels short, and never let the numbers leak into your write-up as quantities. Report counts and percentages, present a frequency table or a bar chart, and test associations with a chi-square test of independence or cross-tabulation. For one nominal variable split by another, a bar chart reads faster than a table for most audiences.
Ordinal Variables: Categories With Meaningful Order
An ordinal variable is a nominal variable whose categories have a defensible rank order. Likert agreement items, satisfaction ratings, class standing, income brackets, and Likert-style semantic differentials all sit here. The categories are ordered but the distances between them are not, so the median and the mode are legitimate while the mean is a convention rather than a fact.
When you code an ordinal variable, order the numeric codes to match the real ranking: 1 = strongly disagree through 5 = strongly agree. That ordering matters because rank-based tests read the numbers as ranks, and reversing your codes silently inverts every result. Summarise with median and interquartile range or a full frequency breakdown. For two groups use the Mann-Whitney U test; for three or more, the Kruskal-Wallis H test; for association between two ordinal variables use Spearman’s rank correlation.
Interval Variables: Equal Intervals Without a True Zero
An interval variable has equal-sized steps of measurement across its whole range but a zero point fixed by convention rather than by nature. Temperature in Celsius and Fahrenheit are the standard examples, along with IQ scores, SAT scores, and pH. Every degree of Celsius is the same size change everywhere on the scale, so you may add and subtract, but you may not divide.
Here the mean and standard deviation are appropriate, along with any parametric procedure: independent and paired t-tests, one-way ANOVA, Pearson correlation, and linear regression. Report means with standard deviations and, for t-tests and ANOVA, confidence intervals around the difference.
Consider pH, since it trips people up. A drop from pH 6 to pH 3 is not a doubling of acidity; pH sits on a logarithmic scale, so the underlying hydrogen ion concentration changes by a factor of one thousand. The numbers have equal spacing but the quantities they represent do not, which is exactly why pH is treated as interval.
Ratio Variables: Equal Intervals With a Meaningful Zero
A ratio variable has both equal intervals and a true zero, meaning zero represents the complete absence of the quantity being measured. Zero kilograms means no mass, zero seconds means no elapsed time, zero revenue means nothing earned. Because of that, ratio variables permit every arithmetic operation, including division, and all ratio statements hold.
Weight, height, duration, distance, age in years, income in dollars, counts, and temperature in Kelvin are all ratio variables. You can report the mean, median, and mode, standard deviation, coefficient of variation, geometric and harmonic means for skewed positive data, and use any parametric test including regression with a ratio predictor. When your data are heavily right-skewed, such as income or reaction time, the median with an interquartile range or a geometric mean tells the truer story to most readers.
Whatever level you assign, hold onto it. You can always analyse higher-level data as if it were lower, never the reverse. Grouping exact ages into young, middle-aged, and senior bands gives you data you can no longer ratio or average meaningfully. That one-way slide is called data degradation, and it is unrecoverable.
How to Code and Enter Measurement Variables in SPSS, Stata, or R
Entry is where good classification quietly goes wrong, because most software will happily accept a number and label it a quantity regardless of what it represents. The fix is to declare the level explicitly and to attach value labels rather than relying on the codes to carry meaning.
SPSS. In Variable View, set the Measure column to Nominal, Ordinal, or Scale for every variable, then define value labels under the variable’s Labels button. SPSS imports every numeric variable as Scale by default, so an imported Likert item silently arrives ready for a t-test it cannot support. Setting Measure to Ordinal changes the default charts and enables the rank-based tests in the Nonparametric submenu.
Stata. Declare the type at import with, for example, label import survey.dta, gen(agree) and then set label define agree_lbl 1 “Strongly disagree” 2 “Disagree” 3 “Neutral” 4 “Agree” 5 “Strongly agree” followed by label values agree agree_lbl. Recode with recode agree (1/2 = 1) (3 = 2) (4/5 = 3), generate(agree3) when you collapse categories, and keep that collapse documented in your methods section.
R. Base R treats a numeric column as continuous, so create an ordered factor for ordinal data: agree <- factor(agree, levels = c(1,2,3,4,5), ordered = TRUE). Levels are read in the order you give them, so a careless sort scrambles your ranks. Nominal variables become unordered factors with factor().
Across all three packages, reserve high numbers such as 99 or 999 for missing values and then convert them to a genuine missing code. And write your value labels as text rather than as bare numbers, because a reader of your output file has no way to know that 4 means agree.
Which Statistical Methods Fit Each Measurement Scale?
The mapping below covers the common cases. It is a starting point, not a permission slip: your study design, the distribution of your data, and the number of groups all affect the final choice.
| Level of measurement | Summaries | Comparing groups | Association |
|---|---|---|---|
| Nominal | Counts, percentages, mode | Chi-square test of independence | Phi or Cramér’s V from a cross-tab |
| Ordinal | Median, mode, interquartile range | Mann-Whitney U; Kruskal-Wallis H | Spearman’s rank correlation |
| Interval | Mean, median, standard deviation | t-test; one-way ANOVA | Pearson correlation; linear regression |
| Ratio | Mean, median, SD, coefficient of variation | t-test; ANOVA; Mann-Whitney if skewed | Pearson or Spearman; regression |
Interval and ratio are the only levels where the parametric tests are strictly appropriate, but that is a floor rather than a ceiling. With large samples the Mann-Whitney U and Kruskal-Wallis H tests hold up well, and many analysts report both a rank-based and a parametric result so a methods reviewer can see the conclusion does not hinge on one assumption.
The real difference between interval and ratio shows up in statements like “twice as much.” At 10 degrees Celsius water is not twice as hot as at 5 degrees. The Fahrenheit equivalents, 50 and 41, make it obvious: the Celsius reading doubles while the Fahrenheit reading does not, so the ratio claim is meaningless. Ratio variables survive that test cleanly. A 20 kg bag is exactly twice 10 kg, a 60-second wait is twice 30 seconds, because the zero is real.
Likert items sit awkwardly here, and honest analysts disagree about them. The item is ordinal by construction, since the intervals between agree and strongly agree are not established as equal. Many studies still treat the codes as interval and compute means, and that practice is defensible only when you state it and note the assumption, as Norman argued in 2010. The nuance matters most when you combine several items into a scale score. A common question on r/statistics is whether summing ordinal items produces an interval variable; the sum has more possible values, but unless the items use the same spacing throughout, the total is still an ordering of responses rather than a true quantity.
How to Report Measurement Levels in a Research Paper
Report the level, the coding, and the reason in the methods section, and then keep the write-up consistent with what you did in the analysis. Examiners and reviewers check exactly this.
A model sentence for a single variable: “Satisfaction was measured on a five-point ordinal scale ranging from 1 (very dissatisfied) to 5 (very satisfied), and responses are reported as median and interquartile range.”
A model sentence when you collapse categories: “Income was originally collected in seven bands and recoded into three ordered categories (under 30,000; 30,000 to 59,999; 60,000 or more) to improve cell counts in the cross-tabulation.”
For results, name the scale, the summary and the test in the same breath, so the reader never has to guess whether a mean was appropriate: “Weekly study hours (ratio) were higher for the intervention group, mean 6.4 hours versus 4.9 hours, t(78) = 3.12, p = .002.”
Two more sentences earn marks. State the assumption wherever you treat ordinal data as interval, and say why you were justified in reporting a mean for a Likert composite. Methods sections that explain the level choice are the ones that survive review.
Common Mistakes That Distort the Analysis
Almost every classification error I see in student analyses is one of five, and each has a straight fix.
- Averaging codes that are only labels. Averaging male and female codes tells you nothing except how many people were in the sample. Use frequencies and percentages.
- Treating ordered categories as equally spaced. Collapsing a five-point agree item into agree, neutral, and disagree does not create equal gaps, so the mean of the collapsed codes is still an assumption.
- Dividing or ratioing interval values. Halving a pH of 6 does not give you a pH of 3, and doubling 10 degrees Celsius does not give you 20 degrees Fahrenheit. Convert to Kelvin before making ratio claims.
- Taking zip codes or codes as numbers. A code is a label with a lookup table. Delete it from any calculation and keep it as an identifier only.
- Downgrading data for tidier output. Reporting exact income as three bands may look cleaner in a chart, but you have thrown away the precision that made the variable worth measuring in the first place.
None of these are disasters if you say what you did. A paragraph in the methods section stating that bands were used for reporting turns an error into a documented design choice.
Quick Self-Test for Naming the Scale
Try these before checking yourself. Answers sit underneath each one.
- Frequency of a shopper choosing checkout lane one, two, or three. Answer: nominal. The lanes are named, not ranked, and no lane is more of something than another.
- Household income reported as under 25,000, 25,000 to 49,999, and 50,000 or more. Answer: ordinal. The bands rank cleanly, but the distance between adjacent bands is not constant.
- Body temperature in Fahrenheit. Answer: interval. Steps are equal in size, but zero degrees Fahrenheit is not an absence of heat.
- Number of push-ups completed in one minute. Answer: ratio. Zero means none completed, so doubling the count doubles the effort described.
- Class position in a graduating cohort. Answer: ordinal, with a caveat worth flagging in your methods: a jump from first to second place is not the same distance as tenth to eleventh.
- Score on a 0 to 100 exam scale. Answer: interval by the usual convention, and ratio only if you can defend zero as no knowledge at all. Most textbooks file this one as interval.
If the last two felt arguable rather than obvious, that is a good sign. A few variables genuinely sit on a boundary, and the honest move is to state your rule and apply it consistently rather than to insist there is one uncontested answer.
Frequently Asked Questions
Is a Likert scale interval or ratio?
A Likert item is ordinal by construction, because the gaps between strongly disagree and disagree are not established as equal. Many analysts treat the codes as interval and compute means, which is defensible when you state the assumption and check that responses are roughly symmetric. It is never a ratio scale, since zero on a Likert item does not mean an absence of agreement.
What differentiates interval from ratio scales of measurement?
Both have equally sized steps, so both permit addition and subtraction. The difference is the zero point. A ratio scale has a true zero, where zero means complete absence of the measured property, so ratios work. Celsius is interval because zero degrees is a point on the scale, not an absence of heat. Ask whether twice the value is twice the quantity.
Can you take the mean of ordinal data?
The mean assumes equal spacing between categories, which ordinal data do not guarantee. The median and interquartile range are the defensible defaults. Many published studies report means for Likert composites anyway, and that is acceptable if you justify it with symmetric response distributions or a large sample. State the assumption in your methods section rather than leaving the reader to guess.
Is a 4-point or 5-point Likert scale better?
Neither is universally better. Four points force a decision and remove the fence-sitting middle category, but it also invites satisficing, where respondents pick a middle option just to finish. Five points keep a neutral position, which suits attitude items but spreads responses thinly in small samples. Match the choice to your sample size and to whether neutrality is a meaningful response.
What is the difference between qualitative and quantitative variables?
Qualitative variables describe qualities or group membership and are normally nominal or ordinal, such as blood type or satisfaction. Quantitative variables record amounts and are normally interval or ratio, such as temperature or weight. The distinction is not identical to the four-scale hierarchy, since an ordinal variable like a Likert response is still a numeric code underneath its qualitative nature.
Why can a variable never be upgraded to a higher measurement scale?
The information is not in the data, so it cannot be recovered by analysis. An income band hides the exact figure, and no calculation brings it back. You can always analyse higher-level data at a lower level, such as treating exact ages as ordered bands, but the reverse would require information you never collected. Design surveys toward the ratio end when you can.
Reporting the measurement level for each variable takes one pass through your codebook. Write the level down before you open the analysis menu, because the software will not ask and will happily hand you a t-test you should not run.