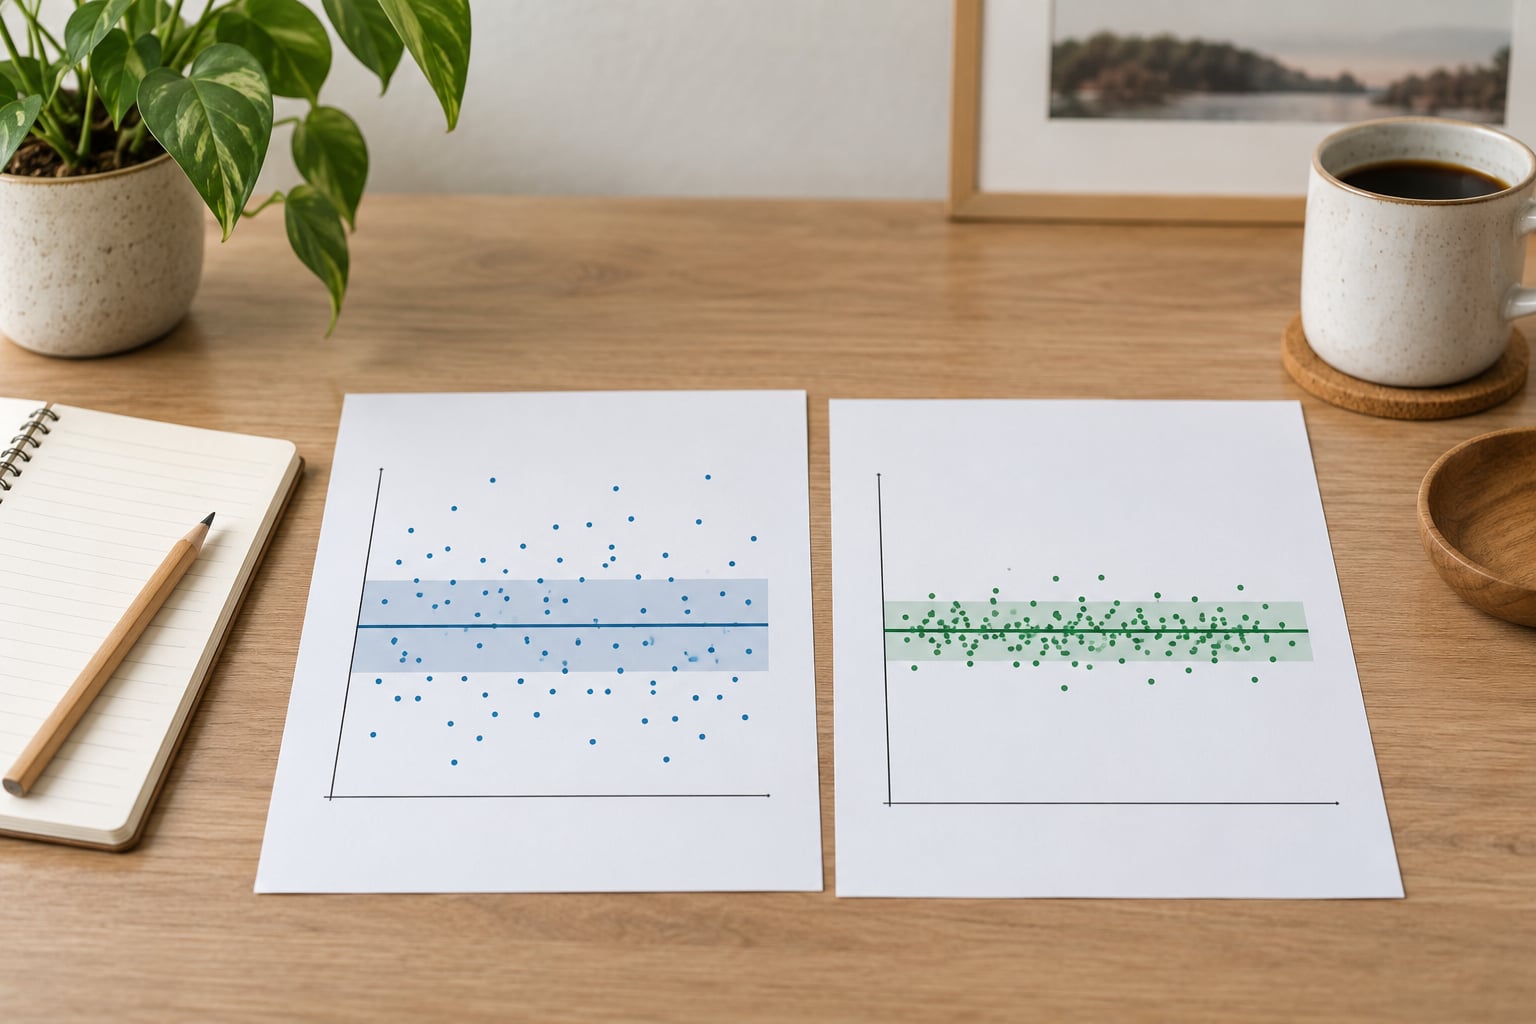
Standard deviation describes how spread out your individual data points are around the mean. Standard error describes how much that mean would move if you drew a fresh sample of the same size, and it equals the standard deviation divided by the square root of n. One describes your data. The other describes the reliability of your estimate.
That distinction trips up almost everyone who meets both measures in the same statistics course. A column labelled “Std. Error Mean” sits right next to “Std. Deviation” in SPSS output, and neither label says which question it answers.
So here is the short version before the detail. If you are describing the sample you actually collected, report the standard deviation. If you are generalising that sample to a wider population, running a hypothesis test, or drawing a confidence interval, the standard error is the number that does the work.
Table of Contents
- 1Difference Between Standard Deviation and Standard Error at a Glance
- 2What Is Standard Deviation?
- 3What Is Standard Error?
- 4How Are Standard Deviation and Standard Error Calculated?
- 5The formula for the sample standard deviation
- 6The formula for the standard error of the mean
- 7The difference between standard deviation and standard error in the same dataset
- 8Where the two columns sit in your software output
- 9How the Difference Between Standard Deviation and Standard Error Appears in Research
- 10What Does Each Measure Tell You?
- 11How Does Sample Size Affect Standard Error?
- 12When Should You Use Each Measure?
- 13Which Should You Choose?
- 14Frequently Asked Questions
- 15Is it better to use SD or SE?
- 16What is the difference between SEM and SD?
- 17When to use SD and when to use SE?
- 18How do you convert SE to SD?
- 19When should I use standard error or standard deviation for error bars?
- 20Why is my standard error smaller than my standard deviation?
- 21Conclusion
Difference Between Standard Deviation and Standard Error at a Glance
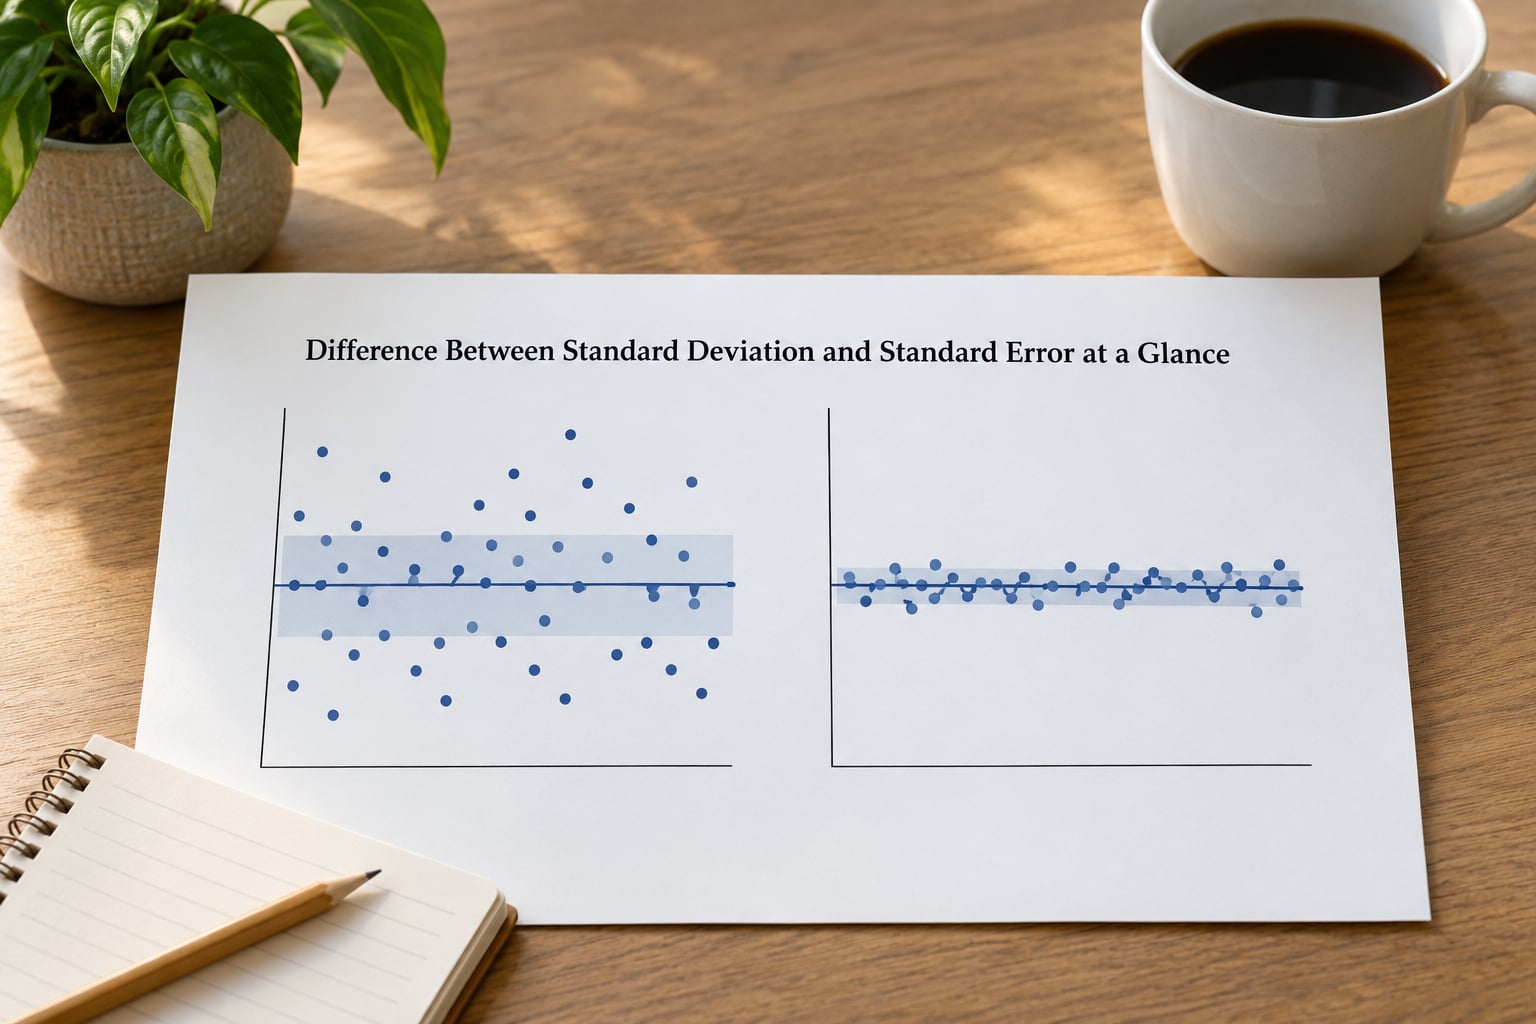
The table below lines both measures up against the same attributes. Read the “core question” row first. Almost every confusion I see traces back to skipping that line.
| Attribute | Standard deviation (SD, s) | Standard error (SE, SEM) |
|---|---|---|
| What it measures | Spread of individual observed values around the mean | Spread of the sample mean across repeated samples of size n |
| Core question | How varied are the values I actually have? | How precise is my estimate of the true mean? |
| Formula | SD = sqrt( sum of (x minus mean) squared, divided by n minus 1 ) | SE = s divided by sqrt(n) |
| Notation | Lowercase s for the sample estimate, sigma for the population value | SE or SEM, always tied to the statistic being estimated |
| Units | Same units as the variable, such as points, dollars or milliseconds | Same units as the variable |
| Effect of sample size | Unaffected by adding more observations from the same population | Shrinks as the square root of n grows |
| Statistic type | Descriptive | Inferential |
| Feeds into | Describing data, range checks, quality control | Confidence intervals, t-tests, regression standard errors, margin of error |
| Reporting example | Scores averaged 79.0 with a standard deviation of 11.2 points | Scores averaged 79.0, standard error 3.54, 95% CI 71.0 to 87.0 |
Note the units row. Both come out in the units of the variable, which is why they get mixed up on a chart. Same units does not mean same meaning.
What Is Standard Deviation?
Standard deviation summarises how far individual observations sit from the mean, on average. A value of 0 means every single observation landed exactly on the mean. A large value means the data are strewn out.
The sample standard deviation divides by n minus 1 rather than n. That small adjustment corrects a known bias: dividing by n systematically underestimates the spread of the population your sample came from. Degrees of freedom, in this context, simply means n minus 1.
Here is how to read a number. If your scores have a mean of 79 and a standard deviation of 11.2, a typical score sits roughly 11 points above or below 79. Under a roughly normal distribution, about 68 percent of scores fall within one standard deviation of the mean and about 95 percent within two. That is the empirical rule, and it only holds when the distribution is close to bell-shaped and free of extreme outliers.
Standard deviation never changes because you added more data. If you collect ten more scores from the same process, the spread describes the same population and lands in roughly the same place. Sometimes it moves a little. It does not shrink on schedule.
What Is Standard Error?
Standard error is the standard deviation of a statistic rather than of the raw data. The cleanest case is the standard error of the mean: imagine drawing sample after sample of 10 scores and calculating the mean each time. Those means would not all land on the same number, and the standard error is how much they bounce around.
The clearest explanation I have heard comes from statistics forum regulars, who tend to arrive at the same line: standard deviation is how much the data moves right now, standard error is how much the mean moves if you repeat the study. That framing survives contact with real analysis better than most textbook definitions.
Every statistic has its own standard error. For a sample mean it is s divided by sqrt(n). For a sample proportion p it is the square root of p times one minus p, divided by n. For the difference between two independent means you add the two standard errors in quadrature. Reporting the standard error of the median needs a different approach again, since the median has no simple closed form.
How Are Standard Deviation and Standard Error Calculated?
Both start from the same place, the squared deviations from the mean. The standard deviation stops there. The standard error divides by the square root of n as well, which is the entire difference between the two numbers.
The formula for the sample standard deviation
SD = sqrt( sum of (x minus mean) squared, divided by n minus 1 )
The square root at the end is what returns you to the original units. Without it you are left with a variance, which is in squared units and hard to interpret on its own.
The formula for the standard error of the mean
SE = s divided by sqrt(n)
Divide a standard deviation of 11.19 by n equals 10 and you get 3.54. Same data, same mean, one extra step.
The difference between standard deviation and standard error in the same dataset
Ten exam scores: 62, 70, 78, 85, 90, 65, 74, 82, 88, 96. The mean is 79.0 and the sum of squared deviations from that mean is 1128.
Divide 1128 by 9 and you get a variance of 125.33. The square root of that is an SD of 11.19 points. Now divide 11.19 by the square root of 10, which is 3.162, and the standard error comes out at 3.54.
Turn that into a confidence interval. With 10 observations you have 9 degrees of freedom, so the t critical value at 95 percent is 2.262 rather than the large-sample 1.96. Multiply 2.262 by 3.54 and you get 8.01, which gives a 95% confidence interval running from 70.99 to 87.01. Using 1.96 gives 72.06 to 85.94, which is the version you will see in software that defaults to z.
That interval is the payoff for computing the standard error at all. It tells you the plausible range for the true mean given what you observed, and its width is driven entirely by SE.
Where the two columns sit in your software output
SPSS DESCRIPTIVES produces a table with “Std. Deviation” and “Std. Error Mean” as adjacent columns. The first is your s. The second is s divided by sqrt of the valid N for that variable, so a variable with missing values gets a slightly different SE than the raw count suggests.
In R, sd(x) returns the sample standard deviation. summary(x) does not print an SE directly, but the t.test() output does, alongside its confidence interval. In Stata, summarize reports the standard deviation and the standard error of the mean as separate lines. In Excel, STDEV.S gives the sample standard deviation, and you build the standard error by dividing that cell by SQRT(COUNT(range)).
None of these packages label the columns with a sentence explaining the difference. That is why this question comes up so often on statistics forums, and why the answer is worth writing down.
How the Difference Between Standard Deviation and Standard Error Appears in Research
Back to those ten exam scores. Here are two true sentences about the same study.
Sentence one: students scored a mean of 79.0 with a standard deviation of 11.2 points. Sentence two: the mean score was 79.0 points with a standard error of 3.54, giving a 95% confidence interval of 71.0 to 87.0.
Sentence one tells a reader what individual performance looked like. Somebody scored 62. Somebody scored 96. If you are describing a cohort, comparing it with another cohort descriptively, or checking whether scores are suspiciously tight, that is your number.
Sentence two tells a reader how much confidence to put in 79 as a statement about the wider course population. It supports the claim that the population mean is probably somewhere between 71 and 87. If you are testing whether the cohort beat a benchmark of 75, this is the sentence that does the work.
Neither sentence contradicts the other. Publishing only the first leaves readers unable to judge precision. Publishing only the second hides how much individual scores varied. Good results sections usually carry both, often with the standard deviation in the text and the standard error behind the error bars on the figure.
What Does Each Measure Tell You?
Standard deviation answers a question about the data you have. How dispersed are these values? How much do individual cases differ from each other? It is a descriptive statistic, and it stays inside the sample.
Standard error answers a question about your estimate. How far is my sample mean likely to sit from the population mean? It is an inferential statistic, and it only makes sense once you intend to generalise beyond your sample.
Here is the part people get wrong. A small standard error does not mean tidy data. You can collect 10,000 readings from a wildly unstable process, get a precise estimate of a mean that is meaningless, and watch the standard error shrink to almost nothing while the standard deviation stays enormous. Precision is not the same as consistency.
The reverse also holds. Large data spread with a small sample size gives a large standard error and a wide confidence interval, even though the descriptive story is completely clear.
How Does Sample Size Affect Standard Error?
Because SE divides by the square root of n, sample size buys you precision at a brutal rate. Holding the spread constant at 11.19:
| Sample size n | Standard deviation | Standard error | Change from the previous row |
|---|---|---|---|
| 10 | 11.19 | 3.54 | Baseline |
| 40 | 11.19 | 1.77 | Halved |
| 100 | 11.19 | 1.12 | Cut by a further third |
| 400 | 11.19 | 0.56 | Halved again |
Quadrupling the sample halves the standard error. To halve the standard error again you need to quadruple the sample a second time, landing at 1,600 observations for a fourfold improvement. This is why sample size planning works in square-root steps rather than linear ones.
The standard deviation column is the important control. It does not move at all. Adding observations reduces uncertainty about the mean, not the variability of the underlying process.
The classic demonstration is to draw many samples of the same size from one population and watch the sample means cluster tightly as n grows. Statistics educators on quality and measurement forums often say this repeated-draw exercise, rather than the formula, is the moment the concept finally lands.
When Should You Use Each Measure?
Use the standard deviation when your job is to describe the observations. Cohort descriptions, score summaries, quality control on a production line, checking whether a data import introduced errors, or reporting the spread of a survey construct all belong here.
Use the standard error whenever the population is the target. Confidence intervals, t-tests, ANOVA, regression tables and margin-of-error calculations all consume it. Regression output is a good example: the standard error of each coefficient comes from this same machinery, and it is what drives the significance tests in the table.
For error bars on a figure, the honest answer is that it depends on what your reader needs to judge. Standard deviation bars show how much the raw values vary. Standard error bars show how precisely you have pinned down the mean. State which one you used in the caption, every time, because the two look identical on the page and imply different conclusions.
On the error-bar overlap question, the recurring forum consensus is worth repeating here: overlap between standard deviation bars says nothing about statistical significance. Whether two means differ significantly depends on their standard errors, the sizes of both groups, and the specific test, not on whether two ribbons happen to cross.
One warning. The formula s divided by sqrt(n) assumes independent observations. With clustered data, repeated measures on the same participants, weights, or a complex survey design, observations within a cluster are correlated, so that formula understates the true standard error. A clustered or survey-aware design needs a design-based standard error instead.
Skewed or heavy-tailed data raise a second flag. The standard error of the mean assumes the sampling distribution of the mean is roughly normal, which the central limit theorem gives you for large samples from finite variance. With a small sample and extreme outliers, the standard error of the mean can mislead badly, and a bootstrap interval is often the safer route.
Which Should You Choose?
Ask yourself one question first: am I describing the data I collected, or am I estimating something beyond it? The answer picks the measure for you.
| If you are… | Use | Because |
|---|---|---|
| Summarising a sample in a results section | Standard deviation | Readers want to know how spread the observed values were |
| Building a 95% confidence interval | Standard error | The interval width is the critical value times the SE |
| Reporting a hypothesis test result | Standard error | Test statistics divide by the SE of the estimate |
| Comparing two groups descriptively | Both | SD shows the spread in each group, SE shows the precision of each mean |
| Drawing error bars on a bar chart | Usually standard error, labelled | Readers of means care about precision, but the caption must say so |
| Plotting individual observations or distributions | Standard deviation, or no bars at all | Raw points already show the spread |
| Planning a sample size | Both | You assume an expected SD and solve for the SE you can afford |
If you can only report one, report the standard deviation. It is the more descriptive of the two and the one readers can use to picture the data. Add the standard error whenever the sentence makes a claim about something wider than your sample.
A sentence you can paste into a results section: “The mean was 79.0 points (SD = 11.2, SE = 3.54), 95% CI [71.0, 87.0], n = 10.” That single line answers every question a reviewer is likely to ask.
Frequently Asked Questions
Is it better to use SD or SE?
It depends on the claim, not on which looks better. Standard deviation is better when you describe the data you collected, because it shows how spread the individual values are. Standard error is better when you estimate something beyond your sample, such as a population mean, because it shows how precise that estimate is. If you can report only one number, the standard deviation is the safer default, since it describes the sample directly.
What is the difference between SEM and SD?
SEM is the standard error of the mean. SD is the standard deviation of the raw observations. SD measures the spread of your actual data points around the mean, while SEM measures how much the sample mean would move if you repeatedly drew new samples of the same size. The two share units and the SEM is always the smaller of the pair, because it divides the SD by the square root of n.
When to use SD and when to use SE?
Use SD when the statement is about the observations themselves: a cohort description, a score summary, a quality control check. Use SE when the statement is about a population, a comparison, or an interval: confidence intervals, t-tests, regression tables, margin of error. For a figure showing group means, SE bars are the usual choice, provided the caption states that clearly.
How do you convert SE to SD?
Multiply instead of divide: SD equals SE multiplied by the square root of n. Working in the other direction, divide the standard deviation by the square root of n to get the standard error. The conversion needs the same n you used originally, so keep it recorded. With a mean of 79.0, an SE of 3.54 and n of 10, the SD comes back to 11.19.
When should I use standard error or standard deviation for error bars?
Choose standard deviation bars when the point is how much individual values vary, for example in a distribution or a quality chart. Choose standard error bars when the point is how precisely you have estimated a mean, which is the usual case for bar charts of group means. Whichever you pick, say so in the caption, because the two are visually identical and imply very different things.
Why is my standard error smaller than my standard deviation?
Because it is the standard deviation divided by the square root of n, and the square root of n is always greater than one once you have more than one observation. For n = 10 the divisor is 3.16, so the standard error comes out at roughly a third of the standard deviation. That is expected behaviour, not a calculation error. A standard error equals the standard deviation only at n equals 1, where no estimate is possible.
Conclusion
Standard deviation describes the spread of the values you observed, and standard error describes the precision of the estimate you built from them, with SE equal to SD divided by the square root of n. Report the standard deviation whenever you are describing data variability, and add the standard error whenever you make a claim about a wider population, test a hypothesis, or draw a confidence interval.